
Mesoscale Patterns Identification through SST Image Processing
Marco Reggiannini
1 a
, Jo
˜
ao Janeiro
2 b
, Fl
´
avio Martins
3 c
, Oscar Papini
1 d
and Gabriele Pieri
1 e
1
Institute of Information Science and Technologies, National Research Council of Italy,
Via G. Moruzzi, Pisa, Italy
2
University of Algarve, Centre for Marine and Environmental Research – CIMA,
Campus de Gambelas, Faro, Portugal
3
University of Algarve, Centre for Marine and Environmental Research – CIMA, Institute of Engineering ISE,
Campus de Gambelas, Faro, Portugal
Keywords:
Image Processing, Remote Sensing, Mesoscale Patterns, Sea Surface Temperature.
Abstract:
Mesoscale marine phenomena represent important features to understand and include within predictive mod-
els, which provide valuable information for proper environmental policy making. For example the rearrange-
ment of the organic substances, consequent to the dynamics of the water masses affected by the mentioned
phenomena, meaningfully modifies the actual condition of local habitats. Indeed it may facilitate the onset of
non resident living species at the expense of resident ones, eventually affecting related human activity, such
as commercial fishery. Objective of this work is the detection and identification of mesoscale events, in terms
of specific marine surface patterns that are observed throughout such events, e.g. water filaments, counter-
currents, meanders due to upwelling wind actions stress. These phenomena can be studied and monitored
through the analysis of Sea Surface Temperature images captured by satellite missions, such as Metop, and
MODIS Terra/Aqua. A quantitative description of such events is proposed, based on dedicated algorithms that
extract temporal and spatial features from the images, and exploit them to provide a signature discriminat-
ing different observed scenarios. Preliminary results of the application of the proposed approach to a dataset
related to the southwestern region of the Iberian Peninsula are presented.
1 INTRODUCTION
The impact of climate change on marine ecosys-
tems is often expressed by simplified warming trends
(Hansen et al., 2010). Although this approximation
may be valid for oceanic regions, in coastal areas the
impact of warming on the ecosystems is far from be-
ing homogeneous. This is mainly due to the fact that
coastal regions host some of the most biodiverse and
variable environments of the ocean.
Near the coast, global drivers are modified by
topography and by local atmospheric and oceano-
graphic circulation patterns, including upwelling. Ek-
man dynamics and large-scale thermocline processes
control the coastal upwelling occurring at the Eastern
Boundary Upwelling Ecosystems (EBUEs) (Messi
´
e
a
https://orcid.org/0000-0002-4872-9541
b
https://orcid.org/0000-0002-6241-8520
c
https://orcid.org/0000-0002-9863-6255
d
https://orcid.org/0000-0003-2069-5068
e
https://orcid.org/0000-0001-5068-2861
et al., 2009; Ramajo et al., 2020). Winds directed
towards the Equator drive upwelling by transporting
deeper, colder and nutrient-rich waters to the surface,
where phytoplankton production is triggered by sun-
light (Sydeman et al., 2014). As a result, these areas,
through the upwelling, give strength to the most pro-
ductive ecosystems in the global ocean (FAO, 2018),
playing a major role in the marine primary produc-
tion and the worldwide fisheries (7% of global ma-
rine production and more than 20% of global fish
catches), thus providing a high number of subsistence
and benefits to human society (Levin and Le Bris,
2015). Apart from the nutrient load, it was recently
shown that upwelled water’s low long-term warming
rates may provide thermal refugia, stabilize changes
in species distributions and enhance local biodiversity
(Varela et al., 2018).
According to related literature, more than 71% of
coastal zones are experiencing a net heat gain due
to global warming (IPCC, 2019). Yet, it is diffi-
cult to systematize the trends observed in different
upwelling ecosystems across the global oceans, as
Reggiannini, M., Janeiro, J., Martins, F., Papini, O. and Pieri, G.
Mesoscale Patterns Identification through SST Image Processing.
DOI: 10.5220/0010714600003061
In Proceedings of the 2nd International Conference on Robotics, Computer Vision and Intelligent Systems (ROBOVIS 2021), pages 165-172
ISBN: 978-989-758-537-1
Copyright
c
2021 by SCITEPRESS – Science and Technology Publications, Lda. All rights reserved
165

positive trends were observed in the coastal areas
of Benguela, Peru, northern California, and Canary
while significant negative trends were found along
Chile, Somalia, and southern and central California
coasts (Varela et al., 2015). Therefore, it is surmised
that every upwelling ecosystem reacts differently to
the changing climate.
Among the world’s EBUEs, the Iberia/Canary
Current System (ICCS) is one of the least studied
(Chavez and Messi
´
e, 2009). Several research stud-
ies have focused on the western Iberian oceanogra-
phy (Relvas et al., 2007). Despite a general circu-
lation similar to other EBUEs, in ICCS the disconti-
nuity imposed by the Mediterranean Sea, combined
with the seasonality of the large-scale atmospheric
circulation, have a profound impact on the regional
oceanography. Time scales of a few tens of days ex-
plain more than 70% of the variability of the coastal
alongshore wind stress, a major factor governing the
regional coastal circulation (
´
Alvarez-Salgado et al.,
2003). The region’s continental shelf, with less than
10 km wide south of Lisbon, 30–40 km wide off cen-
tral Portugal and somewhat narrower again off north-
ern Portugal and Galicia, is characterized by a large
number of topographical features, such as prominent
capes, promontories and submarine canyons, whose
spatial scales are tens to hundreds of kilometers (Rel-
vas et al., 2007). All the above highlight the impor-
tance of sub-seasonal temporal scales and sub-basin
spatial scales, which explain the observed oceano-
graphic patterns. In a review paper (Relvas et al.,
2007), the physical oceanography of the western
Iberia system is described and characterized through
the main mesoscale features related to that region.
They include a succession of mesoscale structures
such as jets, meanders, ubiquitous eddies, upwelling
filaments and counter-currents, superimposed on the
more stable variations at seasonal timescales, as sug-
gested by several authors (Relvas et al., 2007).
The identification and cataloguing of upwelling
features occurring in an EBUE is an important
achievement towards the characterization of the sys-
tem. Traditionally that task has been performed sub-
jectively by experts, analyzing Sea Surface Temper-
ature (SST) maps of the area of interest. The use of
upwelling indices has also been used as a first guess
directing the experts towards the dates and events to
be analyzed (Lamont et al., 2018), but a visual inspec-
tion has been always needed to certify the presence of
an upwelling and, above all, to classify the type of
upwelling. This procedure is manageable if few tens
or even hundreds of images are used but it turns into
an impossible task to analyze thousands of images, as
needed to identify the effects of climate change.
The main objective of this work is to design and
develop automatic methods capable of accepting mas-
sive datasets of oceanographic SST imagery as input
and returning the classified images as output. The out-
put classification labels reflect the different regimes of
observable upwelling patterns. The identification of a
specific temperature pattern will be based on the ex-
traction of quantitative features from the SST maps.
Particular attention will be devoted to those features
that reflect the signal variability (e.g. gradient-based
indicators). Indeed the emergence of a certain pat-
tern is usually highly correlated with peculiarities
in the temperature spatial arrangement at time fixed
(e.g. the presence of abrupt variations in the tempera-
ture values within a certain neighborhood) as well as
with the observation of specific temperature trends at
fixed locations, providing insights about the flowing
of water masses between points at different tempera-
ture values. A dedicated visualization tool has been
developed to organize the relevant information in a
single plot, so that SST patterns relative to specific
mesoscale events are easily recognizable.
The proposed methods will be applied to the South
Iberian region, contributing to the understanding of
the effects of climate change in this particular EBUE.
In this article, a preliminary methodology is proposed,
and demonstrated using SST remote sensing images.
In its preliminary form the metrics used are able to
identify different types of mesoscale features, but dif-
ferent variables and arrangements still need to be
tested, as discussed in the text.
The paper is arranged as follows: Section 2 con-
cerns a detailed description of the employed dataset,
the related ground truth classification, visually per-
formed by expert users, and a description of the de-
veloped processing tools; Section 3 presents some
preliminary outcomes resulting from the application
of the proposed methods to the selected dataset; Sec-
tion 4 concludes the paper with a final discussion and
future works.
2 MATERIALS AND METHODS
2.1 SST Imagery
Seasonal mesoscale features shape the regional ocean
surface circulation of the South Iberian coast, affect-
ing the physical, chemical and biological processes
that occur at the surface layer (Lopes et al., 2014).
To look for seasonal mesoscale circulation pat-
terns, satellite images from both NASA’s Aqua and
EUMETSAT’s METOP satellites were selected start-
ing from 2009. Aqua’s satellite data was retrieved
ROBOVIS 2021 - 2nd International Conference on Robotics, Computer Vision and Intelligent Systems
166
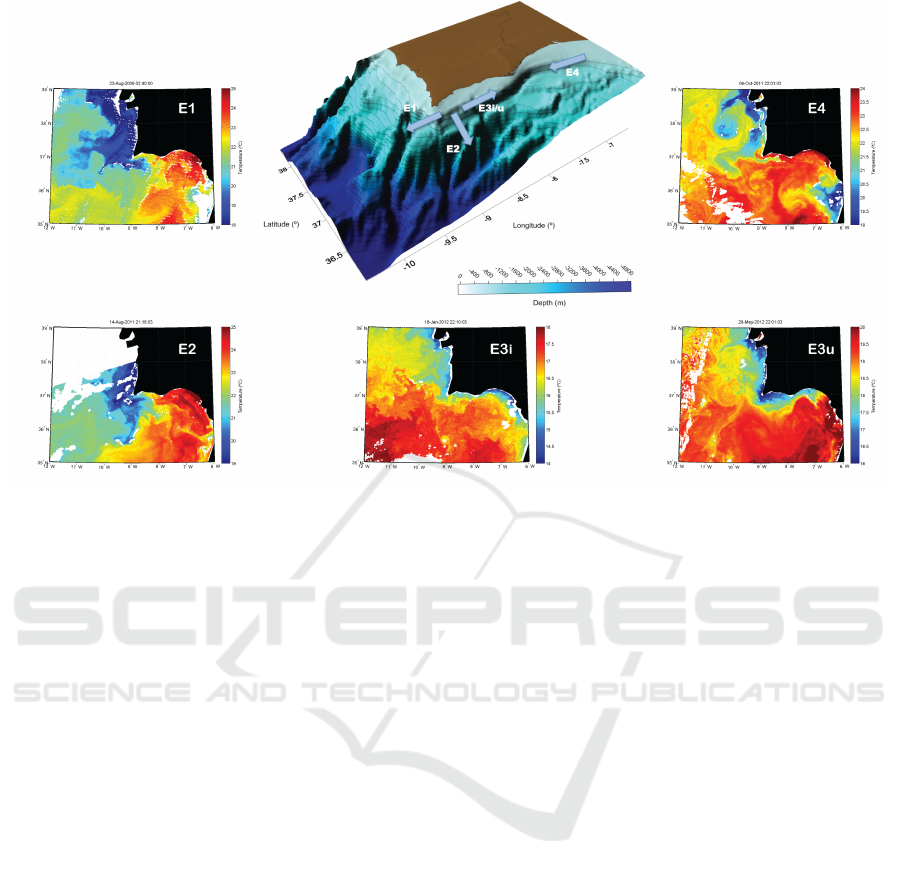
Figure 1: Mesoscale patterns in the South-Western Iberian Peninsula.
from NASA’s Ocean Color webpage and it consists of
a dataset of 470 binned 4 km (night time) SST images
obtained through its MODIS sensor. The data was
visually selected and only swaths with relevant cov-
erage were downloaded. The METOP dataset com-
prised approximately 7800 daily world SST images
from its Advanced Very-High-Resolution Radiome-
ter (AVHRR) sensor with 1 km resolution and was
retrieved from OSI-SAF webpage for the period of
interest. The data was pre-processed applying a filter
to select the images covering the geographical limits
of the study area.
2.2 Patterns of Interest
A visual inspection of the combined MODIS/METOP
SST dataset has been performed by experts, in or-
der to identify a minimal set of temperature patterns,
whose occurrence is repeatedly observed throughout
the dataset time range. As a result of this label-
ing generation process, five typologies of mesoscale
events have been recognized as the most representa-
tive within the South Iberian coast area (see Figure 1).
The first mesoscale pattern, here defined E1, is as-
sociated with the meander of the southward upwelling
jet to the west, near Cape S. Vicente, alongside oc-
curring the development of upwelling filaments. Pat-
tern E2 is depicted by the southwards flow of the
upwelling jet overpassing the Cape S. Vicente form-
ing an extended meridional filament. A clear signal
of cool water throughout the southern Iberian coast
without detachment is what defines pattern E3. After
a careful analysis of the dataset, it has been verified
that pattern E3 usually takes place in a twofold mode.
When the signal of cool water throughout the south-
ern Iberian coast was associated with a small thermal
gradient within the adjacent Gulf of Cadiz waters, the
pattern has been classified as E3i. In the satellite im-
age dataset, this event is more frequent during winter
with the warm water along the Iberian shelf edge and
slope being associated with the upsurge of a poleward
flow (Peliz et al., 2005), a direct effect of the shift in
wind direction verified during wintertime. The sec-
ond type of E3 pattern, named E3u, is related to the
occurrence of a significant thermal gradient within the
Gulf of Cadiz waters. The cool water signal was as-
sociated with the upwelling jet turning Cape S. Vi-
cente while flowing through the south Iberian coast.
Finally, in pattern E4, a warm counter-current (Rel-
vas and Barton, 2005) develops near the south Iberian
coast, turning around Cape S. Vicente and flowing
northwards near the coast.
Based on this ground truth labeling, dedicated
image processing methods have been designed and
preliminary developed with the objective of auto-
matically detect and classify the above mentioned
mesoscale patterns in the South-Western Iberian
coast.
Mesoscale Patterns Identification through SST Image Processing
167
36.0
◦
N
36.5
◦
N
8.5
◦
W 8.0
◦
W
24-Jul
31-Jul
07-Aug
16
17
18
19
20
21
22
Temperature (
◦
C)
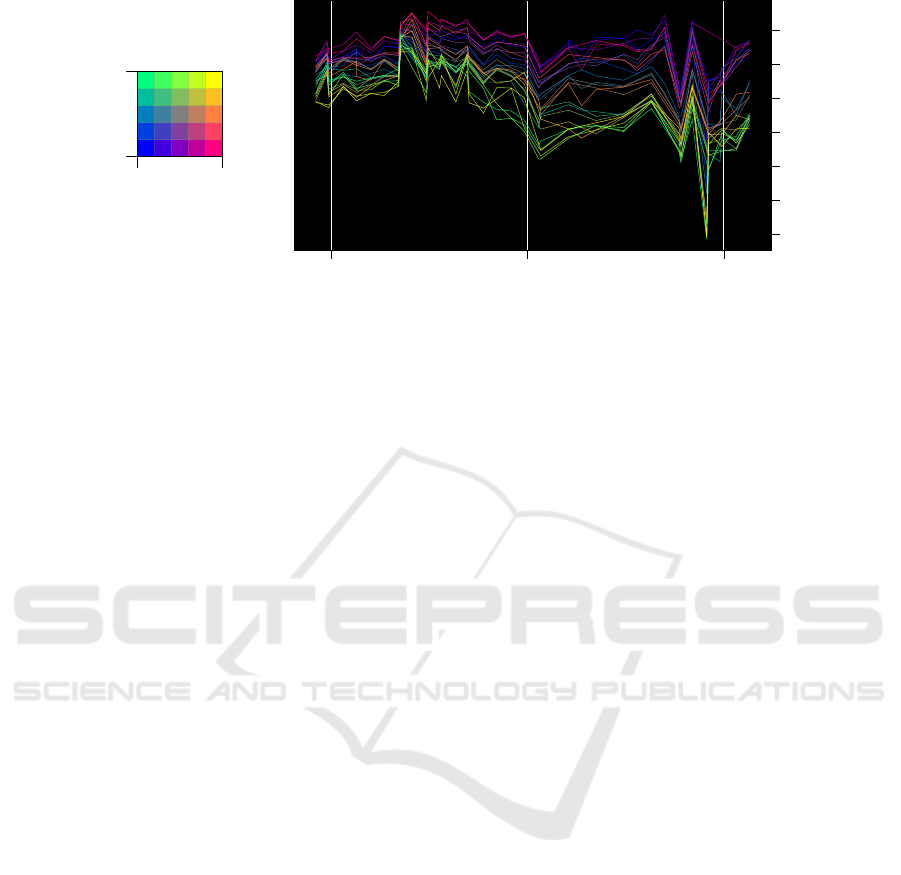
Figure 2: Example of a spaghetti plot. Each square in the reference grid (on the left) corresponds to the plot of the same color
in the graph on the right, so it is easy to associate SST trends with a geographical area.
2.3 Processing Methods
In order to extract and organize the information from
the satellite SST data a small suite of custom Python
scripts has been developed.
The main goal of the analysis is to detect a specific
event at a given time, recognize its typology, but also
inspect the dynamic evolution preceding the consid-
ered observation time. The occurrence and the type
of an event is analyzed by looking at the SST trend in
small selected areas off the coast.
The developed tool takes as input a folder contain-
ing files from the datasets, a time range and the coor-
dinates of a rectangular area and returns a spaghetti
plot obtained in the following way:
1. the area is divided into a grid of very small squares
of fixed dimension (typically 0.02–0.05 degrees of
latitude/longitude);
2. for each square, a mean temperature value is com-
puted by taking the file corresponding to a given
time and averaging all the SST data with geo-
graphical coordinates contained in the square;
3. for each square, a series of temperature values is
computed, following the instructions of the pre-
vious step, for every step in the considered time
range and the resulting temperature series is plot-
ted against time;
4. the spaghetti plot is composed by superimposing
the plots relative to all the squares.
Each square of the grid is color-coded so that simi-
lar colors are assigned to neighboring squares. The
graphs in the spaghetti plot are colored according to
the corresponding square in the grid. This way it is
easier to identify the behavior of different zones in-
side the target area (see Figure 2).
The main problems encountered while processing
the signals and generating the spaghetti plots relate
to the quantity and quality of the data. In fact, the
satellites provided only a few (two or three) images
per day over the area of interest, and it was very likely
that those images couldn’t be used at all because of
missing data (which may be caused by some external
factor, e.g. presence of clouds). One possible solution
to these issues, also aim of future research activity,
will be to introduce additional datasets (possibly from
different remote sensing missions) to fill the missing
gaps.
Another aspect that has to be taken into account
is the reliability level of the signal in the SST maps,
which sometimes may cause misleading interpreta-
tions. For example, it is usual to observe that the
temperature measured at the boundary of a region of
missing data (marked as “cloud” in the file) is very
low compared to the temperature that we expect when
looking at the neighboring data. Indeed, the exploited
datasets are provided with a quality label among the
usual metadata, i.e. a quality level that is assigned to
each point for which SST is measured. In the example
above, both the missing data region and the surround-
ing low temperature points are marked in the product
metadata as “bad quality” data. This information can
be used to improve the overall quality of the spaghetti
plot — in fact, we included in our scripts a couple
of control switches that allow the user to adapt the
computation in the above described step 2 by either
discarding completely the bad quality data, or com-
puting a weighted average with lower weight given to
bad quality data.
Once the spaghetti plots have been obtained, an
analytical reasoning is performed in association with
the ground truth defined by experts as defined above
in Section 2.2. The goal is to identify and associate
different dynamic patterns with different events (in-
cluding also a no-event situation), so that an auto-
matic supervised association could be made out of the
ROBOVIS 2021 - 2nd International Conference on Robotics, Computer Vision and Intelligent Systems
168
36.5
◦
N
37.0
◦
N
9.5
◦
W 9.0
◦
W
35.0
◦
N
36.0
◦
N
37.0
◦
N
38.0
◦
N
39.0
◦
N
40.0
◦
N
12.0
◦
W
11.0
◦
W
10.0
◦
W
9.0
◦
W
8.0
◦
W
7.0
◦
W
6.0
◦
W
17
◦
C
18
◦
C
19
◦
C
20
◦
C
21
◦
C
22
◦
C
23
◦
C
05-Sep
10-Sep
15-Sep
20-Sep
15
16
17
18
19
20
21
22
Temperature (
◦
C)
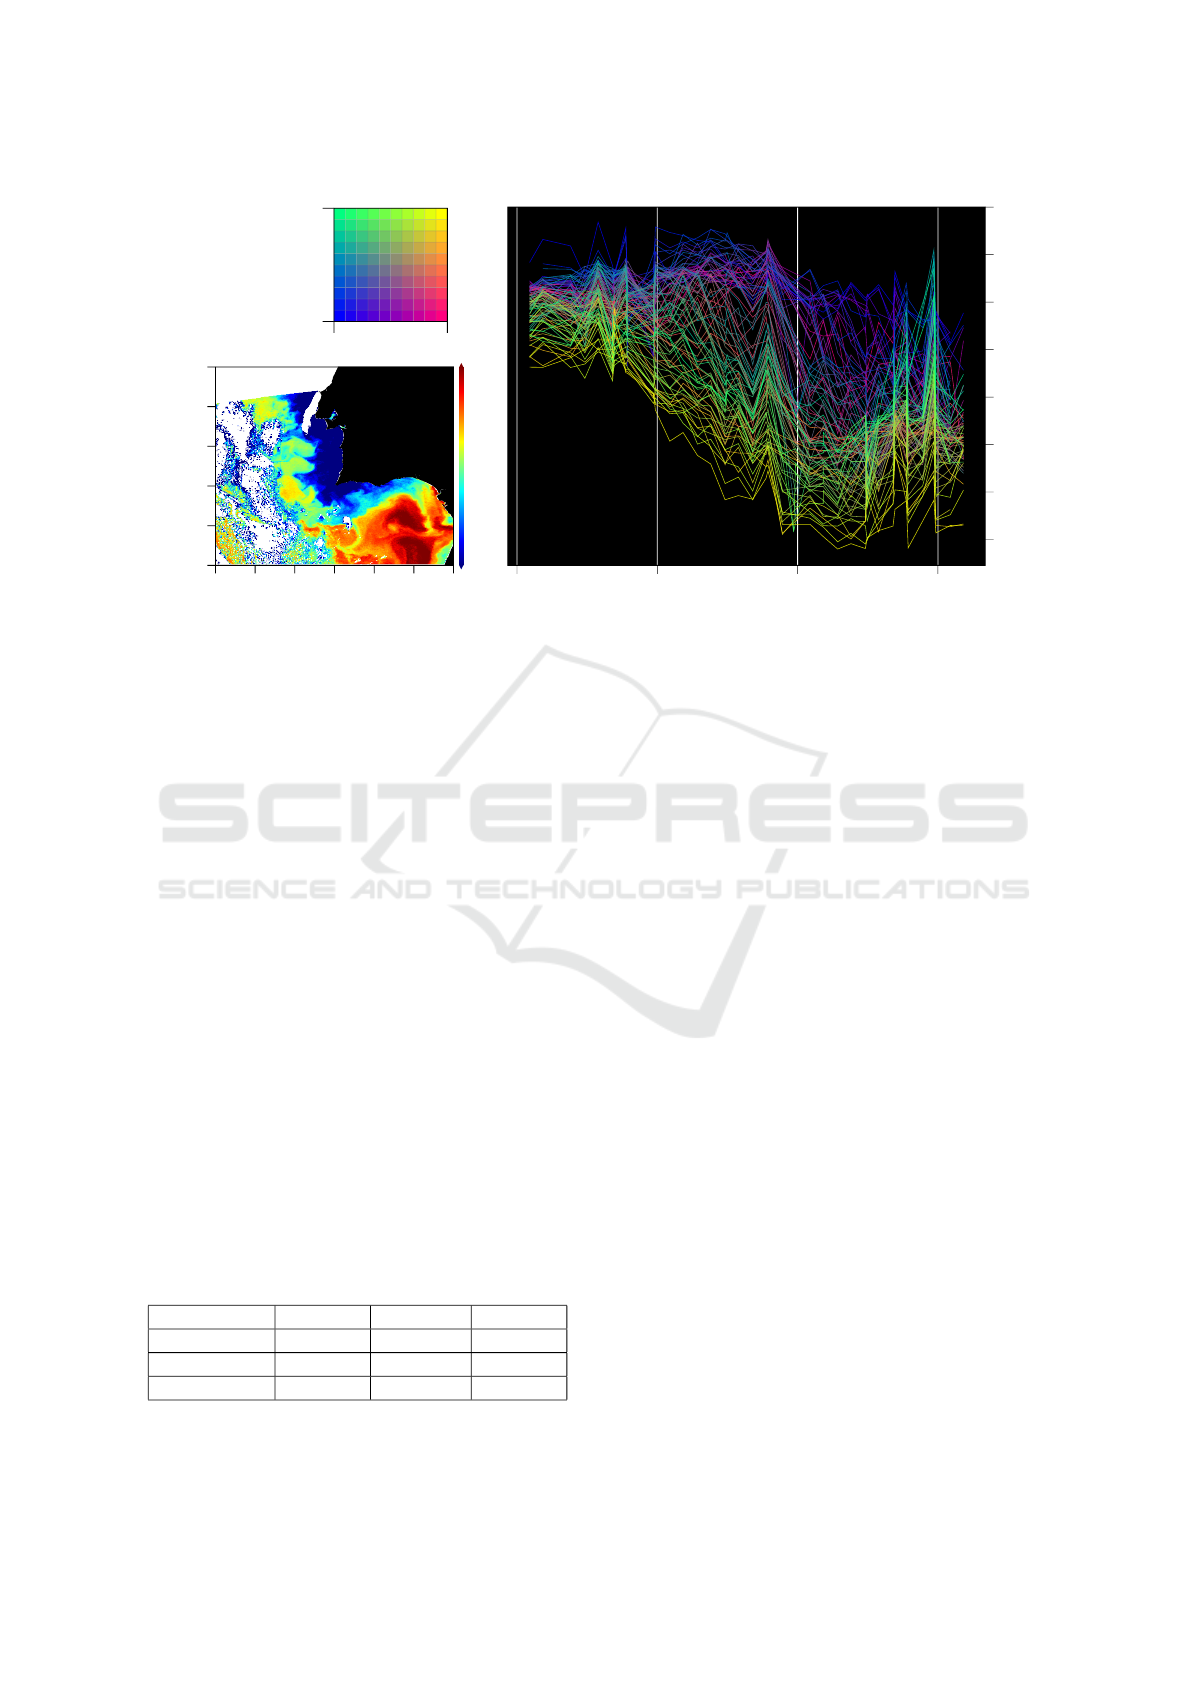
Figure 3: Event of 19 September 2017. Top left: reference map for the plot; bottom left: SST map at the date of the event;
right: generated spaghetti plot.
described computations. The following section con-
cerns the description of some preliminary results of
this ongoing analysis, including the analytical reason-
ing behind.
3 PRELIMINARY RESULTS
Several processing and analysis have been performed
within the dataset, in particular the year 2017 was
selected as a preliminary study case. Following the
classifications given by experts, with a series of dif-
ferent events identified at specific dates, the dynamic
analysis considering n days before the classified event
has been processed in a geographical area around the
event of interest. The spaghetti plots produced were
then associated with the classifications assigned to the
specific events and then analyzed together with the
experts.
The following table lists three specific events cho-
sen for this paper as a preliminary result, together
with the subsequent reference figures, the number of
backward days T
n
analyzed for the dynamic of the
event, and a brief description of the event.
Table 1: List of analyzed events.
Date (T
0
) Ref. Fig. Time T
n
Type
19-Sep-2017 Fig. 3 −14 days E3u
5-Oct-2017 Fig. 4 −16 days E4
27-Jun-2017 Fig. 5 −11 days No event
Following the application of our methodology, the
results in the form of spaghetti graphs, as described
in Section 2.3, are shown for each selected event and
period. The small map in each figure represent the
color identification for the respective spaghetti plot as
described in Section 2.3, where each line in the plot is
relative to the region of the same color.
The first example (Figure 3) is a typical mesoscale
event, identified by the experts as of type E3u rep-
resenting a cold current going southward to the end
of Iberian Peninsula, crossing Cape S. Vicente, and
then moving eastward towards the Mediterranean Sea.
As it can be seen from the relative spaghetti plot, the
temperatures in the upper right corner (close to Cape
S. Vicente) are decreasing to a much higher gradi-
ent with respect to the other surrounding areas — this
identifies a possible first dynamic pattern.
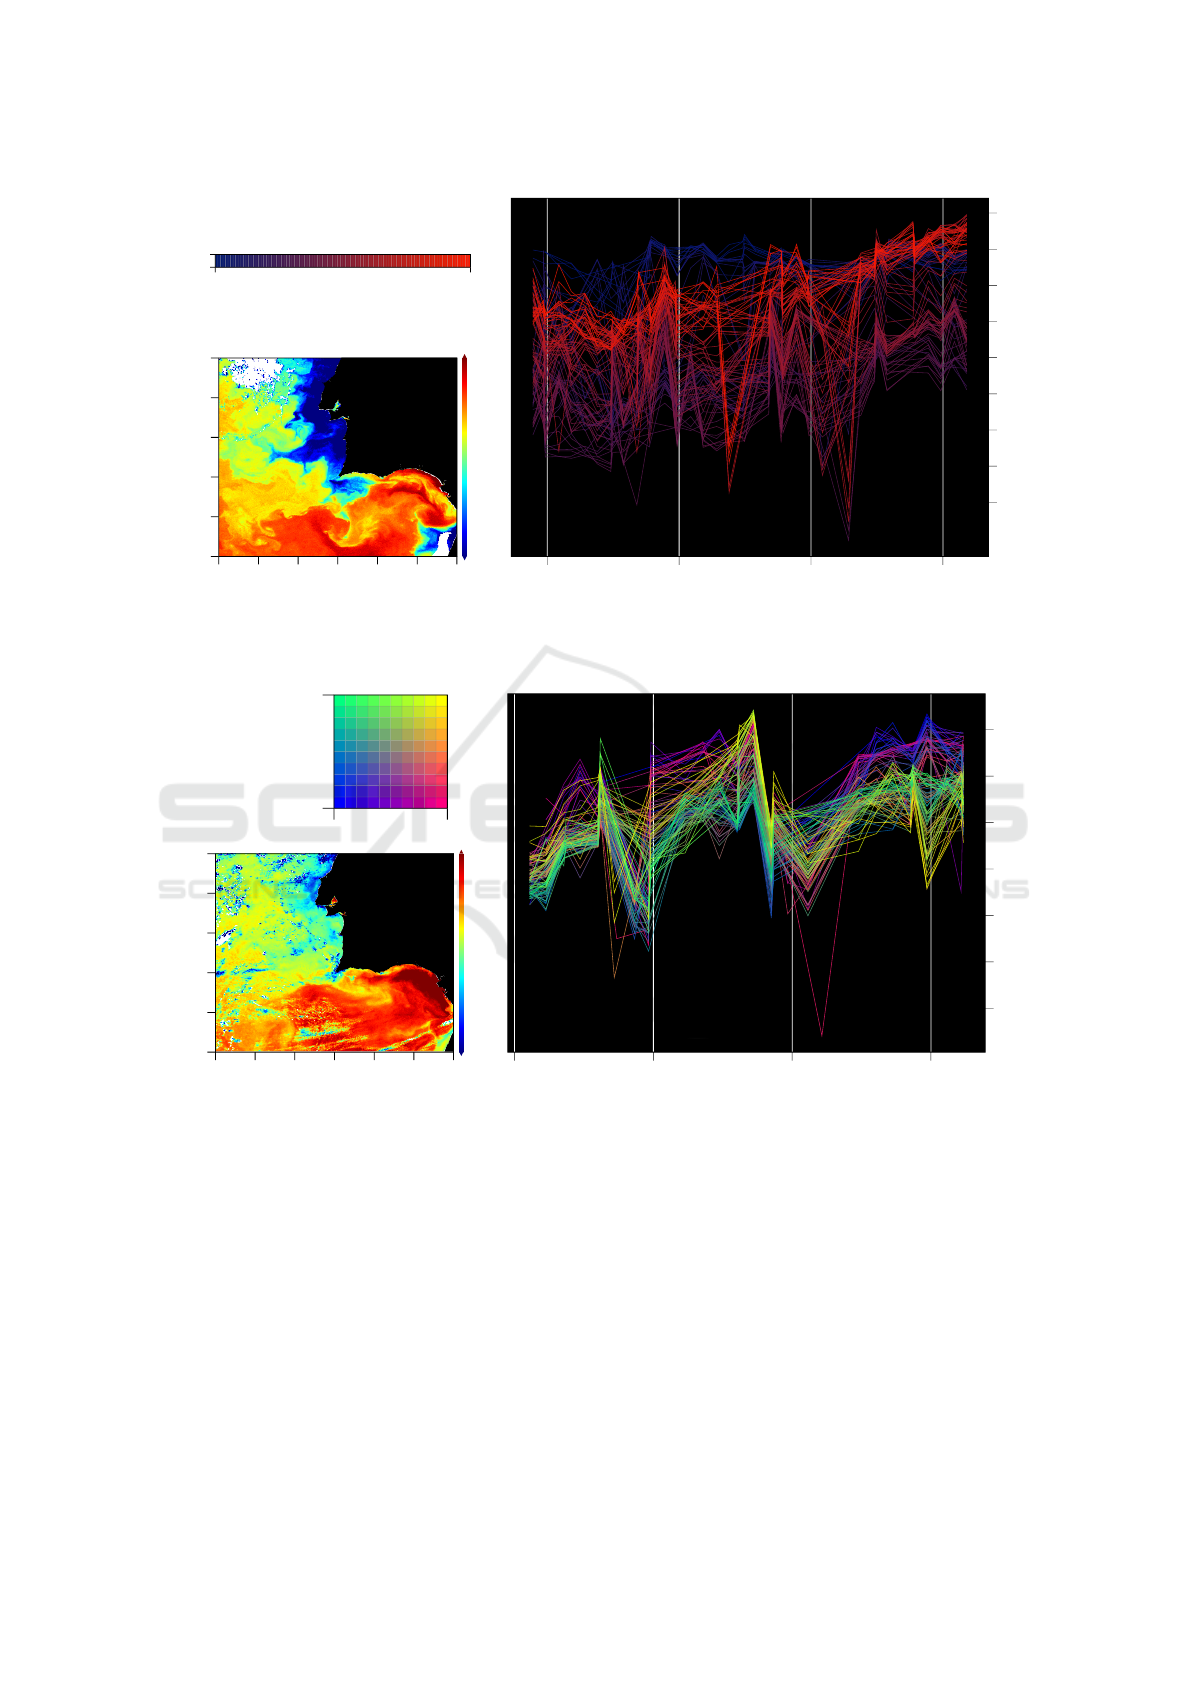
As a second example we show (Figure 4) a differ-
ent type of event, recognised by the experts as a warm
counter-current moving westward from the Gulf of
Cadiz. For this case study, considering the type of
event, we have selected a narrower shaped rectangle
that allows classifying the trend along the coast. In
this case the spaghetti plot clearly outlines a dynamic
pattern of the easternmost area (red plots) which in-
creases its temperature starting colder than the west-
ernmost (blue plots) but raising up and overcoming it
(i.e. much higher positive gradient of the easternmost
area, with a close-to-zero gradient of the westernmost
one).
Finally, as a third example (Figure 5) we see a sit-
uation where no specific event has been detected in
Mesoscale Patterns Identification through SST Image Processing
169
36.90
◦
N
36.93
◦
N
10.0
◦
W 7.0
◦
W
35.0
◦
N
36.0
◦
N
37.0
◦
N
38.0
◦
N
39.0
◦
N
40.0
◦
N
12.0
◦
W
11.0
◦
W
10.0
◦
W
9.0
◦
W
8.0
◦
W
7.0
◦
W
6.0
◦
W
17
◦
C
18
◦
C
19
◦
C
20
◦
C
21
◦
C
22
◦
C
23
◦
C
20-Sep
25-Sep
30-Sep
05-Oct
14
15
16
17
18
19
20
21
22
Temperature (
◦
C)
Figure 4: Event of 5 October 2017. Top left: reference map for the plot; bottom left: SST map at the date of the event; right:
generated spaghetti plot.
36.5
◦
N
37.0
◦
N
9.5
◦
W 9.0
◦
W
35.0
◦
N
36.0
◦
N
37.0
◦
N
38.0
◦
N
39.0
◦
N
40.0
◦
N
12.0
◦
W
11.0
◦
W
10.0
◦
W
9.0
◦
W
8.0
◦
W
7.0
◦
W
6.0
◦
W
17
◦
C
18
◦
C
19
◦
C
20
◦
C
21
◦
C
22
◦
C
23
◦
C
16-Jun
20-Jun
24-Jun
28-Jun
16
17
18
19
20
21
22
Temperature (
◦
C)
Figure 5: No event in late June 2017. Top left: reference map for the plot; bottom left: SST map at the date of the event; right:
generated spaghetti plot.
that period, and this can be associated with the rela-
tive spaghetti plot, where large decays or increases in
temperature cannot be identified (i.e. the gradients of
the plots are not giving a clear indication of specific
different trends among the regions, also considering
existing outliers).
As it can be seen from this preliminary results dif-
ferent patterns can be identified for several events. In
more detail “flat” patterns of temperatures can be seen
for the situations where no particular event happens,
where distinct decays/increases of temperature while
moving from specific regions to others can be identi-
fied in the charts related to specific events.
4 CONCLUSIONS
The preliminary results of this ongoing study are
promising and show possible patterns of differenti-
ation among different mesoscale events occurring in
the analyzed area. Experts initially supported the pri-
mary analysis, identifying possible events occurring
ROBOVIS 2021 - 2nd International Conference on Robotics, Computer Vision and Intelligent Systems
170

at specific dates within the data set range we used.
Following this, we applied our method to different
time intervals before the events specified to under-
stand whether a specific dynamic pattern could be as-
sociated with them. Moreover, we also performed the
same analysis on periods where no events were iden-
tified to analyze a different specific pattern relevant to
a “no-event” period.
Future work will be centred on the extension of
this preliminary results on pattern identification to
more distinct and expanded events, with the goal to
define a more complete collection of patterns.
Another focus will be to tackle the implementa-
tion of higher-level stages, i.e. those concerning to
the classification task. In particular, the feature ex-
traction stage will be refined by selecting the features
typologies returning the best possible discriminating
power. Also, different classifiers will be devised to
identify the most suitable ones for the purpose of this
analysis. These latter activities are the foundation for
the next step of automatic classification of massive
datasets without the need for expert feedback.
The test and validation of the proposed algorithm
is carried out and will continue as part of the activities
of the EU H2020 project NAUTILOS (Pieri, 2020;
Pieri et al., 2021).
ACKNOWLEDGEMENTS
This paper is part of a project that has received fund-
ing from the European Union’s Horizon 2020 re-
search and innovation programme under grant agree-
ment No. 101000825 (Nautilos, 2021).
REFERENCES
´
Alvarez-Salgado, X. A., Figueiras, F. G., P
´
erez, F. F.,
Groom, S., Nogueira, E., Borges, A. V., Chou, L.,
Castro, C. G., Moncoiff
´
e, G., R
´
ıos, A. F., Miller, A.
E. J., Frankignoulle, M., Savidge, G., and Wollast, R.
(2003). The Portugal coastal counter current off NW
Spain: new insights on its biogeochemical variability.
Progress in Oceanography, 56(2):281–321.
Chavez, F. P. and Messi
´
e, M. (2009). A comparison of
Eastern Boundary Upwelling Ecosystems. Progress in
Oceanography, 83(1):80–96. Eastern Boundary Up-
welling Ecosystems: Integrative and Comparative Ap-
proaches.
FAO (2018). The State of World Fisheries and Aquaculture
2018. Meeting Sustainable Development Goals.
Hansen, J., Ruedy, R., Sato, M., and Lo, K. (2010). Global
surface temperature change. Reviews of Geophysics,
48(4).
IPCC (2019). Summary for Policymakers. In P
¨
ortner, H.-
O., Roberts, D. C., Masson-Delmotte, V., Zhai, P.,
Tignor, M., Poloczanska, E., Mintenbeck, K., Alegr
´
ıa,
A., Nicolai, M., Okem, A., Petzold, J., Rama, B., and
Weyer, N. M., editors, IPCC Special Report on the
Ocean and Cryosphere in a Changing Climate. In
press.
Lamont, T., Garc
´
ıa-Reyes, M., Bograd, S. J., van der Lin-
gen, C. D., and Sydeman, W. J. (2018). Upwelling
indices for comparative ecosystem studies: Variabil-
ity in the Benguela Upwelling System. Journal of
Marine Systems, 188:3–16. Benguela: Opportunity,
Challenge and Change.
Levin, L. A. and Le Bris, N. (2015). The deep ocean under
climate change. Science, 350(6262):766–768.
Lopes, J. F., Ferreira, J. A., Cardoso, A. C., and Rocha,
A. C. (2014). Variability of temperature and chloro-
phyll of the Iberian Peninsula near costal ecosystem
during an upwelling event for the present climate and
a future climate scenario. Journal of Marine Systems,
129:271–288.
Messi
´
e, M., Ledesma, J., Kolber, D. D., Michisaki, R. P.,
Foley, D. G., and Chavez, F. P. (2009). Potential
new production estimates in four eastern boundary
upwelling ecosystems. Progress in Oceanography,
83(1):151–158. Eastern Boundary Upwelling Ecosys-
tems: Integrative and Comparative Approaches.
Nautilos (accessed July 23, 2021). NAUTILOS Project
Website. https://www.nautilos-h2020.eu/.
Peliz,
´
A., Dubert, J., Santos, A. M. P., Oliveira, P. B., and
Le Cann, B. (2005). Winter upper ocean circulation in
the Western Iberian Basin—Fronts, Eddies and Pole-
ward Flows: an overview. Deep Sea Research Part I:
Oceanographic Research Papers, 52(4):621–646.
Pieri, G. (2020). A New Approach to Underwater Tech-
nologies for Innovative, Low-cost Ocean Observation:
NAUTILOS. ERCIM News, 2020(123).
Pieri, G., Ntoumas, M., Martinelli, M., Chatzinikolaou,
E., Martins, F., Novellino, A., Dimitrova, N., Keller,
K., King, A., Smerdon, A., Mazza, M., Malard
´
e,
D., Cocco, M., Torres, A., Triantafyllou, G., S
´
a, S.,
Jo
˜
ao Bebianno, M., Sparnocchia, S., Kristiansen, T.,
and Lusher, A. (2021). New technology improves
our understanding of changes in the marine environ-
ment. In 9th EuroGOOS International Conference.
EuroGOOS.
Ramajo, L., Valladares, M., Astudillo, O., Fern
´
andez, C.,
Rodr
´
ıguez-Navarro, A. B., Watt-Ar
´
evalo, P., N
´
u
˜
nez,
M., Grenier, C., Rom
´
an, R., Aguayo, P., Lardies,
M. A., Broitman, B. R., Tapia, P., and Tapia, C.
(2020). Upwelling intensity modulates the fitness and
physiological performance of coastal species: Impli-
cations for the aquaculture of the scallop Argopecten
purpuratus in the Humboldt Current System. Science
of The Total Environment, 745:140949.
Relvas, P. and Barton, E. D. (2005). A separated jet and
coastal counterflow during upwelling relaxation off
Cape S
˜
ao Vicente (Iberian Peninsula). Continental
Shelf Research, 25(1):29–49.
Relvas, P., Barton, E. D., Dubert, J., Oliveira, P. B.,
Peliz,
´
A., da Silva, J. C. B., and Santos, A. M. P.
Mesoscale Patterns Identification through SST Image Processing
171

(2007). Physical oceanography of the western Iberia
ecosystem: Latest views and challenges. Progress in
Oceanography, 74(2-3):149–173.
Sydeman, W. J., Garc
´
ıa-Reyes, M., Schoeman, D. S.,
Rykaczewski, R. R., Thompson, S. A., Black, B. A.,
and Bograd, S. J. (2014). Climate change and wind
intensification in coastal upwelling ecosystems. Sci-
ence, 345(6192):77–80.
Varela, R., Lima, F. P., Seabra, R., Meneghesso, C., and
G
´
omez-Gesteira, M. (2018). Coastal warming and
wind-driven upwelling: A global analysis. Science of
The Total Environment, 639:1501–1511.
Varela, R.,
´
Alvarez, I., Santos, F., DeCastro, M., and
G
´
omez-Gesteira, M. (2015). Has upwelling strength-
ened along worldwide coasts over 1982-2010? Scien-
tific Reports, 5(1):10016.
ROBOVIS 2021 - 2nd International Conference on Robotics, Computer Vision and Intelligent Systems
172
