
A Framework for Staging Personal Health Trains
in the Cloud
∗
Virginia Graciano Martinez
1 a
, Lu
´
ıs Ferreira Pires
1 b
, Luiz Olavo Bonino da Silva Santos
1,2 c
,
Jo
˜
ao Luiz Rebelo Moreira
1 d
and Renata Guizzardi-Silva Souza
1 e
1
University of Twente, Enschede, The Netherlands
2
Leiden University Medical Center, Leiden, The Netherlands
Keywords:
Personal Health Train, Cloud, Staging Station, Data Station, Privacy Preservation.
Abstract:
Data analysis can be quite valuable for the progress of science in general, but more specifically in the health-
care domain, in which it can generate medical advances and improve healthcare services. The Personal Health
Train (PHT) is an approach based on distributed learning that allows analytics to be brought to the (personal
health) data rather than the other way around, allowing data privacy and control to be preserved, and ethi-
cal and legal concerns to be observed. Since computational resources are necessary whenever processing is
expected to be done, a sandboxed environment should be available within the healthcare organization. This
environment should allow the received algorithms to be executed without interfering with the organization’s
regular processing. However, the IT infrastructure of a healthcare organization may not be powerful enough to
perform a requested analysis task. This paper reports on our efforts to extend the PHT approach to allow data
to be processed in the cloud, augmenting the processing power of the IT infrastructure of healthcare organiza-
tions. Our solution not only fulfills the functional requirements of the PHT approach, but it also complies with
privacy regulations, particularly the General Data Protection Rules (GDPR). The paper describes the design
and implementation of our solution, also demonstrating its suitability with a simple and yet representative case
study.
1 INTRODUCTION
In the last decades, people and organizations world-
wide generated vast amounts of structured and un-
structured data (Yang et al., 2017). These data can
be quite valuable for the progress of science in gen-
eral, but more specifically in the healthcare domain,
in which these data can generate medical advances
and improve healthcare services, by offering disease
surveillance, clinical decision support and population
health management, to mention just a few benefits
(Kumar and Singh, 2019).
Traditional data analysis requires data to be copied
and moved to a central location, but this approach is
a
https://orcid.org/0000-0003-3321-1296
b
https://orcid.org/0000-0001-7432-7653
c
https://orcid.org/0000-0002-1164-1351
d
https://orcid.org/0000-0002-4547-7000
e
https://orcid.org/0000-0002-2697-9849
∗
We thank the National Council of Science and Technol-
ogy of Mexico (CONACyT) for the scholarship to support
this scientific research project.
not always suitable anymore. From a technical per-
spective, it is unlikely that a single organization or
individual can afford to collect all the data needed for
analysis and to maintain the necessary infrastructure.
Furthermore, all these potentially massive amounts of
data would have to be moved to a central location in
order to be processed. From a social perspective, eth-
ical and legal restrictions to the sharing of privacy-
sensitive data have been imposed by regulations such
as the EU General Data Protection Rules (GDPR),
which protect the access of personal data and have an
impact on the way data can be stored and processed
(Choudhury et al., 2020). Therefore, to comply with
these regulations and harness the massive amount of
data available nowadays, a distributed data analysis
approach is necessary.
Distributed learning allows distributed data to be
analyzed at different data source locations (Rieke
et al., 2020). Data source organizations are in con-
trol of the entire analysis execution and can return
only the results, without having to give away the
original data, so that sensitive data privacy is guar-
Graciano Martinez, V., Ferreira Pires, L., Santos, L., Moreira, J. and Souza, R.
A Framework for Staging Personal Health Trains in the Cloud.
DOI: 10.5220/0010712800003058
In Proceedings of the 17th International Conference on Web Information Systems and Technologies (WEBIST 2021), pages 133-144
ISBN: 978-989-758-536-4; ISSN: 2184-3252
Copyright
c
2021 by SCITEPRESS – Science and Technology Publications, Lda. All rights reserved
133

anteed (Beyan et al., 2020). In healthcare, the Per-
sonal Health Train (PHT) is an approach based on
distributed learning that allows analytics to be brought
to the (personal health) data rather than the other way
around. This approach allows analysis to be per-
formed on scattered data, including sensitive data,
without the data leaving their organizational bound-
aries, so that data privacy and control can be pre-
served, and ethical and legal concerns are observed
(Beyan et al., 2020). The PHT gives data owners the
authority to decide which data they want to share and
to monitor their usage. Regarding privacy and secu-
rity, its main benefit is that data processing happens
within the data owner’s administrative realm, while
analysts should be able to get valuable information
from different sources without directly accessing the
data (Karim et al., 2018). Therefore, the PHT enables
algorithms to visit the data at their original location,
where they are executed to process the available data.
Since computational resources are necessary
whenever processing is expected to be done, an iso-
lated and controlled environment should be available
within the healthcare organization, which should al-
low the received algorithms to be executed without
interfering with the organization’s regular processing.
However, the IT infrastructure of a healthcare organi-
zation may not be powerful enough to perform a re-
quested analysis task, so that opportunities to reuse
valuable data may be missed. In this case, a mecha-
nism should be devised to allow more powerful pro-
cessing environments to be dynamically staged for
executing the algorithms, for example in the cloud,
while keeping the data under control of the data own-
ers and sensitive data protected.
This paper reports on our efforts to extend the
PHT approach to allow data to be processed in the
cloud, augmenting the processing power of the IT
infrastructure of healthcare organizations. Our solu-
tion not only fulfills the functional requirements of the
PHT approach, but it also complies with privacy reg-
ulations, particularly the GDPR. The paper describes
the design and implementation of our solution, and
demonstrates its suitability with a simple yet repre-
sentative case study.
This paper is further structured as follows: Sec-
tion 2 introduces the PHT approach, Section 3 de-
scribes the architecture of our extension to the PHT
approach, Section 4 discusses the implementation of
the main components of our solution, Section 5 eval-
uates our solution with a case study and Section 6
presents our main conclusions and recommendations
for future work.
2 PERSONAL HEALTH TRAIN
The Personal Health Train initiative started in 2016,
when the Dutch Techcenter for Life Sciences, in col-
laboration with a number of Dutch research institu-
tions produced an animation video
1
depicting the idea
of an infrastructure addressing technological and legal
issues to support distributed reuse of sensitive data. In
this infrastructure, algorithms primarily move to the
data instead of the other way around.
The PHT approach applies the metaphor of a Train
system with the following main concepts:
Data Station. Software product that provides access
to data. It makes data sets available by provid-
ing interaction mechanisms and metadata to de-
scribe a number of different aspects about these
data sets. The Data Station requires computa-
tional capacity to execute analytic tasks.
Train. Component that accesses the data at the Data
Stations. These components carry the algorithms
and/or data queries from the data consumer to the
Data Station.
Train Handler. Software product that is responsible
for searching for data in a Station Directory and
dispatching Trains to the discovered Stations.
Station Directory. Metadata registry for all Stations
in the system, including the metadata of all data
sets accessible through each Data Station. It al-
lows users to discover data and the Data Station
that holds these data.
The PHT approach rapidly gained international
attention with a growing number of individuals, re-
search and commercial groups and institutions work-
ing towards the realization of the vision described in
the seminal video (Choudhury et al., 2020; Karim
et al., 2018).
The PHT approach encourages the reuse of data
by having Trains entering the Data Stations to access
the necessary data and completing their task, without
giving direct data access to end-users. Because in the
PHT data analysis is performed at the data source, ap-
propriate definitions are necessary to determine where
to find the data, how to access the data, how to inter-
pret the data, and how to reuse the data. Hence, the
PHT infrastructure relies on the FAIR (Findable, Ac-
cessible, Interoperable, Reusable) principles (Wilkin-
son et al., 2016), which should apply to both the Train
and Data Station, focusing on the reusability of dis-
tributed data with distributed analytics.
The personal health data stored in healthcare or-
ganizations can be explored for both clinical and re-
search purposes. PHT enables data providers and data
1
https://vimeo.com/143245835
WEBIST 2021 - 17th International Conference on Web Information Systems and Technologies
134

users to match FAIR data to FAIR analytics (Deist
et al., 2020) so that they can make informed de-
cisions about their participation in specific applica-
tions. FAIR principles also become relevant for an-
alytic tasks, so that interoperability and accessibility
can be provided by applying FAIR principles to the
analytic tasks and the system components that per-
form these tasks. The PHT allows analytic tasks to
be discovered, exchanged and executed with minimal
human intervention.
In accordance with the architectural designs pre-
sented in (Choudhury et al., 2020) and (Karim et al.,
2018), Fig. 1 shows the entities involved in the PHT
workflow
2
. The architecture identifies four main roles
(with their responsibilities) to be played by stakehold-
ers, which are represented as blue boxes in Figure 1:
Curator. Stakeholder who has authority over the
data. This role can be played by the data owner
or by any other actor who controls the data.
Station Owner. Stakeholder responsible for the op-
erations of a Data Station. This role can be played,
e.g., by a healthcare organization such as a hospi-
tal.
Train Owner. Stakeholder responsible for its Trains
and for representing the data consumer. This role
can be played, e.g., by a scientific organization.
A given Train accesses data in a Data Station on
behalf of the Train Owner.
Dispatcher. Stakeholder responsible for dispatching
Trains on behalf of their Train Owners to the ap-
propriate Data Stations. The Dispatcher interacts
with the Station Directory to discover which Sta-
tions provide access to the required data, plans the
Train run and dispatches the Trains to the target
Stations.
The Train acts on behalf of its Train Owner, and
accesses and processes data in Data Stations. A Train
is dispatched to a Station by its Dispatcher using the
related Train Handler. There can be different types of
Trains depending on the interaction mechanism they
use, such as message exchange, container execution,
script execution, Application Programming Interface
(API) calls and data queries. Figure 2 depicts the
Train classification and the types of trains identified
so far. It also shows that a Train is composed of two
main elements, namely the Train Metadata and the
Train Payload.
The Train Metadata is applicable to any type of
Train, and contains information that describes the
2
The architecture models in this paper are represented
using the ArchiMate Enterprise Architecture modeling lan-
guage.
Train. This metadata include properties such as the
Train Owner, the Train Dispatcher, the Train type
(message, API call, query or container), the required
input data, the expected output data and its purpose.
The Train Payload depends on the kind of Train,
as follows: Container Trains have the identifier of
the container image as their payload, API Trains use
API calls, Message and Script Trains contain a mes-
sage and a script as payload, respectively, and Query
Trains have a query as payload.
3 EXTENDED PHT
ARCHITECTURE
This section describes the architectural design of our
solution to extend the PHT Data Station to stage a
Train in the cloud in case the Data Station lacks the
necessary resources to run this Train. In this case,
we say that the Data Station is staged in the cloud
by a Staging Data Station, which is the system we
developed.
3.1 Initial Assumptions
The first steps to develop a Staging Data Station have
been to define the privacy requirements and to identify
architectural elements for our system.
3.1.1 Privacy Requirements
Sharing privacy-sensitive data outside the organiza-
tional boundaries is a critical issue in health appli-
cations. Hence, data sharing regulation compliance
has been considered as part of the non-functional re-
quirements of our system. GDPR has been identi-
fied as the main regulation for our system (Voigt and
Von dem Bussche, 2017). In GDPR, data controller
and data processor have been defined as two essen-
tial roles for personal data processing accountabil-
ity, in that both roles are responsible for implement-
ing appropriate security measures and demonstrating
that processing operations comply with the regula-
tion’s principles. Considering the PHT architecture,
we assigned the data controller role to the Data Sta-
tion Owner, since this stakeholder is responsible for
the Data Station and its data. Unlike the data con-
troller, a data processor role may not be assigned to
an actor yet until a decision is made on where the pro-
cessing should be done. In case the Data Station lacks
the resources necessary to run a Train, a Staging Data
Station is required and the cloud provider plays the
data processor role. By defining clear roles we can
build a compliant architecture and look for the most
A Framework for Staging Personal Health Trains in the Cloud
135
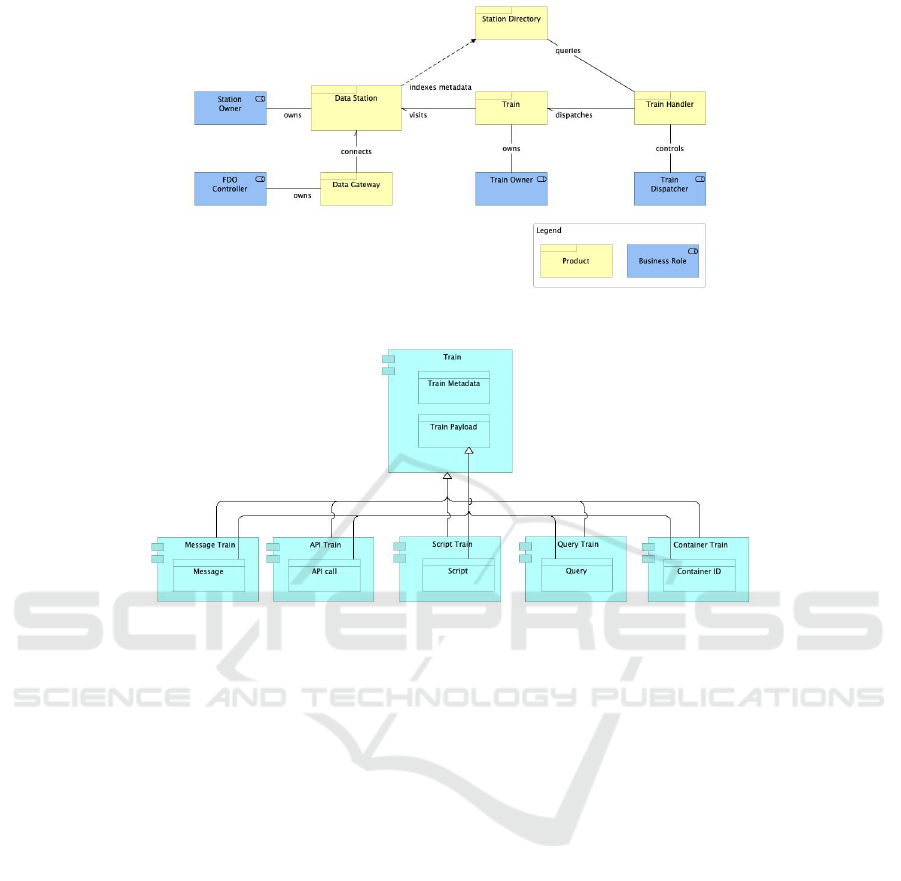
Figure 1: High-level PHT architecture.
Figure 2: Train architecture.
suitable cloud provider. GDRP articles 3, 5, 25 and
32 have been identified as the most crucial in our case
(Voigt and Von dem Bussche, 2017), thus becoming
non-functional requirements for when the data pro-
cessor role is assigned to a cloud provider.
3.1.2 Architectural Elements
Cloud and automation tools allow the dynamic de-
ployment of infrastructures, facilitating the develop-
ment of an architecture that complies with and ex-
tends the PHT approach (Morris, 2016). For this
reason, we leveraged the cloud and Infrastructure as
Code (IaC) technologies to design and deploy the
Staging Data Station. An essential aspect of the
Staging Data Station deployment is the automation
of data processing. Our solution aims at providing
autonomous data processing, so that instead of hav-
ing human operators mediating between the workflow
steps, these steps can be performed automatically. We
identified four architectural elements that we found
indispensable to design and deploy a Staging Data
Station:
Dynamic Platform. Main building block of the In-
frastructure, responsible for setting up the infras-
tructure resources of the Staging system. The dy-
namic platform should be compatible with an IaC
provisioning tool to achieve dynamic deployment
and system management. The dynamic platform
can be a cloud platform or a software tool that can
provide computing and storage resources (Morris,
2016).
Provisioning Tool. IaC tool that allows the user to
describe the desired infrastructure resources. The
provisioning tool has to support the selected dy-
namic platform (Morris, 2016).
APIs. REST APIs that allow Trains and tools to com-
municate and exchange information with the un-
derlying infrastructure resources (Jin et al., 2018).
Event-driven Services. Services that allow infras-
tructure components to communicate by exchang-
ing event notifications. An event is any occur-
rence of interest, such as a state change in some
resource. The affected component issues a no-
tification that describes the observed event, and
a target resource triggers an action based on this
notification. Event-based services can work with
resources inside or outside the dynamic platform,
facilitating the separation between communica-
tion and computation (Christudas, 2019).
WEBIST 2021 - 17th International Conference on Web Information Systems and Technologies
136

3.2 Architectural Design
Depending on the computing resources available at
the main Data Station and the Train requirements, the
Data Station platform would run the Train locally or
use a Staging Data Station in the cloud. Each of the
main components of our architecture are discussed in
the sequel.
3.2.1 Data Station
The infrastructure required to run a Train can be ei-
ther internal or external to the Data Station. When
necessary, the Data Station can use a temporary setup
in a cloud environment that a Train can use to pro-
cess data, which is the Staging Data Station. Conse-
quently, this enables scalability and flexibility, using
local resources and extending the infrastructure re-
sources with the Staging Data Station when required.
Figure 3 depicts the proposed Data Station architec-
ture.
The Data Interaction component provides func-
tionality that allows external clients to access the data
available at the Data Station. The Data Interaction
Component also performs validation on the incoming
Trains, via the Train Validation function, to assess that
they behave according to the Station’s requirements
and the Train description defined in the Train’s meta-
data. Whenever the data required by a Train have ac-
cess restriction, the Data Interaction Component also
enforces the required access control. The Data Sta-
tion Metadata Component provides access to the Data
Station’s metadata and metadata of all data sets made
available through this Station. External applications
willing to retrieve metadata from the Data Station in-
voke these metadata Services to accomplish the task.
Figure 4 depicts the proposed communication sys-
tem between the Data Station, Train, and the Stag-
ing Data Station. In the Describe API call, the Data
Station queries the metadata of the arriving Train. A
Train Description with the computing requirements
is returned from the Train to the Data Station as a re-
sponse. If the Data Station does not have the required
resources, it performs the Query call to get the data
needed for the analysis. The resulting query returns a
query response, which declares that the required data
are ready for being processed. The Data Station then
enters the Stage phase through an API call, deploying
the Staging Data Station in the cloud. The Staging
Data Station runs the Train and the Train execution
result is stored in the cloud to be retrieved later. If
the Data Station has the resources to run the Train, it
performs a local execution.
Figure 3 shows that we added the Staging Data
Station to the architecture, which communicates with
the leading Data Station through an API, represented
by the Staging Interface. This interface defines the
Stage phase depicted in Figure 4. We assume that the
role responsible for this new component is the Station
Owner, as the staging process should be transparent
for the Train Owner. However, the use of an external
platform can incur an extra cost. For this reason, we
defined a Billing component, which can be used at the
Station Owner’s convenience.
3.2.2 Staging Data Station
This is an extension of the Data Station, and it behaves
like the original Data Station but with some additional
features. Figure 5 depicts the Staging Data Station
architecture, which is composed of the following ser-
vices:
Access Control: offers access control to the cloud
environment, but only to the Data Station Owner.
However, if needed, more users can be added
and get specific permissions and policies to exe-
cute particular tasks. Communication between the
components in the cloud is denied by default to
provide a proper secure environment. The Iden-
tity Management Service can later provide roles
to allow or deny access to the other resources de-
ployed and used by the Staging Data Station, such
as storage and computing instances.
Data Storage: It stores the input and output data.
The input data are selected at the healthcare Data
Station based on the Train needs and moved to
the Staging Data Station in the cloud. The output
data result from the Train execution given in the
Run Response, and they are sent to the Healthcare
Data Station as exported files.
Event-based Services: The Staging Platform pro-
vides Event-based services to automate the execu-
tion steps. For instance, when the data are entirely
moved to the cloud, the Staging Data Station no-
tifies the cloud computing instance in which the
Train can be executed. Further, the leading Data
Station may subscribe to be notified when the
Train execution finishes, to harvest the output files
promptly. Events and trigger actions are achieved
through the event handler and event dispatcher,
which respectively listens to the events issued by
infrastructure components to create rules and trig-
ger actions, and executes the actions provided by
the Event Handler.
Logging: logs the data access interactions, enabling
regulatory compliance and security, but also op-
erational tasks. It identifies which actions were
taken by whom, what resources were acted upon,
A Framework for Staging Personal Health Trains in the Cloud
137
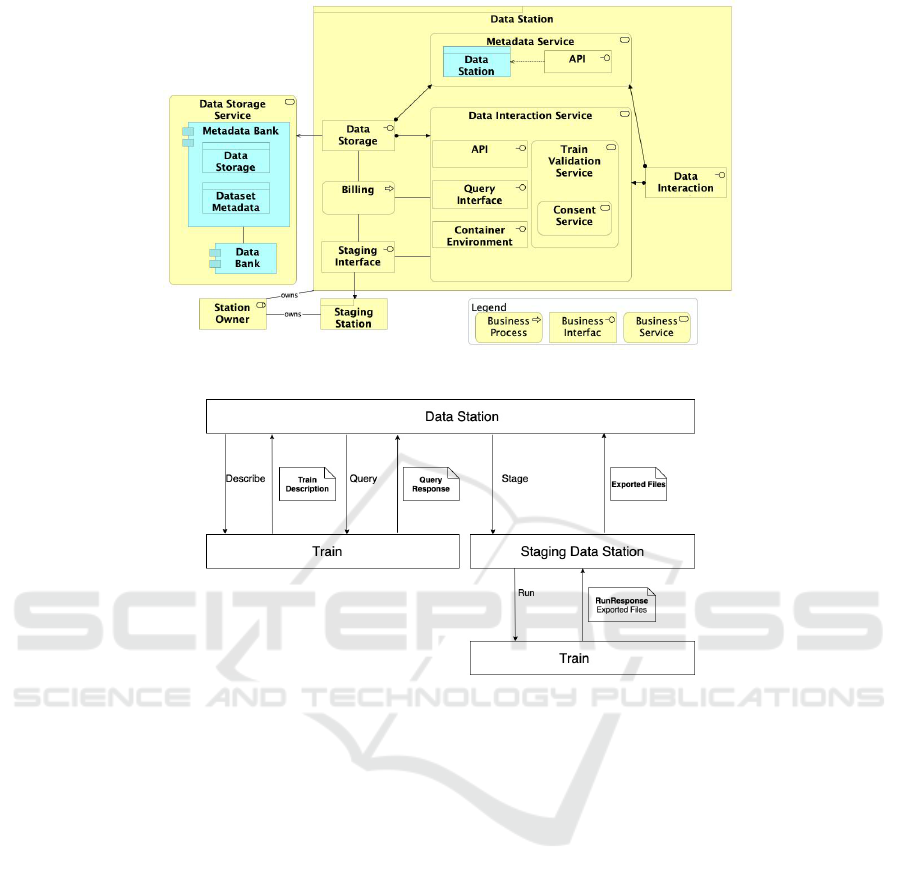
Figure 3: Data Station Architecture.
Figure 4: Proposed communication structure.
who accessed which data when the event oc-
curred, and other details to help analyze and re-
spond to an activity. This is a requirement for
GDPR compliance, but it is also used to com-
municate with the Event-based services to launch
tasks when an event occurs.
4 SOLUTION IMPLEMENTATION
In this section, we present our implementation of the
proposed Staging Data Station architecture that has
been developed to process a Container Train. We be-
gin by discussing the selection of tools, followed by
the implementation in the dynamic infrastructure plat-
form.
4.1 Technologies
For the dynamic platform we chose Amazon Web Ser-
vices (AWS), due to its GDPR compliance (Ama-
zon, 2020), free-tier resources for testing, plenty of
options for infrastructure resources (Mathew, 2021)
and its global infrastructure, with multiple locations
worldwide and especially in Europe. For the pro-
visioning tool we chose Terraform, since it is open
source, supports multiple dynamic platforms and has
declarative configuration. In addition, most alterna-
tives are vendor-specific solutions. The extensive in-
tegration and support offered by Terraform confirmed
our choice for AWS as dynamic platform.
Terraform is convenient because it allows many
infrastructure components to be implemented through
a piece of code, and they can be deployed at the
same time. Terraform provisions the resources of a
dynamic platform, and a Terraform provider is used
to interact with the APIs and expose the resources
from the corresponding dynamic platform. In our
implementation, the Amazon Web Services (AWS)
provider is used for provisioning all the required re-
sources. Besides, we choose the closest AWS region,
Frankfurt, to comply with GDPR. Terraform has been
installed in the machine that runs the Data Station.
The implementation comprises two parts: the
Data Station, which runs in a laptop, and the Stag-
ing Data Station, which runs in AWS. Since we used
WEBIST 2021 - 17th International Conference on Web Information Systems and Technologies
138
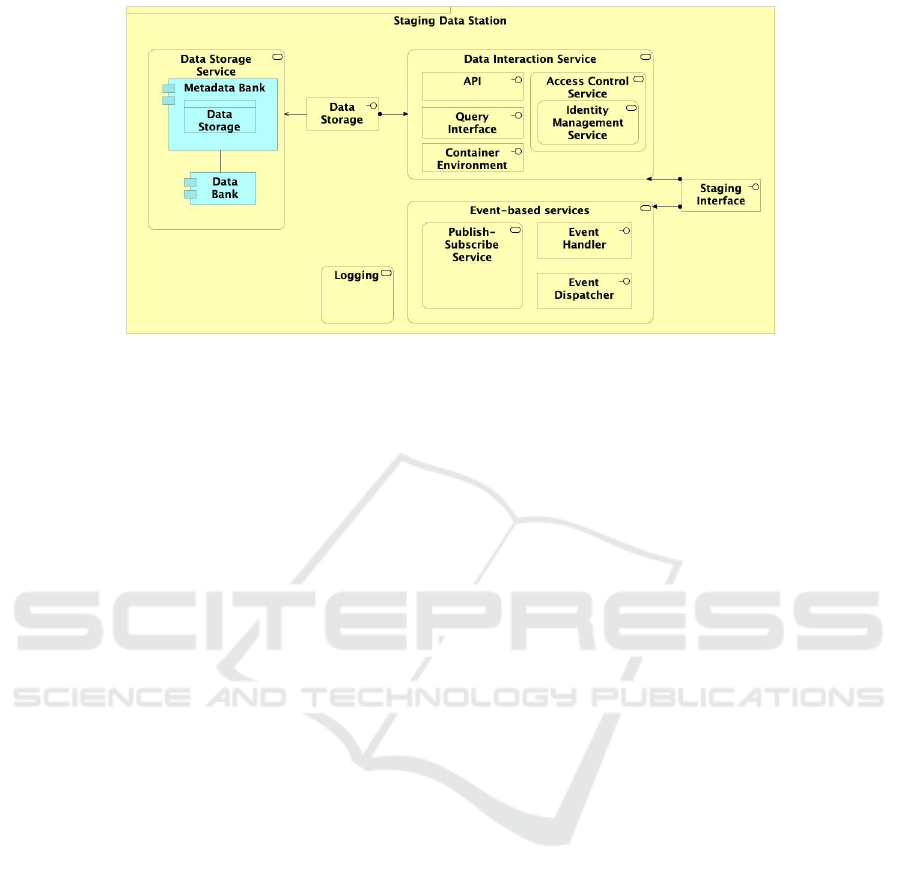
Figure 5: Staging Data Station Architecture.
a Container Train, once the Train is set up to run in a
Data Station, the Station takes the container identifier
from the Train’s payload and retrieves the container
image from its Train Registry. In our prototype, we
used the Amazon Elastic Container Registry (ECR)
service, which supports Docker images, as the Train
Registry. Figure 6 depicts the interaction diagram that
shows the interactions between our implementation
components to support the deployment and execution
of the Train.
We implemented the Data Station in our prototype
on a computer with 1.8GHz Dual-Core Intel Core i5
and 8GB memory. We implemented an API that plays
the Data Station role and interacts with the Staging
Data Station. In addition to Terraform, the technolo-
gies used in the implementation and installed in the
computer are Docker client, AWS SDK for Python,
NodeJS, and Express. The Data Station API is con-
figured in NodeJS and exposed to the Internet via the
localtunnel npm tool. Figure 7 depicts the high-level
Data Station workflow.
Our implementation supports the functionality
triggered after the decision that the Train cannot run at
the original Data Station because there are not enough
computing resources. In addition, it assumes that the
data necessary to run the Train were already queried
and stored in a specific path in the local Data Storage
in the Data Station.
4.2 Interactions
In Figure 6, the GET request corresponds to the
Stage API call in Figure 4, which launches the Stag-
ing Data Station as described in the Terraform defi-
nition files. This allows to provision the infrastruc-
ture components in the AWS cloud all at the same
time. During deployment, the Data Station subscribes
to receive a notification that indicates when the Train
execution is completed, in which case the data are
moved to the cloud storage. Once the required data
have been transferred to the Staging Data Station, the
event-based service immediately launches the com-
puting resources via a task that pulls the Train from
the Train Registry, deploys it in the Staging Data Sta-
tion and executes it. Once the Train execution is com-
pleted, the resulting data are copied to the output stor-
age. The event-based service then detects a change in
the computation state and announces it to the Publish-
Subscribe service. Finally, the Publish-Subscribe ser-
vice sends a notification message to the Data Station
via a POST request, which downloads the result files
from the Output storage.
4.3 AWS Services
Figure 8 illustrates the Staging Data Station imple-
mentation we deployed in the AWS cloud in accor-
dance with the interaction diagram of Fig. 6.
Table 1 shows the AWS services we used in our
implementation, as well as which PHT component
from Figure 5 each service implements.
4.3.1 Authentication
In order to create an environment, we first need an
Amazon Web Service Account and a special authenti-
cation method. We used Multi Factor Authentication
(MFA) to access the AWS console. We use an Admin
role that represents the healthcare organization, hav-
ing a name and two keys, namely, the public assess
key and the secret key. In this way, the desired con-
nection to the environment is done in an absolutely
reliable and secure way.
A Framework for Staging Personal Health Trains in the Cloud
139
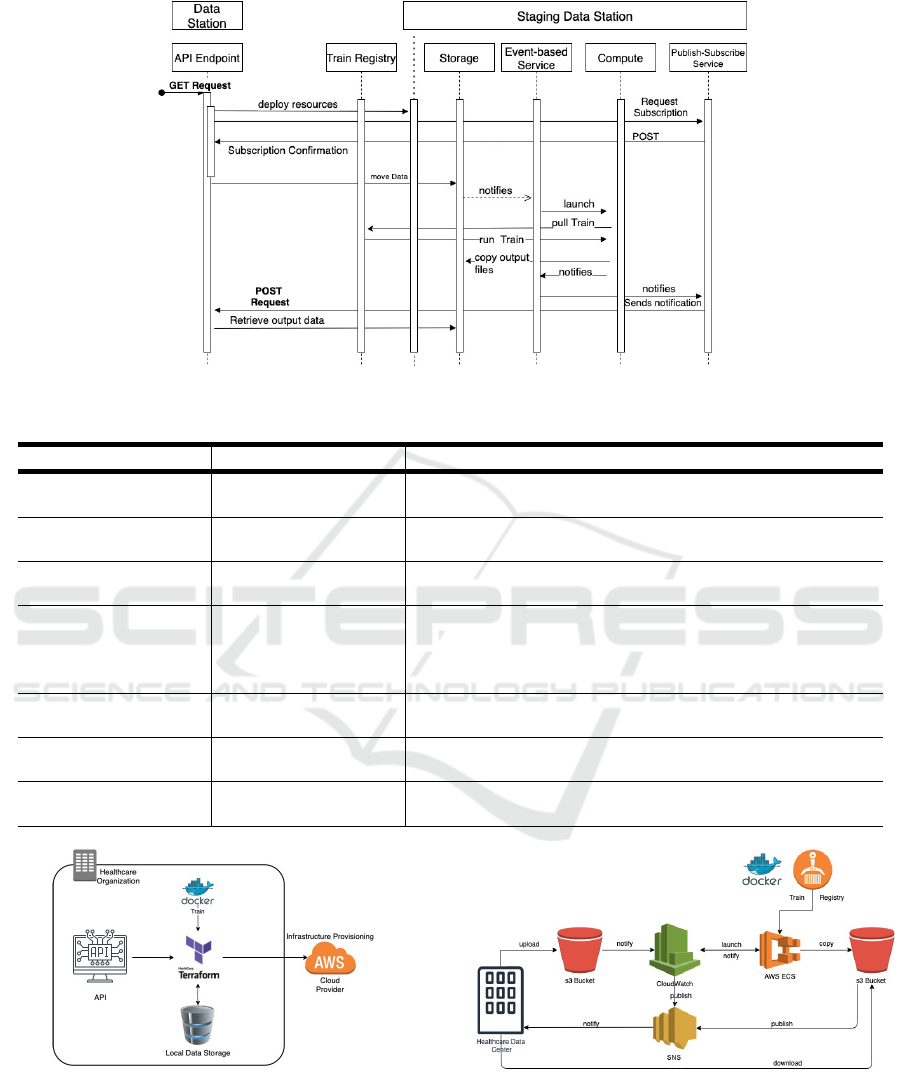
Figure 6: Interaction Diagram.
Table 1: PHT components and AWS services.
.
PHT Component Service Description
Data Storage Simple Storage Ser-
vice (S3)
Provides object storage through a web service interface.
Event Handler,
Event Dispatcher
CloudWatch Monitoring service that provides data and actionable in-
sights for AWS infrastructure resources.
Publish-Subscribe
Service
Simple Notification
Service (SNS)
Using SNS topics, publisher systems can fanout messages
to many subscriber systems, including HTTP endpoints.
Container Environ-
ment
Elastic Container
Service (ECS)
Fargate
Computation runtime environment based on serverless
technology that facilitates deployment, so that we do not
need to be concerned about how many resources assign in
advance.
Access Control Identity and Access
Management (IAM)
Manages access to AWS services and resources securely.
Networking Virtual Private
Cloud (VPC)
Creates a custom networking environment.
Train Registry Elastic Container
Registry (ECR)
Fully-managed Docker container registry.
Figure 7: Data Station Implementation.
4.3.2 Publish-subscribe Service
Amazon SNS sends an HTTP POST request when
it confirms a subscription, and it sends a notification
message or it confirms a request to unsubscribe. The
Figure 8: Implementation in AWS.
POST message contains SNS header values that al-
low us to identify the type of message and run specific
jobs in the Data Station API, as shown in Figure 6.
WEBIST 2021 - 17th International Conference on Web Information Systems and Technologies
140

Table 2: Buckets.
Bucket Use
Input stores the data from the healthcare or-
ganization needed by the Train.
Log stores event history log files of the
AWS account activity in the region, be-
sides helping the event-based service
launch other resources dynamically.
Output stores the results of the Train execu-
tion. The main Data Station retrieves
files from this Bucket at the end of the
Train execution.
4.3.3 Storage
The Data Storage component is implemented with
Amazon S3, so from now on it is referred to as the
bucket. We used three buckets by design, to store in-
put data, output data and log files, respectively. The
use of several buckets provides more granular security
and facilitates automation, triggering different actions
on each of them: the availability of input data triggers
the Train execution, while the availability of output
data triggers the download and faster data retrieval at
the end of the execution. Table 2 shows our Buckets
and their use.
The implementation supports client-side encryp-
tion and server-side encryption for protecting data
stored in the cloud and in transit against unauthen-
tic and unauthorized access, while ensuring that they
remain intact and available. Client-side encryption is
used to protect data in transit by encrypting data be-
fore sending it to AWS S3. HTTPS is used to guaran-
tee secure connections. If the healthcare organization
has a Virtual Private Network (VPN) infrastructure,
we recommend to establish a private connection to
the cloud. For the server-side encryption, a unique en-
cryption key is generated for each object, and data are
encrypted by using the 256-bits Advanced Encryption
Standard 256 (AES-256). After that, a securely stored
and regularly rotated master key encrypts the encryp-
tion key itself. Users can choose between mutually
exclusive possibilities to manage the encryption keys.
The input and output Buckets use unique Amazon S3-
Managed Keys (SSE-S3) with strong multifactor en-
cryption.
4.3.4 Data Transfer
Data transfer is also configured with the Terraform
files. We used the depends on meta-argument pro-
vided by Terraform to express dependencies between
components. In this case, the data are transferred once
the remaining resources are created in the cloud. As
a consequence, we can move data without concerns.
Furthermore, we verify the integrity of the uploaded
data with Message Digest (MD5) checksum in order
to detect file corruption.
4.3.5 Event-based Services
Usually, AWS Services generate notifications when
an event occurs, and these events are used to trigger
an action. However, these actions have to be stored
somewhere and rules and targets should be defined
based on them so we use Log Bucket to store all the
input bucket actions. We create a CloudTrail that
reports the activities of objects in the input bucket,
which are seen as events by the CloudWatch ser-
vice. After that, we configure an upload S3 event
rule in CloudWatch. Once a rule condition is ful-
filled, the CloudWatch target triggers an action. Ac-
cordingly, when data are completely uploaded to the
Input Bucket, our system launches a compute engine
for containers using ECS, and in this way the Train is
executed.
4.3.6 Computing
Computing resources created by Terraform are quite
critical. Amazon ECS makes it easy to launch con-
tainers and scale rapidly to meet changing demands,
but one of the challenges during execution is the pro-
vision and management of computing and memory re-
sources. There are several mechanisms to predict the
resources required and scale when appropriate. How-
ever, the Staging Data Station is a temporary deploy-
ment that has the main task of providing the appro-
priate computing resources for the Train. ECS Far-
gate is a serverless solution that allocates the required
amount of computing capabilities, avoiding the need
to choose instances in advance and scaling cluster ca-
pacity required by the application.
We use an entity called a task definition to describe
to ECS how to run the container. The ECS task def-
inition can be thought of as a prototype for running
an actual task, and allows for one or more contain-
ers to be specified. In our implementation, each Train
is mapped onto one task definition, which describes
that the Train should be pulled from the Train Reg-
istry when the CloudWatch rule matches the upload-
ing event. Unlike Virtual Machines in the cloud, ECS
Fargate is charged by vCPU and memory, and not by
the hour.
4.3.7 Security
Beyond authentication and encryption mechanisms,
an appropriate strategy for increasing security is to
A Framework for Staging Personal Health Trains in the Cloud
141

classify, split, and divide everything, by using roles,
permissions, regions, networks or firewalls. In a cloud
environment, we can implement security at differ-
ent levels. In our solution, we created a Virtual Pri-
vate Cloud to isolate our components from other cus-
tomers in AWS. However, the resources cannot inter-
act with each other if we do not configure a policy to
allow them to interact. Therefore, we provide security
via an Identity and Access Management service with
access control through user definitions, roles and per-
missions to users in each step of the workflow. For
instance, the ECS Cluster has read access to the S3
input bucket, but it does not have write permission as
it only requires to get data from it. In contrast, ECS
has write-access to the S3 output bucket.
The implementation uses a collection of network
access rules to limit traffic types that can interact with
a resource. This collection of rules is called a security
group, and each resource can have one or more as-
signed security groups. The rules in a security group
control the traffic allowed to an instance. If incoming
traffic does not match a rule from the group, access is
denied by default.
5 CASE STUDY
We evaluated the design proposed in this research
with a simple analysis of COVID-19 with information
stored in data sets of various sizes representing differ-
ent workloads. This allowed us to evaluate the system
behavior, mainly in terms of the consumed network
and computing resources. We used our implementa-
tion to build a Container Train with an algorithm to
process and analyze COVID-19 patients’ information.
We used data sets created in the literature (Walonoski
et al., 2020), where the authors generated synthetic
data using the open-source Synthea tool, resulting
in data sets containing synthetic Electronic Health
Records (EHR). The experiment aimed at calculating
all matching patients diagnosed with COVID-19 and
evaluate our system using 10K and 100K bundles. For
the patients diagnosed with COVID-19, we got sum-
mary statistics of patients who recovered and died and
the care plan of the people infected.
5.1 Evaluation Metrics
Performance is the most suitable quality attribute to
evaluate the architecture using dynamic analysis. We
used two sets of measurements for this quality at-
tribute, based on the ISO 25010 standard (ISO, 2011)
and the validation technique presented in (Erder and
Pureur, 2016):
Table 3: Average execution time.
10K 100K
Provision 3 min. 54 seg. 4 min. 14 seg.
Deprovision 17 seg. 20 seg.
Table 4: Average resource utilization.
Resource 10K 100K
Network 62 Mb 70 Mb
CPU 53.5% 85.6%
RAM 12% 16%
Time Behaviour is the degree to which the response
and processing time and throughput rates of a sys-
tem meet requirements when performing its func-
tions. For this we measured the execution times
from when the GET method is invoked until re-
sources are destroyed.
Resource Utilization is the degree to which the
amounts and types of resources used by a sys-
tem meet requirements when performing its func-
tions. For this we measured the CPU Average use
and RAM average use in the cloud. Moreover, we
measured network traffic in the Data Station dur-
ing the execution process.
5.2 Validation
We ran the execution of the system five times per bun-
dle. After these executions, we got an average calcu-
lation for the analysis of the system. This prevents
any data disturbance caused by isolated events from
having significant effects on the results. We used the
tool iftop on the computer that plays the Data Station
to collect network traffic information. Besides, we
harnessed the CloudWatch monitoring tool in AWS
to get the CPU and memory utilization.
Table 3 shows the execution time for the provision
and de-provisioning process for both bundles. The
provisioning process comprises the Terraform files
execution, data transfer, Train routing, Train process-
ing in the cloud, and downloading the results. The
de-provision process covers just the deletion of the
entire cloud resources created by Terraform. We can
observe that the difference between the two bundles’
execution time is around 15%. Table 4 shows that this
behavior can be justified by considering the average
resource utilization.
Table 4 shows the network traffic during the pro-
visioning process in the Data Station. The 100K bun-
dle consumes on average around 70 Mb while the
10K consumes around 62 Mb. The slight difference
in consumption is because in the 100K bundle case
WEBIST 2021 - 17th International Conference on Web Information Systems and Technologies
142
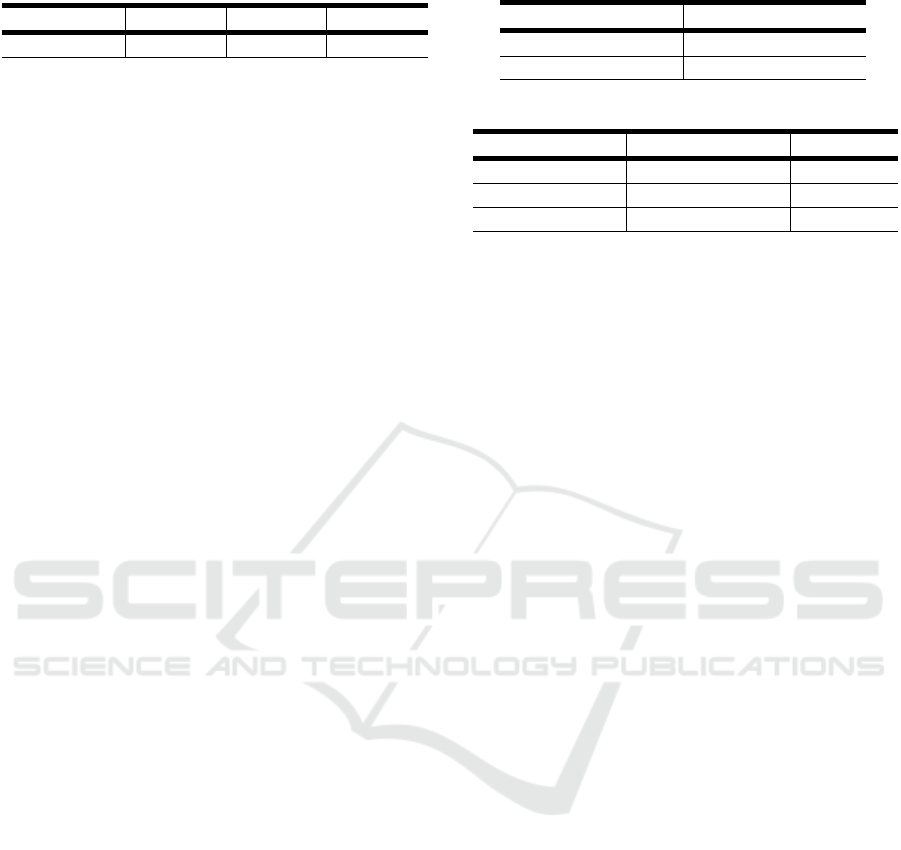
Table 5: Mortality rate.
COVID-19 Recovered Deceased Ventilated
(n=8820) 0.9606 0.0404 0.0325
the multi-upload option was used due to the bundle’s
size. Multi-upload divides the bundle into several
chunks consuming more networking resources but in
less time. Consequently, the transmission times were
different but not ten times bigger than the amount of
data, like it could be expected.
Table 4 also depicts the CPU and RAM aver-
age utilization, which are resources consumed in the
cloud. We can observe the CPU average utilization
for the 100K bundle was 85.6%, almost 30% more
than the 10K bundle. Consequently, the cloud pro-
cessing time was very similar among both bundles,
but the 100K bundle consumed more resources. In
general, the average memory utilization in both bun-
dles did not consume much memory, and both used
less than 20%. The two bundles’ overall execution
times were very similar despite the size difference be-
cause the system consumes more network and com-
puting resources when processing the biggest bundle.
We can conclude that the Data Station network
and cloud computing instance play a crucial role in
the performance of our system, more than the amount
of data. The scalability of the computing resources
is achieved in the cloud, however, the network con-
sumption depends on the network capabilities of each
healthcare organization. If we want to increase trans-
fer data speed, we can use multithreading techniques,
although in this case many more network resources
would be consumed.
Table 5 presents the results from the analysis of
the 10K data sets. With 8820 infections, 96% of the
people recovered, which is a high rate, demonstrating
that COVID-19 is highly contagious but not highly
fatal.
The care plan in this data set has two values,
namely ’home isolation’ and ’hospitalized’. Table 6
summarizes the statistics of patients who recovered at
home and hospitals. The hospitalization rate is con-
sidered high for the period these data were gathered.
However, still, the vast majority of people followed a
’home isolation’ care plan, i.e., they stayed and were
treated at home. Table 7 shows that the Intensive Care
Unit (ICU) Admission rate was high, and almost ev-
eryone at the ICU required ventilation. The death rate
for people in the ICU was high, and nearly all pa-
tients required ventilation. From these data, we can
conclude that patients admitted to the ICU and who
use ventilation have a high probability of dying.
These results demonstrate that our architecture
implementation can run a Train to perform data anal-
Table 6: Care plan.
Care Plan Rate
Home Isolation 0.7952
Hospitalised 0.2116
Table 7: ICU Admission Rate.
ICU Admission Ventilation
Ventilation Req. 0.7653 1.0
Recovered 0.3573 0.1637
Death 0.6453 0.8362
ysis in the cloud. Our deployment enables analysis
against privacy-sensitive data sources and successive
evaluation of that analysis in a secure enclave. We
could deploy the Staging Data Station, the Train ana-
lyzed the data and got a final file with the information
provided in Table 5, Table 6 and Table 7 directly in
the Data Station. This also demonstrates that the stan-
dardization of the data structures alongside a proper
architecture facilitates data analysis in any environ-
ment.
6 FINAL REMARKS
In this work, we presented a reference architecture of
a Staging Data Station in the cloud that supports Train
executions when a Data Station does not have enough
resources to perform computation on-premise. We
employed Infrastructure as Code, APIs, and event-
based systems to realize a dynamic deployment in
the cloud. We implemented the architecture pro-
posal using novel technologies and AWS. We eval-
uated the proposal with a dynamic analysis through
a case study, analyzing data sets of ten thousand pa-
tients and one hundred thousand patients.
The research showed that we could deploy a more
powerful computation environment when required us-
ing the cloud and automation tools, complying with
the PHT principles while providing a fitting and se-
cure site. Although our design requires moving
the data to the cloud, the data are still within the
data source realm and control, keeping their privacy.
Moreover, our proposal complies with the main reg-
ulation for processing personal data in the cloud to
keep the information as secure and private as possible,
assuming that the cloud environment does not misbe-
have nor has been hacked. The case study showed
that the instantiation and processing times of the Stag-
ing Data Station depend on the network in the Data
Station and the computing resources consumed in the
cloud. The simulation showed similar execution times
with different workloads sizes, but a significant dif-
A Framework for Staging Personal Health Trains in the Cloud
143

ference in the network and computing consumption,
which can cause a bottleneck in the Data Station net-
work. The case study worked adequately with a sim-
ple aggregation algorithm, so we believe that our sys-
tem can alleviate the IT infrastructure constraints that
the healthcare organizations can have to ensure the
PHT execution while respecting the principles of the
PHT approach.
Future research should be performed to test our
solution with other use cases, by including machine
learning algorithms in the Train or dependent transac-
tions, for instance, to experience idle moments wait-
ing for input data. Other Trains with different interac-
tion mechanisms such as APIs, queries, and messages
should be created and then tested with extensions of
our system. We also propose some future work to as-
sess the solution developed in this research, integrat-
ing the implementation to existing proof of concepts
developed by organizations in the PHT project. Some
of these implementations already have deployed a
vast majority of the PHT workflow and have elabo-
rated more robust case studies. It would beneficial to
combine these efforts and evaluate how our solution
behaves as well as other metrics like performance and
execution time from when the end-user dispatches the
Train until the results are made available.
REFERENCES
Amazon (2020). Navigating GDPR Compliance on
AWS. https://docs.aws.amazon.com/whitepapers/
latest/navigating-gdpr-compliance/welcome.html.
Accessed: 2021-09-09.
Beyan, O., Choudhury, A., van Soest, J., Kohlbacher, O.,
Zimmermann, L., Stenzhorn, H., Karim, M. R., Du-
montier, M., Decker, S., da Silva Santos, L. O. B.,
et al. (2020). Distributed analytics on sensitive medi-
cal data: The personal health train. Data Intelligence,
2(1-2):96–107.
Choudhury, A., van Soest, J., Nayak, S., and Dekker, A.
(2020). Personal health train on fhir: A privacy pre-
serving federated approach for analyzing fair data in
healthcare. In Bhattacharjee, A., Borgohain, S. K.,
Soni, B., Verma, G., and Gao, X.-Z., editors, Ma-
chine Learning, Image Processing, Network Security
and Data Sciences, pages 85–95, Singapore. Springer
Singapore.
Christudas, B. (2019). Practical Microservices Architec-
tural Patterns: Event-Based Java Microservices with
Spring Boot and Spring Cloud. Apress.
Deist, T. M., Dankers, F. J., Ojha, P., Marshall, M. S.,
Janssen, T., Faivre-Finn, C., Masciocchi, C., Valen-
tini, V., Wang, J., Chen, J., et al. (2020). Distributed
learning on 20 000+ lung cancer patients–the personal
health train. Radiotherapy and Oncology, 144:189–
200.
Erder, M. and Pureur, P. (2016). Chapter 3 - getting started
with continuous architecture: Requirements manage-
ment. In Erder, M. and Pureur, P., editors, Contin-
uous Architecture, pages 39–62. Morgan Kaufmann,
Boston.
ISO (2011). ISO/IEC 25010:2011, Systems and software
engineering — Systems and software Quality Require-
ments and Evaluation (SQuaRE) — System and soft-
ware quality models.
Jin, B., Sahni, S., and Shevat, A. (2018). Designing Web
APIs: Building APIs That Developers Love. O’Reilly
Media, Inc.
Karim, M., Nguyen, B.-P., Zimmermann, L., Kirsten, T.,
L
¨
obe, M., Meineke, F., Stenzhorn, H., Kohlbacher,
O., Decker, S., Beyan, O., et al. (2018). A dis-
tributed analytics platform to execute fhir-based phe-
notyping algorithms. In Proceedings of the 11th Inter-
national Conference Semantic Web Applications and
Tools for Life Sciences (SWAT4HCLS 2018). http:
//ceur-ws.org/Vol-2275/.
Kumar, S. and Singh, M. (2019). Big data analytics for
healthcare industry: impact, applications, and tools.
Big Data Mining and Analytics, 2(1):48–57.
Mathew, S. (2021). Overview of Amazon Web Ser-
vices. https://docs.aws.amazon.com/whitepapers/
latest/aws-overview/introduction.html. Accessed:
2021-09-09.
Morris, K. (2016). Infrastructure as code: managing
servers in the cloud. O’Reilly Media, Inc.
Rieke, N., Hancox, J., Li, W., Milletari, F., Roth, H., Al-
barqouni, S., Bakas, S., Galtier, M. N., Landman,
B., Maier-Hein, K., et al. (2020). The future of dig-
ital health with federated learning. arXiv preprint
arXiv:2003.08119.
Voigt, P. and Von dem Bussche, A. (2017). The eu general
data protection regulation (gdpr). A Practical Guide,
1st Ed., Cham: Springer International Publishing.
Walonoski, J., Klaus, S., Granger, E., Hall, D., Gregorow-
icz, A., Neyarapally, G., Watson, A., and Eastman,
J. (2020). Synthea
TM
novel coronavirus (covid-19)
model and synthetic data set. Intelligence-based
medicine, 1:100007.
Wilkinson, M. D., Dumontier, M., Aalbersberg, I. J., Apple-
ton, G., Axton, M., Baak, A., Blomberg, N., Boiten,
J.-W., da Silva Santos, L. B., Bourne, P. E., et al.
(2016). The FAIR guiding principles for scientific data
management and stewardship. Scientific data, 3(1):1–
9.
Yang, C., Huang, Q., Li, Z., Liu, K., and Hu, F. (2017).
Big data and cloud computing: innovation opportuni-
ties and challenges. International Journal of Digital
Earth, 10(1):13–53.
WEBIST 2021 - 17th International Conference on Web Information Systems and Technologies
144
