
Towards a Smart Identification of Tax Default Risk with Machine
Learning
Vinicius Di Oliveira
1,2 a
, Ricardo Matos Chaim
1 b
, Li Weigang
1 c
,
Sergio Augusto Para Bittencourt Neto
1,2 d
and Geraldo Pereira Rocha Filho
1 e
1
University of Brasilia, Federal District, Brazil
2
Secretary of Economy, Brasilia, Federal District, Brazil
Keywords:
Machine Learning, Data Preparation, Tax Default, Risk Identification.
Abstract:
The failure to perceive non-payment of the tax due is the main risk of tax inspection. The complex tax
legislation and the volume of information available must be overcome for facing tax evasion. There is a gap in
studies investigating the analysis of tax default risk and Machine Learning algorithms. This study proposes the
use of ML algorithms ordinarily used on credit risk analysis as a risk analysis tool for tax default. The tax data
preparation issue was faced by discretizing qualitative and quantitative variables. This work presents a new
approach for the classification of companies regarding tax avoidance using Machine Learning. The developed
ANN model achieved an AUC = 0.9568 in the classification task. The study gathers more than 300 thousand
companies in the city of Brasilia - Brazil, analyzing their socioeconomic and financial characteristics.
1 INTRODUCTION
The objective of tax inspection is to detect the lack
of payments due to evasion or errors. Thus the main
risk of tax inspection is the failure to perceive non-
payment of the tax due. The large amount of infor-
mation available and the complexity of tax legislation
makes it necessary to use state-of-the-art technology
and scientific techniques to manage the risk of tax
evasion.
Several studies address algorithms based on statis-
tical techniques and machine learning algorithms in
credit risk analysis in the literature (Pochiraju and Se-
shadri, 2019; Golbayani et al., 2020; Bahrami et al.,
2020). However, there is a gap in studies related to
the analysis of tax default risk. Likewise, there is a
lack of studies on predicting taxpayers’ behavior. On
the one hand, the available taxpayer’s information is
abundant.
With this perspective, this study is proposed to in-
vestigate the use of predictive models based on ma-
chine learning to identify companies with the risk of
a
https://orcid.org/0000-0002-1295-5221
b
https://orcid.org/0000-0003-0206-7076
c
https://orcid.org/0000-0003-1826-1850
d
https://orcid.org/0000-0002-6903-938X
e
https://orcid.org/0000-0001-6795-2768
tax evasion.
For this assignment, a parallel was made between
credit risk and risk of tax default. The hypothesis
tested is whether the credit risk analysis performed
by Machine Learning models can be applied as a risk
analysis tool for tax default.
To do such a task, a methodology of data prepa-
ration was proposed to treat the companies features.
Among these characteristics there are those of an eco-
nomic nature and those of a financial nature. All
of them were transformed and grouped according to
their aspects and relevance. This methodology has
been called Full Discretization where the continuous
variables are discretized according to quartiles of its
distribution curve.
The observed population was more than 300 thou-
sand companies in the Fiscal Register of Brasilia, the
capital of Brazil. For all analyzes and modeling, the
entire population was considered.
The paper is organized as follows. Section 2
reports works related to the application of machine
learning techniques in the context of credit risk anal-
ysis and tax evasion avoidance. Section 3 presents
the data preparation process. Section 4 introduces
the models applied and the analysis of the results ob-
tained. Section 5 contains conclusions and further
ideas for future works.
422
Di Oliveira, V., Chaim, R., Weigang, L., Neto, S. and Filho, G.
Towards a Smart Identification of Tax Default Risk with Machine Learning.
DOI: 10.5220/0010712200003058
In Proceedings of the 17th International Conference on Web Information Systems and Technologies (WEBIST 2021), pages 422-429
ISBN: 978-989-758-536-4; ISSN: 2184-3252
Copyright
c
2021 by SCITEPRESS – Science and Technology Publications, Lda. All rights reserved

2 RELATED WORK
Data mining has emerged as a very active field ap-
plied to virtually every field of science. There are a
wide variety of data mining tools available and sev-
eral different techniques in every area of evolving
research (Bramer, 2016; Aggarwal, 2015; Fayyad,
1996). A classic application of data mining is the clas-
sification for credit approval, where the models can
be constructed with fuzzy support vector machines,
or applied decision trees, neural networks, and logis-
tic regression applied to the risk analysis of receiv-
ables accounts (Pochiraju and Seshadri, 2019; Gol-
bayani et al., 2020; Jabeur et al., 2021). In particu-
lar, it is worth noting their use in credit risk analy-
sis, widely used by retail and financial establishments
(Wu, 2015). From this application emerges the hy-
pothesis of using credit scoring models to assess the
risk of tax default addressed in this study.
Credit scoring is concerned with the development
of empirical models to support decision-making in the
retail credit business (Thomas and Edelman, 2017).
Credit risk classification is a base model for estimat-
ing the likelihood of a borrower demonstrating some
unwanted behavior in the future. For example, in
scoring applications, lenders apply predictive mod-
els, called scorecards, to estimate the likelihood of de-
fault. Corporate risk models use balance sheet data, fi-
nancial indices, or macroeconomic indicators (Bromi-
ley, 2015), while retail models use data from request
forms, customer demographics, and transactional cus-
tomer historical data (Lessmann, 2015).
The use of electronic invoices to assess the risk
of payment default has grown in recent years. The
invoice issuing characteristics can be used to predict
the buyer’s behavior regarding the payment of those
transactions (Cha et al., 2020; Bahrami et al., 2020).
As used in default risk assessment, the classifica-
tion of invoice issuance using machine learning tech-
niques (Yu et al., 2018) has been studied and devel-
oped in recent works regarding avoidance of tax eva-
sion (Mathews et al., 2020; Bardelli et al., 2020; An
et al., 2020) and fraud detection (Kim et al., 2020; He
et al., 2020).
In this study, a much larger set of features will be
taken into account in the classification of companies
regarding their fiscal behavior.
The problem associated with credit risk classi-
fication is the categorization of potential borrowers
into good or bad payers. The models are designed
to help banks decide whether or not to grant a loan
to a new borrower using the data of their charac-
teristics. Despite the evolution of technology, lin-
ear regression is still the industry standard reference
model used to construct credit risk classification mod-
els (Gouv
ˆ
ea M., 2013), although other techniques
are overcoming (Teles et al., 2020), the studies sur-
veyed have demonstrated that artificial intelligence
techniques, such as neural networks, support vector
machine - SVM, decisions trees - DT, random forests
- RF e na
¨
ıve Bayes - NB, may be substituted for statis-
tical approaches in the construction of credit scoring
models (Maher A., 2016). That is, in recent years, ar-
tificial intelligence has shown its advantages in credit
scores compared to linear models of probability, dis-
criminant analysis and other statistical techniques.
A Multi-layer Perceptron - MLP is an artificial
neural network used for classification, pattern recog-
nition, and prediction consisting of an input layer, hid-
den layers, and output layer. The number of changes
in the hidden layer depends on the complexity of the
data. The MLP uses a supervised learning technique
in which the desired output is known by the network
(Pandey and Cho, 2018). In the field of credit scor-
ing, neural networks can be distinguished from other
statistical techniques. Using neural networks, if the
results are unacceptable, the estimated values of the
parameters will be altered by the networks until they
become acceptable or until they reach the ideal value
of each parameter (Abdou, 2011).
3 THE DATA ISSUE
A big challenge in data modeling is how the data will
be prepared and transformed. To carry out this study,
many features were considered, so looking at this task
brought the proposal of the full discretization method-
ology, which will be discussed in this section.
3.1 Business Understanding:
Prospecting Tax Default
Prospecting evidence is presented to seek clues to
some irregularity that generates less payment of the
tax due. This is distinct from the identification of ir-
regularities, which points exactly to the failure, fraud,
or omission of the taxpayer that generated tax evasion.
An example of identifying irregularities in the non-
delivery of declarations, the deliberate non-payment
of tax already launched, the non-accounting of tax
documents, or the mere non-issuance of invoices.
On the other hand, the prospect of evidence seeks
the discovery of unusual or peculiar irregularities that
have not yet been foreseen and documented. The
most used form in the tax administration of the city
of Brasilia / Brazil is the attempt to infer the income
Towards a Smart Identification of Tax Default Risk with Machine Learning
423

of certain taxpayers, then estimate the number of col-
lections expected for those individuals and compares
with the total effectively collected, where there is sig-
nificant divergence is separated for more accurate in-
spection to identify a possible irregularity that justi-
fies some fiscal action.
But what about cases of revenue omissions that
make an excellent inference impossible? Or in the
cases of innovative accounting maneuvers with the
purpose of tax evasion? Traditional methods would
not be effective. Therefore, the use of predictive mod-
els of risk default appears as an alternative, or even
complement, to the methods now used to identify tax
evasion cases not recognized in the routines currently
adopted.
3.2 Preparing and Understanding the
Data
To feed the models, the information of the taxpayer’s
object of study is arranged to demonstrate their char-
acteristics and economic-fiscal characteristics. In
comparison with the credit risk models used by fi-
nancial service providers, the individual characteris-
tics of a borrowing entity would be those related to
its people, such as age, sex, or profession, and its
economic-fiscal characteristics would be its income,
its expenses, or its behavioral history as a borrower.
At the same time, for a taxpayer entity, the individ-
ual characteristics would be those related to its legal
personalities, such as economic activity, type of com-
pany, or fiscal regime. The economic-fiscal character-
istics would be its billing outcomes, its tax collection,
or its fiscal history.
Data were extracted from 305,685 companies en-
rolled in the Tax Registry of Brasilia, the capital of
Brazil, among these, 79,548 companies have debts
registered for some non-payment referring to the
years 2012 to 2017. The same company may have
different debts registered, referring to more than one
year. The following is a description of each variable
and the report of how the data were discretized for the
composition of the model’s database as described by
Silva (Silva, 2016).
3.2.1 Discrete Variables
The individual characteristics of the “taxpayer” enti-
ties in this study were extracted from the Tax Registry
of the city of Brasilia. They are intrinsic qualities to
the legal personality of the company and its legal con-
stitution, registered at the moment in which the com-
pany is created, updated to each contract amendment
throughout the existence of the company. The exclu-
sive attributes, such as the registry identification num-
ber, address, and the partners’ names, were excluded
to maintain fiscal confidentiality, which will not prej-
udice the study.
All the discrete variables were treated in the same
way, the intention of this treatment is to separate, for
each variable, the most significant instances of the
others. For this, the 80/20 rule was applied so that the
instances responsible for 80% of the occurrences were
individualized, the others were grouped into a single
identification. The process followed these steps:
1. Identification of the observed instances and re-
spective frequencies (number of occurrences);
2. Sorting the instances by the frequency in descend-
ing order;
3. Each instance will be assigned its relative and ac-
cumulated frequency;
4. Assign an identification for each instance, sequen-
tially in the order of the previous item, until the
accumulated frequency is 80% of the total;
5. Group the other instances in the same identified
group, for example: Others.
The discrete variables are presented below.
TC. Taxpayer Type. The specification of the com-
pany’s corporate form as well as its legal nature, e.g.,
limited company, limited business partnership, corpo-
ration, joint stock company, cooperative, private asso-
ciation, etc.: TC1 = entrepreneur (individual), TC2 =
private limited company and TC3 = “Others”.
TA. Activity Time. The operation time of the com-
pany since its registration in the fiscal register of the
Federal District: TA1 = from 0 to 4 years, TA2 = 5 to
9 years and TA3 = 10 years or more.
AEICMS. ICMS Economic Activity. The indi-
cation of the economic activity performed by the
company related to the ICMS (tax similar to Euro-
pean VAT, but applied to transactions with goods):
AICMS1 = Commerce, AICMS2 = Housing and
Food, AICMS3 = Industry and AICMS4 = “Others”.
AEISS. ISS Economic Activity. The indication of
the economic activity performed by the company re-
lated to the ISS (tax similar to European VAT, but ap-
plied to services): AISS1 = Service Activities, AISS2
= Construction, AISS3 = Administrative Activities,
AISS4 = Professional Activities, AISS5 = Commerce,
AISS6 = Industry, AISS7 = Transportation, AISS8
= Autonomous, AISS9 = Education and AISS10 =
“Others”.
WEBIST 2021 - 17th International Conference on Web Information Systems and Technologies
424
CALC. Calculation Form of ICMS And/or ISS.
The description of the manner in which the tax
will be applied on the company’s economic activ-
ity, e.g., normal regime, simple national system, in-
dividual micro-entrepreneur - SIMEI, rural producer,
uni-professional, autonomous society, etc.: CALC1
= micro-entrepreneur, CALC2 = simple national sys-
tem, CALC3 = normal regime and CALC4 = “Oth-
ers”.
SOCI. Number of Company’s Partners. The
number of partners registered in the company’s so-
cial contract and indicated in the Fiscal Register of the
Federal District: SOCI1 = Only one member, SOCI2
= Two partners and SOCI3 = Three or more partners.
SOPJ. Has Legal Entity as a Partner. The indi-
cation that at least one of the company’s partners is
a legal entity: SOPJ1 = no legal entity and SOPJ2 =
With legal entity.
3.2.2 Continuous Variables
The socio-economic characteristics of the “taxpayer”
entities in this study were extracted from their tax dec-
larations, their financial records of collections, and
their fiscal history. This whole information was made
available for the present work in the State Department
of Finance of the city of Brasilia. The tax declarations
indicate qualities related to the company’s incomes,
consequently linked to its revenues, for this, the Elec-
tronic Tax Books - LFE
1
delivered were observed.
Its financial records of tax collections were observed
as part of the company’s costs. The tax behavior was
verified through the history of fiscal actions suffered
by the taxpayer, resulting in tax collection with fines.
In the base model, the sums of the total values ver-
ified individually by the companies regarding the de-
clared values and the values of collection, already for
the fiscal history, were observed whether the company
was sued or not. In this case, “sued” means that the
company has suffered some tax action in the past, and
it has resulted in some type of charge of tax due and
not collected with fines. Thus, the following charac-
teristics were used: Total value of exits over the total
value of entries declared in the Electronic Tax Book,
the total amount of tax collected, and finally, whether
it was sued or not.
RLFE. Total Value of Exits over the Total Value of
Entries Declared in the Electronic Tax Book. The
sum of the values of the exits (sales and / or services
1
From the Portuguese Livro Fiscal Eletronico
rendered) divided by the sum of the entries (purchases
and / or services taken) declared in the Electronic Tax
Book delivered in the system of the State Department
of Finance of the Federal District. In the extracted
database, 305,685 records, both null and absent val-
ues were verified in 261,382 records, thus the statis-
tics of this distribution considered only the observed
values.
Table 1: Statistics of RLFE fraction values series.
Minimum 1st Quartile Median
0.0 0.1 0.4
Mean 3rd Quartile Maximum
225.4 0.8 2,802,499.9
It is noted by the series statistics, Table 1, that the
distribution is concentrated in values smaller than 1
(3rd quartile = 0.8), the rest being distributed spar-
ingly up to the maximum value of “2,802,499.9”.
where the average is“225”. It can be said that the se-
ries is a geometric distribution similar to the Gamma
Distribution, the values are concentrated in a region
of the frequency distribution with great dispersion at
the highest values. Thus, for the treatment of this se-
ries, the decimal logarithm of the values observed in
order to approximate the series frequency distribution
to the normal distribution (Oliveira, 2018), as can be
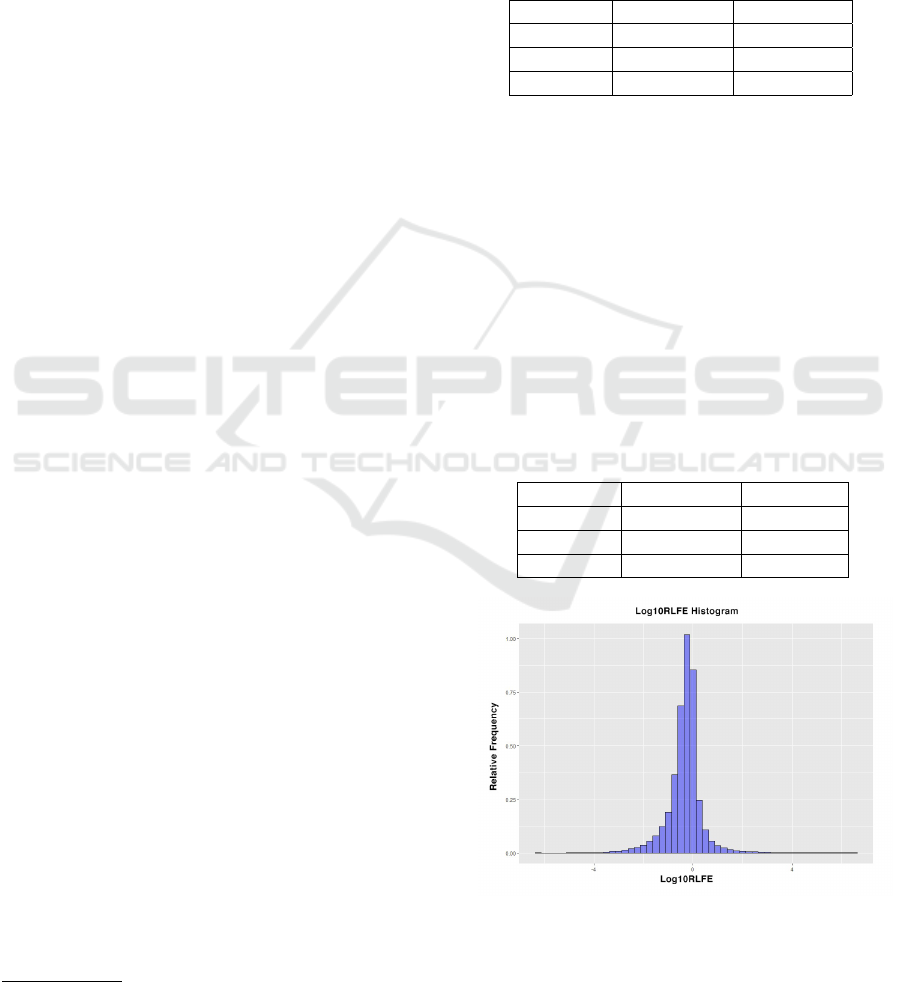
seen in Table 2 and Fig. 1 below.
Table 2: Statistics of Log10 of the RLFE fraction values
series.
Minimum 1st Quartile Median
-6.27 -0.59 -0.27
Mean 3rd Quartile Maximum
-0.35 -0.05 6.45
Figure 1: Histogram of Log10 of the RLFE fraction values
series.
Thus, the following configuration was proposed
for the RLFE variable.
Towards a Smart Identification of Tax Default Risk with Machine Learning
425
Where:
Null or absent values: RLFE0
Log10(RLFE) < (−0.59); 1st Q.: RLFE1
(−0.59) ≤ Log10(RLFE) < (−0.27); 2nd Q.:
RLFE2
(−0.27) ≤ Log10(RLFE) < (−0.05); 3rd Q.:
RLFE3
Log10(RLFE) ≥ (−0.05); 4th Q.: RLFE4
REC. Total Amount of Tax Collected. The sum of
values collected to the Federal District’s treasury re-
lated to ICMS and ISS taxes. Like the series of values
of the RLFE fraction, the values of the total collec-
tions, REC
2
, resemble a Gamma Distribution, values
concentrated in a region of the frequency distribution
with great dispersion in the highest values, as seen in
Table 3.
Table 3: Statistics of the REC values series.
Minimum 1st Q. Median
0.0 0.0 35.01
Mean 3rd Q. Maximum
156,324.57 1,2610.09 5,645,030,723
In this way the same previous strategy was
adopted, the conversion of the values to the decimal
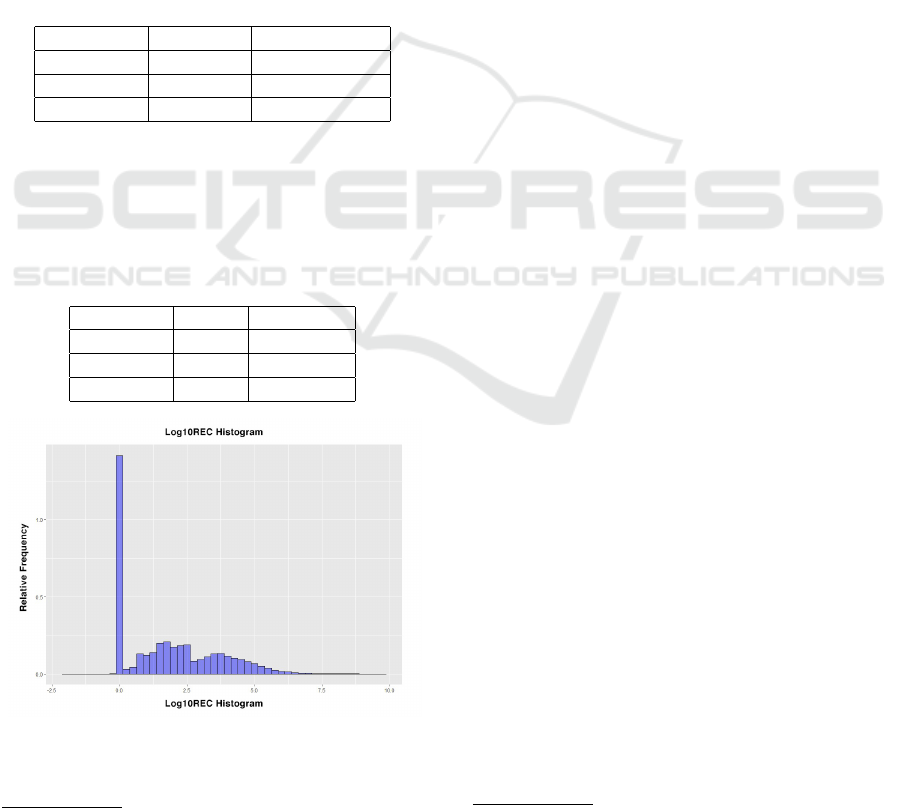
logarithm. Table 4 presents the new series statistics
and in Fig. 2 we observe the frequency histogram of
the Log10 series of REC.
Table 4: Statistics of the REC values series.
Minimum 1st Q. Median
-2 0.0 1.54
Mean 3rd Q. Maximum
1.77 3.1 9.75
Figure 2: Histogram of Log10 of the REC values series.
2
From the portuguese Recolhimentos
The following configuration was proposed for the
REC variable. Where:
Log10(REC) ≤ 0; 1st Q.: REC1
0 < Log10(REC) ≤ (1.54); 2nd Q.: REC2
(1.54) < Log10(REC) ≤ (3.1); 3rd Q.: REC3
Log10(REC) > (3.1); 4th Q.: REC4
AUTO. If It Was Sued or Not. Indication if the
company has already suffered any tax action whose
result has proven some irregularity and consequently
charged taxes and penalties. A total of 1,597 compa-
nies was sued in some way during the observed pe-
riod. Thus, the following configuration was proposed
for this variable:
Company not sued in the period: AUTON
Company sued in the period: AUTOS
The models propose to predict the future default
situation or not of certain taxpayers. To represent such
a prediction, it will be adopted as variable explained
the registration of Active Debt of the Federal District.
This register shows the list of companies in default
regarding their obligations to the Tax Administration
of the Federal District (city of Brasilia) as well as the
characteristics of the debit registered, e.g., value, ref-
erence year or nature of debt.
DA (Variable Y). Inclusion in Active Debt. The
variable to be predicted in the models, or explained
variable, will be the company’s occurrence in the Fed-
eral District’s Active Debt register
3
. In the total of
305,686 records observed, there were 79,548 compa-
nies registered in active debt at some point in the ob-
served period. Thus, for the variable explained, the
standard configuration for classification algorithms
was adopted, i.e., the value “1” for positive occur-
rences and “0” for the negatives.
It was enrolled in Active Debt: “1”
It was not been enrolled in Active Debt: “0”
Regarding the temporal aspect, the data show the
information of the active companies in the DF veri-
fied in October 2018, as well as the ratio of compa-
nies registered in Active Debt to this date, but only
those debts referring to 2017 were considered. the
economic-financial data were observed the records of
the years 2012 to 2017. A partial view of the treated
data can be seen in Table 5.
4 MODELING
The database was randomly divided into three parts:
(1) Training - 70% of records; (2) Validation - 20% of
3
From the portuguese Divida Ativa
WEBIST 2021 - 17th International Conference on Web Information Systems and Technologies
426
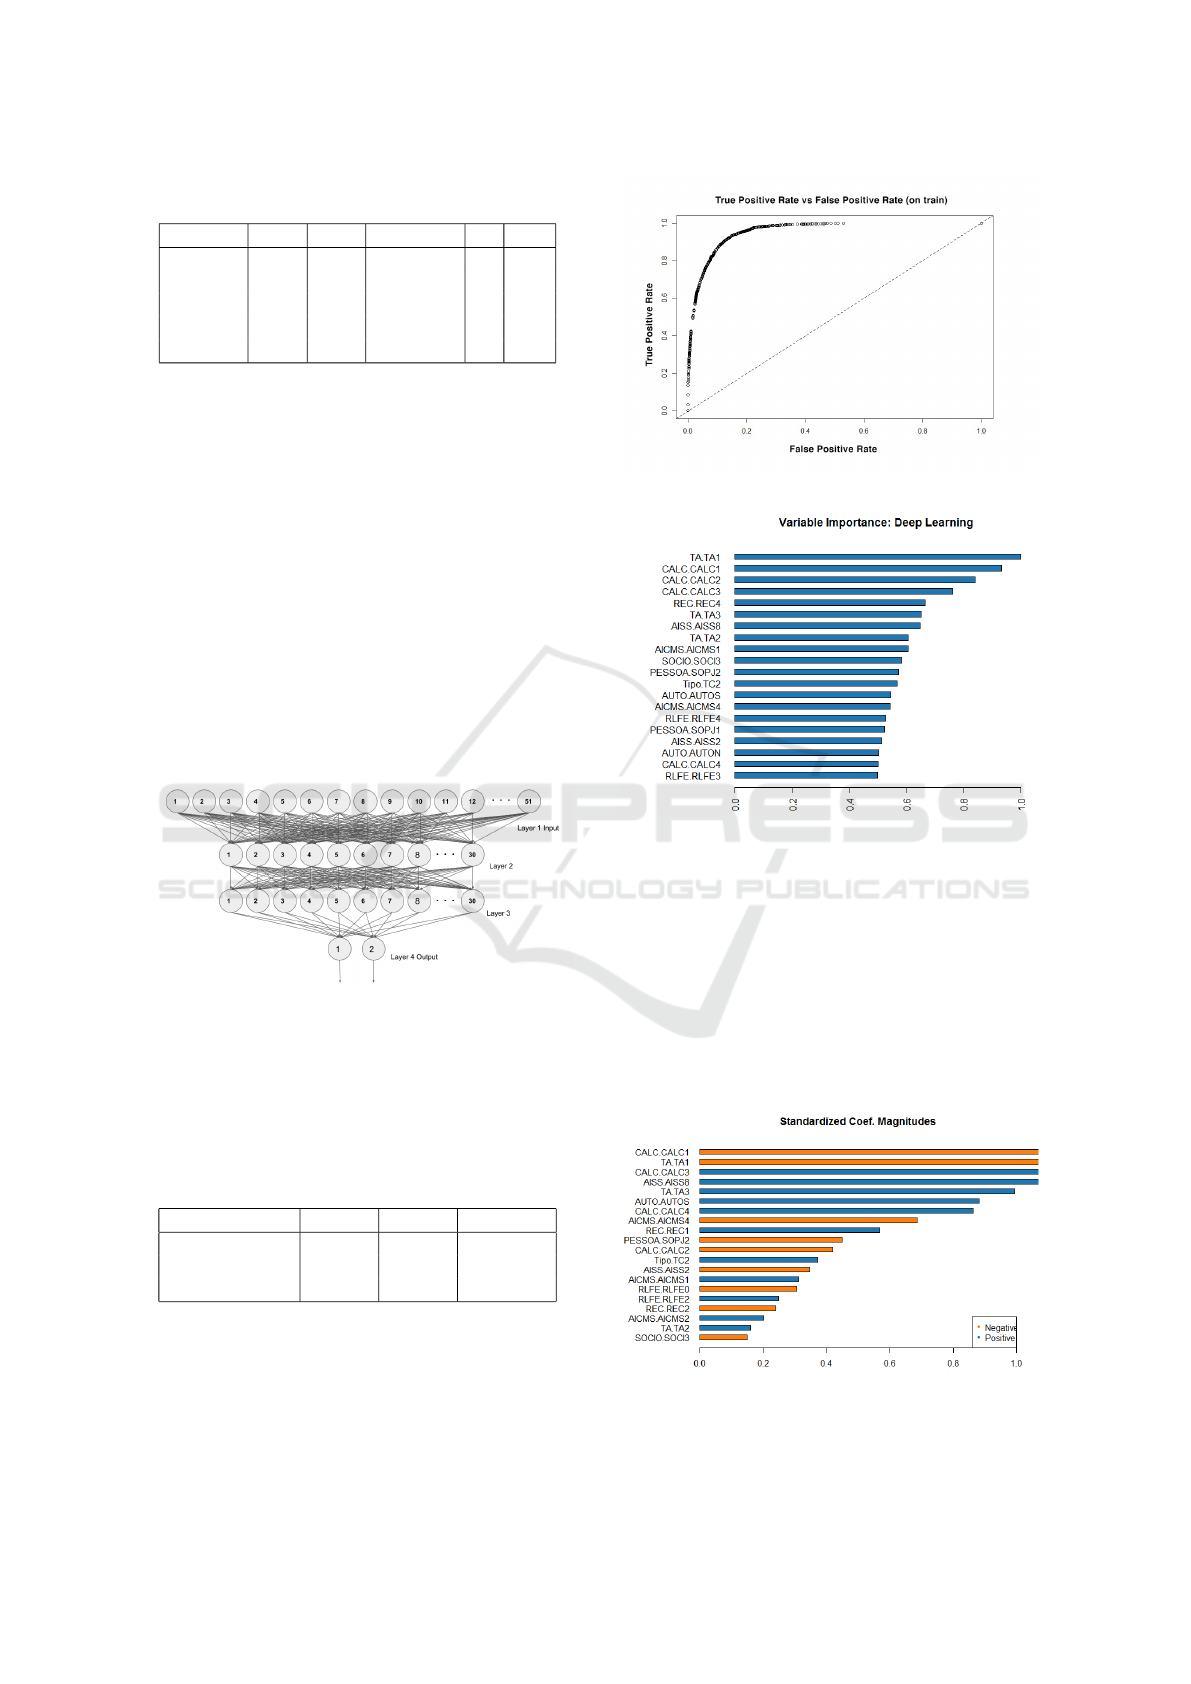
Table 5: Data visualization after discretization treatment.
Reg. TC TA AEICMS ... DA
1 TC2 TA3 AICMS1 ... 1
2 TC1 TA1 AICMS4 ... 0
3 TC2 TA3 AICMS4 ... 1
... ... ... ... ... ...
305,586 TC1 TA1 AICMS2 ... 0
records; and (3) Test - 10% of the records (Oliveira,
2018). The algorithms used in the R Studio platform
for data modeling were: For the LOGIT regression,
“H2O Generalized Linear Models” (GLM) and for
the Artificial Neural Network, “H2O Deep Learning”
(DL). The GLM and DL models were developed as
shown in the following items.
4.1 Artificial Neural Network: DL
In the configuration of the neural network, several
forms of network design were tested, ranging from
one to three internal layers as well as the number of
neurons per layer (10, 20, 30, 60 and 100 neurons).
Finally, we arrived at the optimal arrangement of two
internal layers with thirty neurons each, in 20 epochs,
as shown in Fig. 3.
Figure 3: Graphical representation of the optimal ANN
adopted in the model.
The neural network model obtained a R2 = 0.6203
and the area under the ROC curve was AUC = 0.9568,
as can be seen in Fig. 4. The model Confusion Matrix
is presented in Table 6.
Table 6: Confusion Matrix of ANN adopted.
Real X Predict 0 1 Error
0 41,128 3,907 0.086755
1 2,540 13,182 0.161557
Totals 43,668 17,089 0.106111
The 20 most significant variables of the DL model
are indicated in Fig. 5. In association with the magni-
tude of the GLM model coefficients (presented in the
next section), this information can be used to identify
the risk factors indicated by the modeling.
Figure 4: DL model ROC curve.
Figure 5: DL variables importance (20 major).
4.2 Logit Regression: GLM
The GLM model developed belongs to the binomial
family with 41 predictive coefficients, corresponding
to each of the binary variables, of which 32 were ac-
tive, that is, 9 did not have significance in the model
(Caffo, 2015; Hosmer Jr., 2004). Fig. 6 shows the 20
coefficients of greatest significance. This information
will be useful in identifying the risk factors of tax de-
fault.
Figure 6: GLM model Magnitude coefficients (20 major).
Towards a Smart Identification of Tax Default Risk with Machine Learning
427
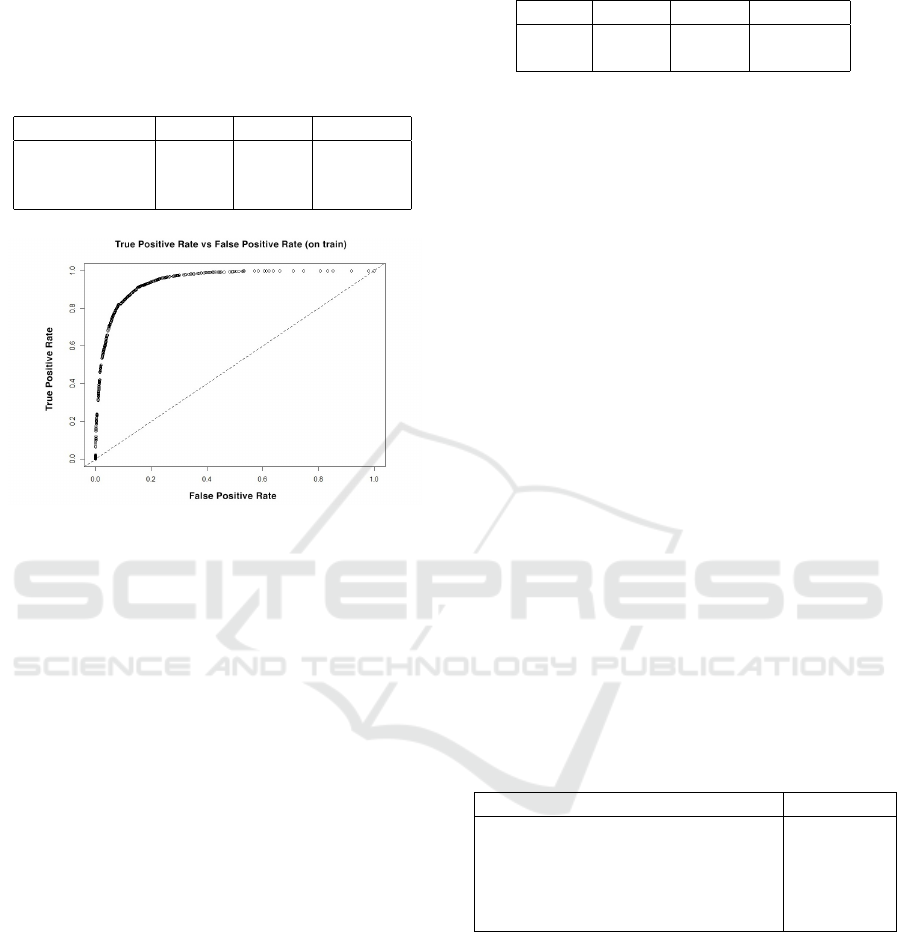
The regression model obtained a R2 = 0.5902 and
the area under the ROC curve was AUC = 0.9484, as
can be seen in Fig. 7. The model Confusion Matrix is
presented in Table 7.
Table 7: GLM model Confusion Matrix.
Real X Predict 0 1 Error
0 41,288 3,747 0.083202
1 2,783 12,939 0.177013
Totals 44,071 16,686 0.107477
Figure 7: GLM ROC Curve.
4.3 Model Evaluation
The simplicity of the discretization methodology of
the variables based on the Pareto rule (80/20) was em-
phasized in the study, although the hard-working, this
method provides a uniform data treatment for all vari-
ables.
The qualitative variables discretization, regarding
the companies social and economic characteristics,
followed a clear and defined sequence of steps in
their treatment in order to prioritize the most recurrent
characteristics and to group the least recurrent ones.
On the other hand, the quantitative variables dis-
cretization, referring to the declared values and values
collected by the companies, was done by dividing the
data into quartiles according to their frequency distri-
bution. The mathematical artifice using the decimal
logarithm of the values proved to be effective as can
be observed in the significance of these variables in
both models.
The methodology presented above of preparing
discrete variables and continuous variables can be
called Full Discretization.
The studied models had a very similar perfor-
mance, as shown in Table 8. Both obtained a good
performance in the task of prediction with highlight
to neural network superiority (DL).
Table 8: Comparison between GLM and DL models.
Model R2 AUC Error rate
GLM 0.5902 0.9484 0.107477
DL 0.6203 0.9568 0.106111
4.4 Discussion
The predictive models used in this study highlighted
some variables in relation to others, as can be seen
trough the importance of the variables verified in the
models (Fig. 5 and Fig. 6). About the magnitude
measurement of the variables, the regression (GLM)
shows the positive or negative sign of each variable
coefficient. The neural network (DL), as its own char-
acteristic, shows only which are the most significant
variables for the model, it does not allows to observe
if this influence is positive or negative. Thus the in-
terpretation of the variables influence should be done
looking at the two models together, so is possible to
identify which variable could represent a tax default
risk (Gouv
ˆ
ea M., 2013). That said, it can be stated
that the variables with the highest positive values are
those that offer the highest tax default risk.
The Tax Administration of Brasilia had access to
our model. A data set of 270 thousands active com-
panies had been classified and 7,573 companies were
identified as “possible defaulters” (Y = 1). After a
closer look bay the tax audit team, strong signs of ir-
regularities were found in 1,004 of those companies.
The result is shown in Table 9, which confirms the rel-
evance of the classification made by Machine Learn-
ing.
Table 9: Indications of tax irregularity in companies indi-
cated by the DL model.
Tax irregularities detected Companies
I - Misappropriation of credit 377
II - Non-accounting of debts 146
III - Revenue omission 677
IV - At least two of the above items 58
V - The three evidences I, II and III 1
5 CONCLUSIONS
This work successfully demonstrated that machine
learning algorithms traditionally applied in credit risk
assessment can be used for tax risk evaluation. The
present study had the perspective to confirm Machine
Learning techniques in the search of tax defaults evi-
dence. Likewise, the Full Discretization methodology
was verified as a clear and objective path to prepare
data for modeling. In the near future, this process may
WEBIST 2021 - 17th International Conference on Web Information Systems and Technologies
428

be part of an artificial intelligence system for tax fraud
detection.
For future studies new variables should be in-
cluded, such as the issuance of invoices, billing with
sales on credit cards, or changes in the number of em-
ployees. Or yet, ANN assembles models associated
with other Machine Learning algorithms.
REFERENCES
Abdou, H., P. J. (2011). Credit scoring, statistical tech-
niques and evaluation criteria: a review of the liter-
ature. Intelligent Systems in Accounting, Finance &
Management, 18(2/3):59–88.
Aggarwal, C. C. (2015). Data mining: the textbook.
Springer.
An, J., Zheng, Q., Wei, R., Dong, B., and Li, X. (2020).
Neud-tri: Network embedding based on upstream and
downstream for transaction risk identification. In Pro-
ceedings - 2020 IEEE 44th Annual Computers, Soft-
ware, and Applications Conference, COMPSAC 2020,
pages 277–286.
Bahrami, M., Bozkaya, B., and Balcisoy, S. (2020). Using
behavioral analytics to predict customer invoice pay-
ment. Big Data, 8(1):25–37.
Bardelli, C., Rondinelli, A., Vecchio, R., and Figini, S.
(2020). Automatic electronic invoice classification us-
ing machine learning models. Machine Learning and
Knowledge Extraction, 2(4):617–629.
Bramer, M. (2016). Principles of Data Mining, volume 1.
Springer, London.
Bromiley, P., M. M. N. A. R. E. (2015). Enterprise risk man-
agement: Review, critique, and research directions.
Long Range Planning, 48(4):265–276.
Caffo, B. (2015). Regression Models for Data Science in R,
volume 1. Leanpub.
Cha, S. ., Wang, H., Tan, Z., Joung, Y. ., Tseng, Y. ., and
Yeh, K. . (2020). On privacy aware carriers for value-
possessed e-invoices considering intelligence mining.
IEEE Transactions on Emerging Topics in Computa-
tional Intelligence, 4(5):641–652.
Fayyad, U., P. G. S. P. (1996). From data mining to knowl-
edge discovery in databases. AI Magazine, 17(3):18.
Golbayani, P., Florescu, I., and Chatterjee, R. (2020). A
comparative study of forecasting corporate credit rat-
ings using neural networks, support vector machines,
and decision trees. The North American Journal of
Economics and Finance, 54:101251.
Gouv
ˆ
ea M., Gonc¸alves E., M. D. (2013). An
´
alise de risco
de cr
´
edito com aplicac¸
˜
ao de regress
˜
ao log
´
ıstica e re-
des neurais. Revista Contabilidade Vista & Revista,
24(4):96–123.
He, Y., Wang, C., Li, N., and Zeng, Z. (2020). Attention and
memory-augmented networks for dual-view sequen-
tial learning. In Proceedings of the ACM SIGKDD In-
ternational Conference on Knowledge Discovery and
Data Mining, pages 125–134.
Hosmer Jr., D., L. S. (2004). Applied logistic regression,
volume 1. John Wiley & Sons.
Jabeur, S. B., Serret, V., et al. (2021). Bankruptcy prediction
using fuzzy convolutional neural networks. In World
Finance Conference.
Kim, S., Tsai, Y. ., Singh, K., Choi, Y., Ibok, E., Li, C. ., and
Cha, M. (2020). Date: Dual attentive tree-aware em-
bedding for customs fraud detection. In Proceedings
of the ACM SIGKDD International Conference on
Knowledge Discovery and Data Mining, pages 2880–
2890.
Lessmann, S., B. B. S. H. e. a. (2015). Benchmarking state-
of-the-art classification algorithms for credit scoring:
An update of research. European Journal of Opera-
tional Research, 247(1):124–136.
Maher A., M. F. (2016). Classifiers consensus system ap-
proach for credit scoring. Knowledge-Based Systems,
104(1):89–105.
Mathews, J., Mehta, P., Suryamukhi, and Babu, S. (2020).
Link prediction techniques to handle tax evasion.
In ACM International Conference Proceeding Series,
pages 307–315.
Oliveira, P., G. S. (2018). Ci
ˆ
encia de Dados com R –
Introduc¸
˜
ao. Ed. IBPAD, Bras
´
ılia, 1 edition.
Pandey, T., J. A. D. S. and Cho, S. (2018). A novel commit-
tee machine and reviews of neural network and sta-
tistical models for currency exchange rate prediction:
An experimental analysis. Journal of King Saud Uni-
versity – Computer and Information Sciences.
Pochiraju, B. and Seshadri, S. (2019). Essentials of Busi-
ness Analytics: An Introduction to the Methodology
and Its Applications, volume 264. Springer.
Silva, L. A., P. S. M. B. C. (2016). Introduc¸
˜
ao a Minerac¸
˜
ao
de Dados: com aplicac¸
˜
oes em R. Ed. Elsevier, Rio de
Janeiro, 1 edition.
Teles, G., Rodrigues, J. J., Rab
ˆ
e, R. A., and Kozlov, S. A.
(2020). Artificial neural network and bayesian net-
work models for credit risk prediction. Journal of Ar-
tificial Intelligence and Systems, 2:118–132.
Thomas, L., C. J. and Edelman, D. (2017). Credit scoring
and its applications, volume 2. Siam.
Wu, D., O. D. L. D. A. (2015). Decision making in enter-
prise risk management: A review and introduction to
special issue. Omega, 57(Part A):1–4.
Yu, J., Qiao, Y., Sun, K., Zhang, H., and Yang, J. (2018).
Poster: Classification of transaction behavior in tax
invoices using compositional cnn-rnn model. In Ubi-
Comp/ISWC 2018 - Adjunct Proceedings of the 2018
ACM International Joint Conference on Pervasive and
Ubiquitous Computing and Proceedings of the 2018
ACM International Symposium on Wearable Comput-
ers, pages 315–318.
Towards a Smart Identification of Tax Default Risk with Machine Learning
429
