
Evaluating Player’s Passing Ability based on Passing Network
Zhang Zhipei
and Pan Bingyu
*
School of Sports Engineering, Beijing Sport University, Xinxi Road no.48, HaiDian District, Beijing, China
Keywords: Soccer, Passing Network, Players’ Value, Machine Learning.
Abstract: As one of the most basic techniques of modern football, passing not only involves coordination within the
team and different passing routes but is also closely related to the opponent team and the situation of the game.
How to evaluate players’ ability to pass in such a complex environment has been a popular issue in the field
of sports performance. Based on social network analysis, this paper constructs passing network and calculates
ten indicators such as degree centrality. Then, using classification algorithms –The Gradient Boosting
Decision Tree where these ten indicators serve as features to train a model to predict the average goal of each
player. After adjusting parameters, the accuracy of the model reaches 0.628 while the value of AUC is 0.709,
which shows the prediction of the model is relatively high, and social network analysis is an effective way to
evaluate players’ passing ability to some extent.
1 INTRODUCTION
As football is one of the most popular team games in
the world, evaluating the ability of football players
has always been a focus of interest in the field of
sports performance. The ability of players influences
the outcome of games to a large extent, but it is hard
to find the core indicators quantifying the outcome of
a game as it is related to very complex factors. Many
scholars do a lot of analysis and researches: Carlos et
al. analyzed team strategy based on the ratio of wins
and losses (Carlos et al., 2010). Hou Huisheng et al.
came up with 10 offensive indicators and 5 defensive
indicators to spilled the core techniques of football
skill (Hou et al., 2013). Jie Chao et al. believe that 6
indicators such as the success rate of a pass can be
used to judge the outcome (Jie et al., 2016). Among
these indicators, many domestic and foreign literature
have mentioned a large number of pass-related
indicators, such as frequency, the success rate of
passing which serve as tools to do statistical analysis,
studying what role of passes is in the whole game.
Passing is one of the most basic techniques of
modern football and the basis of all football games
and strategy. Passing strategy will directly affect the
result of the game (Qu, 2001). However, in the
*
Corresponding author: Bingyu Pan
reference mentioned above, the indicators of passing
are mostly based on traditional mathematical
statistics, only focusing on one-side ability and
ignoring the mutual influence of players with
teammates and opponents.
Social network analysis was first proposed by
British anthropologist Radcliffe-Brown (Wolfe, 1995)
and widely used in sociology, informatics, and other
fields. It is generally believed that a social network is
a collection of nodes and relationships between nodes,
reflecting the hidden mode of an organization (Liu,
2014).
Due to the isomorphism of the passing networks
and social networks, the social network method
provides more dimensional information for the
analyzing passing ability of a player. Clemente et al.
find that midfielders always own higher degree
centrality, closeness centrality, and betweenness
centrality in most lineups
(M et al, 2015). With
widespread application of social network method, the
concept of passing network is derived and more
quantitative indicators are generated to quantify
various aspects of passing (Correia, 2018). However,
previous studies mostly focused on finding different
features of different roles (H, 2012; Q, 2020) or
verifying the effectiveness of a certain phenomenon
Zhipei, Z. and Bingyu, P.
Evaluating Player’s Passing Ability based on Passing Network.
DOI: 10.5220/0010711400003059
In Proceedings of the 9th International Conference on Sport Sciences Research and Technology Suppor t (icSPORTS 2021), pages 69-75
ISBN: 978-989-758-539-5; ISSN: 2184-3201
Copyright
c
2021 by SCITEPRESS – Science and Technology Publications, Lda. All rights reserved
69

or strategy (Cao, 2019), while paid less attention to
how players’ passing ability impact the whole game.
As an important part of players’ ability, it is
difficult to evaluate players’ passing ability only by
short pass, long pass, or other single indicators.
Therefore, the purpose of this paper is to build a
passing evaluation system by calculating indicators of
passing networks and use a gradient boosting decision
tree to find the importance of these indicators,
providing a reference for evaluating players’ value.
Since the end of the last century, many scholars
have focused on the core passing indicators of players:
how they influence the game and how to quantify them.
Clemente et.al believed that social network indicators
reflect the characteristics of a player’s role to some
extent, proving that side defenders and central
defenders lead the attack in most cases (Clemente,
2014). Grund et.al used algorithm such as Hierarchical
Linear Model and Poisson regression modeling to
analyze the tactical characteristics of the passing
network based on 76 indicators such as centrality and
running distance, etc., believing that the passing
network with a high density and a low centrality have
higher possibility to win (Thomas, 2015).
The studies above have shown that social network
indicators reflect the tactical characteristics of players
to a certain degree. Therefore, how to use social
network indicators as input of an algorithm to obtain
better prediction results, many previous studies can
be used as references.
The research of Power divided whether a player
scores a goal or not into two parts: the probability of
pass and chance of score and designed a formula
considering these two parts, so that obtained the total
score of each player and describe their behaviors
through supervised learning (Power et al., 2017).
Brooks et.al put forward the concept of “pass shot
value”, using feature matrix to quantify the probability
of passing and weight of every feature to decide the
importance of features, then predict through the
support vector machine (Brooks et al., 2016).
It can be seen that evaluating a player’s ability
through pass and goal is already a relatively common
research method. At the same time, many scholars
have focused on the establishment of an evaluation
system, which is building a relationship between
features through algorithms and calculating the score
of players based on the features, so that creating a
quantitative criterion for evaluating players or teams.
Based on data of 2014/15 to 2017/18 seasons of
the Premier League and Bundesliga, Bransen et.al
split a series of actions and calculated the impact of
each action on the whole game, which serves as a new
method to evaluate the value of player (M et al., 2019).
In 2019, Pappalardo et.al proposed to use support
vector machines to calculate the weight of features of
each player and promote it to each team, so that
created a comprehensive ranking system
(Pappalardo
et al., 2019). The article by Yuesen Li et.al proposed
to use a linear support vector machine to calculate the
weight of features. The result proves that the
calculated player ranking is consistent with the actual
ranking in the Chinese Super League (Li et al., 2020).
2 METOHDS
2.1 Data Source
Provided by wyscout, openly shared on figshare, the
dataset of football-logs consists of 1,941 matches,
3,251,294 events, and 4299 players 7 prominent
competitions around the world: La Liga (Spain,
2017/18), Premier League (England, 2017/18), Serie
A (Italy, 2017/18), Bundesliga (Germany, 2017/18),
Ligue 1 (France, 2017/18), FIFA World Cup 2018
and UEFA Euro Cup 2016. As there are significant
distinctions among different leagues, this paper
focuses on data of the Premier League (England,
2017/18) (Pappalardo, 2019).
This dataset is collected, labeled manually by
professional performance analysts, recording every
behavior of every player during the game which is
divided into 5 documents in JSON format:
Competitions, Matches, Events, Players and Teams.
2.2 Passing Network Analysis
Data of every game can be defined as an adjacency
matrix W to describe the passing situation of two
sides where every player serves as a vertex and every
pass serve as an edge. The width of the edge
represents the frequency of passes and analyzing the
whole network reflects the connection of each player
and the tactical features of each team.
To comprehensively evaluate the passing ability
of players, this paper selects the following ten
indicators as features of machine learning model and
calculates them through networkX in python3.6. The
following is the calculation method of all indicators
(Silva F G M, et al., 2018).
(1) Degree centrality: the sum of the direct
connections between a point and other points. It can
icSPORTS 2021 - 9th International Conference on Sport Sciences Research and Technology Support
70

be divided into: click-in centrality and point-out
centrality, respectively representing the player
receiving and passing the ball to others. The higher
the value, the closer is the connection with other
players and the more important is position of the
player in the offense.
𝐶
𝑛
𝑘
𝑎
(1)
n
i
represents a node, and a
ij
represents an
element in the adjacency matrix of the unweighted
directed graph G.
(2) closeness centrality: The sum of the distances
from a point to all other points. The smaller the sum,
the shorter the path from this point to all other points,
which means that the point is closer to all other points.
Closeness centrality reflects the proximity of a player
to other players. A player with high closeness
centrality may be in the center of the passing network.
𝐶
𝑛
𝑑𝑛
,𝑛
,
(2)
d represents the geometric distance between
nodes n
i
and n
j
.
(3) betweenness centrality: the number of shortest
paths passing through a point. Players with high
betweenness centrality may acts as a bridge,
connecting different passing routes in the passing
network and forming an overall large network.
𝐶
𝑛
𝑔
𝑛
𝑔
(3)
g
ij
refers to the number of shortest paths
between n
i
and n
j
, and g
ij
(n
k
) refers to the number of
shortest paths between n
i
and n
j
through n
k
.
(4) eigenvector centrality: eigenvector centrality
is calculated based on the centrality of adjacent nodes.
If a node is connected to more nodes or connected to
important nodes, it will have a higher eigenvector
centrality. In team sports, higher eigenvector
centrality means that the node has higher interaction
with other nodes.
𝜆𝑒
𝑅
𝑒
(4)
R is the correlation matrix, e is the eigenvector
of R, 𝜆 is a constant, and i and j are any two nodes in
the graph.
(5) current flow closeness centrality: based on
current model in the field of information
dissemination, current flow closeness centrality
reflects information transmitted by the path which
related to the length of the path and the number of
nodes.
𝐼
𝐼
𝑟,𝑠
(5)
I
ij
(r,s) refers to the number of paths between
nodes i and j.
(6) current flow betweenness centrality : The
current model in the field of information
dissemination is used to calculate the betweenness
centrality. Generally speaking, betweenness
centrality only considers the shortest path and ignores
the information contained in the non-shortest path,
while current flow betweenness centrality includes
the path distance among all points.
𝐶𝑖
𝑛𝑐
∑
𝑝
𝑖
𝑝
𝑗
(6)
nc=n-1, which is a constant, p
i
p
j is the distance between nodes i and j.
(7) subgraph centrality:Represents the sum of all
weighted closed paths starting and ending from one
node. Each closed-loop path is a dependent subgraph.
If the subgraph is smaller, the passing path is shorter
and the weight of path will be higher, because it
represents player finishes the pass sooner and starts
shooting. In team sports, a higher subgraph centrality
means that the node is the core node, and the passes
around it are more frequent and of higher quality.
𝑆𝐶𝑢 𝑣
𝑒
(7)
SC(u) represents subgraph centrality of the
node, and v
j
is the eigenvector of the adjacent matrix
of the entire passing network when the eigenvalue is
ℷ.
(8) load centrality: the shortest path through the
node. Unlike closeness centrality, load centrality only
Evaluating Player’s Passing Ability based on Passing Network
71

focuses on the shortest path, but it reflects all nodes
connected to it as nodes affect each other.
L
∑
L
1
N
(8)
𝛽=0.8, which is a constant, i and j is two nodes
which connected to each other, N is the total number
of nodes, L
i
is the required load centrality.
(9) harmonic centrality:The sum of the inverse
of the shortest path distance from all other nodes to
this node.
𝐶𝑢
1
𝑑𝑣,𝑢
(9)
d(u,v) refers to the shortest distance between u
and v.
(10) communicability betweenness centrality :
Based on the number of paths between each pair of
interconnected nodes.
𝜔
1
𝐶
𝐺
𝐺
,𝑝𝑞,𝑞𝑟
(10)
G
prq
refers to the number of all paths through node
r, G
pq
is the number of all closed-loop paths starting
from node p and ending at node q, and the reciprocal
of C is a standardized parameter, controlling the result
in the range of 0-1.
2.3 Player-rank Prediction Model
2.3.1 Data Processing
As mentioned above, this paper use figshare’s public
dataset of Premier League (England, 2017/18) which
includes 380 games, 643,150 events and 603 players
and divided into five set of json document:
competitions, events, players, matches and teams.
For purpose of quantifying passing ability of
players in all aspects, calculate the above ten
indicators of each player in each game to form the
player’s passing feature matrix Fi and standardized Fi
by python’s StandardScaler function whose principle
is Equation (12).
𝑧
𝑥 𝑢
𝑠
(11)
u is the mean value of the samples, s is the
standard deviation of the sample.
2.3.2 Parameter Selection of Player-rank
Prediction Model
In order to select a more suitable model and build a
more accurate evaluation system, this paper uses
three machine learning models to train: Linear
Support Machine (LinearSVC), Decision Tree and
Gradient Boosting Decision Tree (hereinafter
referred to as GBDT). According to the accuracy rate
of models, GBDT is finally used.
The dataset is divided into test set and training set
at 1:4 and trained by GBDT while ten indicators are
formed into the feature matrix Fi(i=1,2….10) of
each player and the average number of goals shotted
by each player serves as label. The GBDT model is a
cumulative model composed of multiple CART trees.
There are six main parameters that determine the
number, depth, and leaf nodes of the CART trees in
the model. The specific meaning and parameter
adjustment methods are as follows:
(1) learning_rate: the impact of each tree on the
cumulative model. Each new tree generated will have
an influence on the cumulative model and
learning_rate controls the magnitude of it.
(2) random_state : random number for every
generation.
(3) n_estimators:the total number of decision
trees used.
(4) min_samples_split:the least number of split
leaves for each node. If the number of split leaves is
too small, under-fitting may occur, or over-fitting
may occur.
(5) max_depth: the maximum depth of the tree is
defined. The deeper the tree, the easier it is to overfit.
(6) min_samples_leaf:the minimum number of
leaves required by the end node. This parameter is
used to prevent overfitting.
These six parameters are finally determined by
GridSearchCV as: learning_rate=0.4,
random_state=10, n_estimators=120,
min_samples_split=100, max_depth=5,
min_samples_leaf=2。
2.4 Players’ Passing Evaluation Model
When constructing the algorithm model, how to build
a universal evaluation system that can be used to
quantify the passing ability of the player is also one
of the focuses of this research.
icSPORTS 2021 - 9th International Conference on Sport Sciences Research and Technology Support
72
After a large amount of data trained in the GBDT
model, the weight W of each feature in the feature
matrix Fi can be obtained.
After obtaining the weight W of each feature, the
player’s score S(p) can be calculated by formula
(12): each value of the feature matrix Fi is multiplied
by W respectively, S(p) is a player’s total score in n
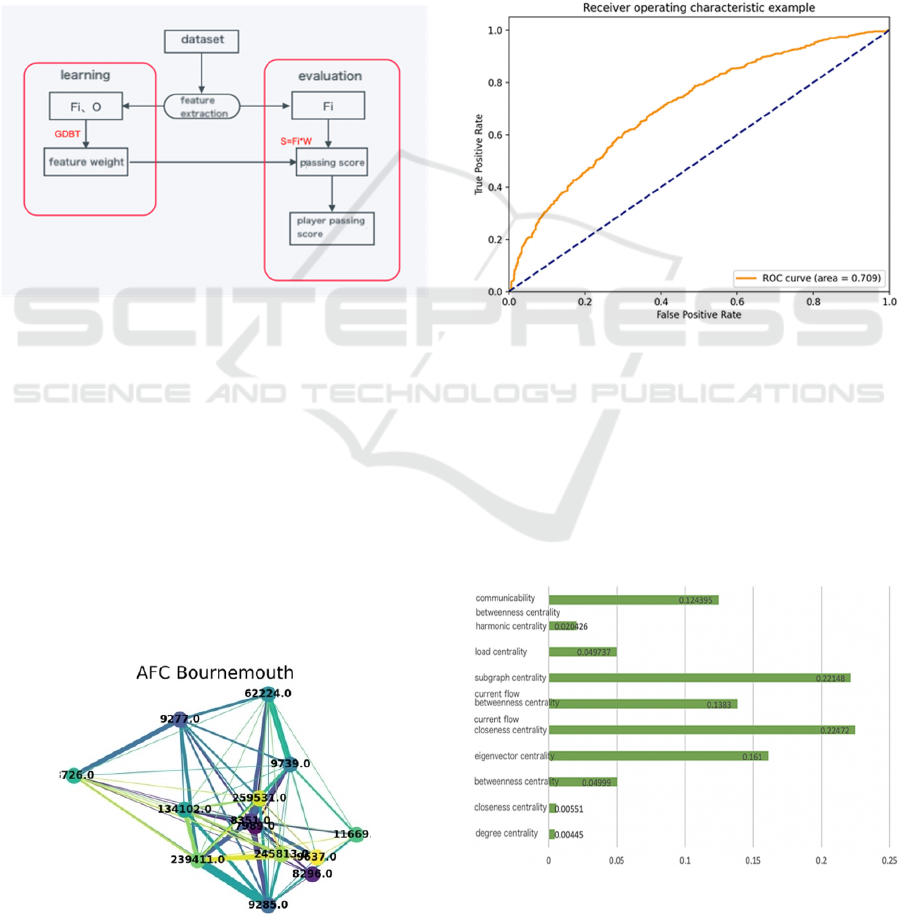
football games. Figure 1 shows the whole procedure
of building the passing evaluation model.
𝑆𝑝 w∗Fi
(12)
Figure 1: Framework of passing evaluation system(F
i
is
feature matrix,O is average goal of player).
3 RESULT AND ANALYSIS
3.1 Accuracy of Player-rank Prediction
Model
According to passing network analysis, the game
between Burnley and AFC Bournemouth can be
clearly illustrated in Figure 2 which shows passing
formation, passing routine and core player of AFC
Bournemouth.
Figure 2: AFC Bournemouth passing network.
As Figure 3 shows, the accuracy of model is
0.6298 while the value of AUC is 0.709. AUC is a
common index used to evaluate classification
algorithms whose value depends on the area under the
ROC curve. The ROC curve (receiver operating
characteristic curve) takes the true rate as the vertical
axis and the false positive rate as the horizontal axis.
When the AUC value is between 0.7 and 0.8, the
model can be considered as effective. the AUC value
of this model reached 0.7, indicating that the
prediction of GBDT using passing network indicators
as features is relatively valid.
Figure 3: ROC curve of player-rank prediction model.
3.2 Analysis of Players’ Passing
Evaluation Model
Figure 4 shows that the importance of different
features for the prediction result. Intuitively, several
indicators such as subgraph centrality, current flow
closeness centrality are relatively more important for
the prediction compared with degree centrality.
Figure 4: Weight of every feature.
Evaluating Player’s Passing Ability based on Passing Network
73
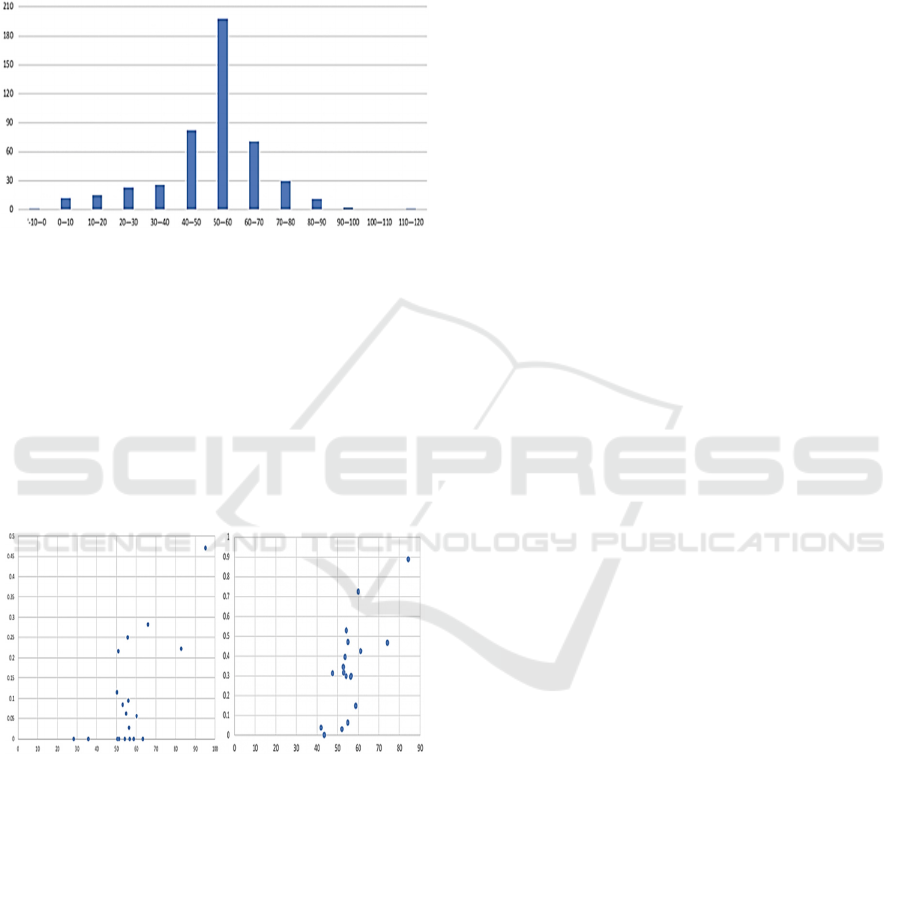
In the verification stage, the data of 472 players in
the 2017/18 Premier League are calculated using
formula (12). Figure 5 shows that the passing scores
of the players are mostly distributed normally and the
scores of most players are distributed in the range of
50-60 where have 198 players.
Figure 5: Histogram of player scoring passes.
In order to verify whether the passing scores are
an effective tool to evaluate the passing ability of
players, this paper calculates the correlation
coefficient of passing scores and actual shots of
Manchester city and 18 players in the FIFA top100
(only players whose date are in the dataset)
respectively. Figure 6 shows that the result is 0.6732
and 0.7314 which proves that the passing scores are
relatively valid in these two small samples.
Figure 6: Manchester City(left), 18 of FIFA top100 (the
abscissa is the average pass score, the ordinate is the
average number of goals).
However, it is found that the passing score and the
average goals do not show a high correlation on the
larger sample, which may relate to various factors
such as feature selection and formula design. More
methods can be tried in the future to build a passing
evaluation system that can accurately and quickly
quantify the passing ability of players.
4 LIMITATION AND FUTURE
WORK
Data and features determine the upper limit of
machine learning and all algorithms can do is to
approach this limit infinitely. In the future, in addition
to the steps of standardization and removal of outliers,
more detailed feature selection and design should be
carried out to diverge features and enhance the
relevance to the target.
More methods can be used to highlight the
importance of different features and comprehensively
describe the passing ability of players, according to
more literature and experts.
ACKNOWLEDGMENTS
This work was supported by the National Key R&D
Program of China (No. 2021YFF0307500).
REFERENCES
Lago-Peñas Carlos, Lago-Ballesteros Joaquín, Dellal
Alexandre, et al. (2010) Game-Related Statistics that
Discriminated Winning, Drawing and Losing Teams
from the Spanish Soccer League. 9(2):288-93.
Hou Huisheng et al (2013) Discussion and Analysis of the
Core Victory Technical and Tactical Indexes in
Football Matches. Journal of Beijing Sport University,
036(005):134-139.
Jie Chao et.al. (2016,) Analysis of the Core Technical
Indexes Affecting the Winning and Losing of the
Chinese Super League. Chinese School Sports (Higher
Education), 000(002): P.59-64.
Qu Xiaoguang. et. al (2001) Research on the Technical and
Tactical Characteristics of Chinese, American and
Norwegian Women's Football Teams. China Sports
Technology, 37(8):26 -29.
Alvin W. Wolfe. (1995) Social Network Analysis: Methods
and Applications. Contemporary Sociology, 91(435):
219-220.
Liu Jun. (2014) Overall network analysis UCINET
software user guide. Shanghai: Shanghai People's
Publishing House 8:129.
Clemente, F. M., Couceiro, M. S., et al. (2015,) Using
network metrics in soccer: A macro-analysis. Journal of
Human Kinetics. 45:123–134.
Clemente, F. M., Martins, F. M. L., et al. (2015.) General
network analysis of national soccer teams in FIFA
World Cup 2014. International Journal of Performance
Analysis in Sport, 15 (1), 80–96.
icSPORTS 2021 - 9th International Conference on Sport Sciences Research and Technology Support
74

Clemente, F. M., et al. (2014) Midfielder as the prominent
participant in the building attack: A network analysis of
national teams in FIFA World Cup International
Journal of Performance Analysis in Sport, 2015c, 15(2),
704–722.
Silva F G M, Nguyen Q T, Correia A F P P, et al. (2018)
Ultimate Performance Analysis Tool (uPATO):
Implementation of Network Measures Based on
Adjacency Matrices for Team Sports[M]. Springer
Peña, J. L., & Touchette, H. (2012). A network theory
analysis of football strategies. In: arXiv preprint arXiv.
p. 1206.6904.
Yu Q, Gai Y, Gong B, et al. (2020) Using passing network
measures to determine the performance difference
between foreign and domestic outfielder players in
Chinese Football Super League. International Journal
of Sports Science & Coaching, 15(3): 398-404.
Cao Xuewei et.al (2019) Research on the Influence of
Home and Away Games of Chinese Super League on
Team Performance Based on Complex Network
Method. Sports research, 40(004):22-28.
Clemente, Filipe Manuel, et al. (2014) Using network metrics
to investigate football team players' connections: A pilot
study." Motriz-revista De Educacao Fisica 20.3:262-271.
Grund, Thomas. (2012) Network structure and team
performance: The case of English Premier League
soccer teams, Social Networks 34.4 682-690.
Paul Power , Hector Ruiz, (2017) “Not all passes are
created”: Objectively measuring the risk and reward
passes in soccer from tracking data. KDD Applied Data
Science, 1605-1613
Joel Brooks, Matthew Kerr, and John Guttag. (2016.)
Developing a Data-Driven Player Ranking in Soccer
Using Predictive Model Weights. In Procs of the 22nd
ACM SIGKDD Intl Conf on Knowledge Discovery and
Data Mining. 49–55
Bransen, L., Van Haaren, J., & van de Velden, M. (2019)
Measuring soccer players’ contributions to chance
creation by valuing their passes. Journal of Quantitative
Analysis in Sports, Vol 12, 229-240
Luca Pappalardo, et al. (2019) PlayeRank: data-driven
performance evaluation and player ranking in soccer
via a machine learning approach. In arXiv preprint
arXiv. 1802.04987v3, https://arxiv.org/abs/1802.04987
Yuesen Li, et al (2020) Data-driven team ranking and match
performance analysis in Chinese Football Super League
chaos, solitons and fractals, 110- 141
Luca Pappalardo, et al. (2019) A public data set of spatio-
temporal match events in soccer competitions,
Scientific Data,1-15.
Evaluating Player’s Passing Ability based on Passing Network
75
