
Commercial Sentiment Analysis Solutions: A Comparative Study
Tatiana Ermakova
1,2,3 a
, Max Henke
4
and Benjamin Fabian
1,4,5,6 b
1
Weizenbaum Institute for the Networked Society, Hardenbergstraße 32, 10623 Berlin, Germany
2
Competence Center of Electronic Safety and Security Systems for the Public and Industries (ESPRI),
Fraunhofer Institute for Open Communication Systems (FOKUS), Kaiserin-Augusta-Allee 31, 10589 Berlin, Germany
3
Chair of Open Distributed Systems (ODS), Technical University of Berlin, Einsteinufer 25, 10587 Berlin, Germany
4
Hochschule für Telekommunikation Leipzig (HfTL), Gustav-Freytag-Straße 43-45, 04277 Leipzig, Germany
5
e-Government, Technical University of Applied Sciences Wildau (TH Wildau), Hochschulring 1, 15745 Wildau, Germany
6
Information Systems, Humboldt University of Berlin, Spandauer Str. 1, 10178 Berlin, Germany
Keywords: Sentiment Analysis, Machine Learning, Text Classification, Commercial Service, SaaS, Cloud Computing.
Abstract: Empirical insights into high-promising commercial sentiment analysis solutions that go beyond their vendors’
claims are rare. Moreover, due to ongoing advances in the field, earlier studies are far from reflecting the
current situation due to the constant evolution of the field. The present research aims to evaluate and compare
current solutions. Based on tweets on the airline service quality, we test the solutions of six vendors with
different market power, such as Amazon, Google, IBM, Microsoft, and Lexalytics, and MeaningCloud, and
report their measures of accuracy, precision, recall, (macro) F1, time performance, and service level
agreements (SLA). For positive and neutral classifications, none of the solutions showed precision of over
70%. For negative classifications, all of them demonstrate high precision of around 90%, however, only IBM
Watson NLU and Google Cloud Natural Language achieve recall of over 70% and thus can be seen as worth
considering for application scenarios where negative text detection is a major concern. Overall, our study
shows that an independent, critical experimental analysis of sentiment analysis services can provide
interesting insights into their general reliability and particular classification accuracy beyond marketing
claims to critically compare solutions based on real-world data and analyze potential weaknesses and margins
of error before making an investment.
1 INTRODUCTION
With the explosive growth of Web 2.0 applications
(e.g., social media platforms), an almost continuous
stream of digital, publicly available opinions is
regularly generated (Liu, 2015). Sentiment analysis
enables automated opinion recognition and polarity
classification (Wiegand et al., 2010). Taken together,
this offers organizations unprecedented opportunities
to support and improve decision-making processes
(Lau et al., 2012). Recent research shows that firms
can leverage user-generated content in the form of
sentiments to predict and/or explain various aspects
of their performance, such as sales (Hu & Tripathi,
2015; Jiang et al., 2021; Z. Lin & Goh, 2011), profits
(Ho et al., 2019), brand perception (Luo et al., 2017),
customer satisfaction and market performance (S.
a
https://orcid.org/0000-0003-0864-3302
b
https://orcid.org/0000-0002-9585-1814
Chung et al., 2017), and stock trade performance
(Kim et al., 2017).
Sentiment analysis technologies are quite
challenging for companies to select, develop and/or
integrate into their practices. Furthermore, training
promising deep learning models requires huge
amounts of rare data, training time, and resources,
i.e., GPU support and large memory. Moreover, deep
learning models in particular function like a black box
and are difficult to understand in their sentiment
predictions, while the choice of hyperparameters is
essential to their performance and remains a major
challenge (Yadav & Vishwakarma, 2020).
The cloud computing service paradigm enables
the provision of virtual machines, development tools,
and software on demand (Mell & Grance, 2011).
Several commercial “software as a service” (SaaS)
Ermakova, T., Henke, M. and Fabian, B.
Commercial Sentiment Analysis Solutions: A Comparative Study.
DOI: 10.5220/0010709400003058
In Proceedings of the 17th International Conference on Web Information Systems and Technologies (WEBIST 2021), pages 103-114
ISBN: 978-989-758-536-4; ISSN: 2184-3252
Copyright
c
2021 by SCITEPRESS – Science and Technology Publications, Lda. All rights reserved
103

solutions are also offered for sentiment analysis.
Though in 2020, a total of 112 deep learning-based
sentiment analysis papers were published (Ligthart et
al., 2021), empirical findings on the sentiment
services established in industry that go beyond the
claims of their providers are rather limited and, due to
the constant evolution of the field, are far from being
able to reflect the current situation after a few years
(Abbasi et al., 2014; Gao et al., 2015; Gonçalves et
al., 2013; Ribeiro et al., 2016; Serrano-Guerrero et al.,
2015), with the notable exceptions of (Carvalho &
Harris, 2020) and an investigation of ensemble
approaches based on such services (Carvalho & Xu,
2021).
With this motivation in mind, the goal of this
study is to evaluate and compare current commercial
SaaS solutions for sentiment analysis offered by
cloud providers with varying degrees of market
power, with respect to a wide range of established
classification performance measures such as
accuracy, precision, recall, and (macro) F1
(Giachanou & Crestani, 2016; Kowsari et al., 2019),
as well as usage characteristics such as time
performance and service level agreements (SLA) (as
of November 2020). In particular, we test services
from four major cloud platforms – IBM, Amazon,
Microsoft, and Google – that have been investigated
in recent studies in this area (Carvalho & Harris,
2020; Carvalho & Xu, 2021), as well as solutions
such as Lexalytics Semantria API (Gao et al., 2015;
Ribeiro et al., 2016), and MeaningCloud Sentiment
Analysis API, which, to our knowledge, still require
current and rigorous evaluation. We base on a real-
world Twitter data set of 14,640 records related to the
airline service quality, also used in a comparative
study of deep learning models in sentiment analysis
(Dang et al., 2020) and comparable to the data sets
used in other related studies (Carvalho & Harris,
2020; Carvalho & Xu, 2021).
The paper is structured as follows: An
introduction to the foundations of sentiment analysis
is given in Section 2, to prepare the background of our
experimental approach. Then, we present the earlier
research on industry cloud services for sentiment
analysis in Section 3. Next, in Section 4, we present
the experimental design, explicitly addressing the
dataset used, the sentiment analysis solutions studied,
and the implementations. Section 5 presents the
results. Finally, we summarize and discuss our
results, highlight limitations, and provide
recommendations for further research.
2 FOUNDATIONS
A sentiment can be defined as a triplet, (y, o, i), where
y describes the type of sentiment, o the orientation of
the sentiment, and i the intensity of the sentiment
(Liu, 2015). In its orientation (which is also often
called polarity, tonality, or semantic orientation), a
sentiment can be positive, negative, or neutral.
Neutrality usually means the absence of any
sentiment. Further, a sentiment can also differ in
intensity within the same sentiment polarity (e.g., the
use of perfect vs. good).
Sentiment polarity classification can be
accomplished at three levels in terms of granularity:
the document level, the sentence level, and the aspect
level (Yadollahi et al., 2017). At the document level
of sentiment analysis, the whole document is
considered as a single unit of analysis. The analysis at
the document level implicitly assumes that a
document expresses only one opinion about a single
entity (Liu, 2015) and, hence, can be too coarse for
practical use (Jiang et al., 2021).
At the sentence level, it is first checked whether a
sentence expresses opinion or only states facts
without implication. Aspect-level analysis focuses
directly on opinions and their target (Liu, 2015). For
instance, the frequency-based analysis method
searches for frequent nouns or compound nouns (POS
tags). An often-used rule of thumb says that when a
(compound) noun occurs in 1% or more sentences, it
can be considered as an aspect (Ligthart et al., 2021).
This level of sentiment analysis is highly valuable for
business owners and politicians interested in
aggregations of individual’s opinions regarding
specific features of their products or/and services,
where document- or sentence-level levels of
sentiment analysis do not suffice (Yadollahi et al.,
2017). In a recent study of dimension-specific
sentiment effects on product sales, for low-budget
movies, a positive relationship to movie sales was
found stronger for plot sentiment than to star
sentiment, whereas for high-budget movies, a
positive relationship to movie sales was found
stronger for star sentiment than to plot or genre
sentiment (Jiang et al., 2021).
The approaches used in sentiment analysis can be
grouped into three categories: (1) lexicon-based
approaches; (2) machine learning approaches
(Krouska et al., 2016; Troussas et al., 2013); (3)
hybrid approaches that couple the previous ones (G.
Li et al., 2020); and (4) graph-based approaches that
are based on the assumption that Twitter users
influence one another (Giachanou & Crestani, 2016;
Silva et al., 2016). Lexicon-based approaches in
WEBIST 2021 - 17th International Conference on Web Information Systems and Technologies
104

sentiment analysis make use of a sentiment lexicon to
estimate the overall sentiment polarity of a document
as the aggregation of the sentiment polarities of the
individual words within the document and, hence, do
not require labelled data. Lexicon-based approaches
can comprise (a) dictionary-based techniques, and (b)
corpus-based techniques.
Dictionary-based techniques leverage a sentiment
lexicon to tag terms with the sentiment polarity.
Commonly, a sentiment lexicon comprises words
labeled with a sentiment polarity and its strength
(Darwich et al., 2019), such as MPQA (Multi-
Perspective Question Answering) Subjectivity
Lexicon (Wilson et al., 2009), Bing Liu's Opinion
Lexicon, NRC Valence, Arousal, and Dominance
(VAD) lexicon (S. Mohammad, 2018b), NRC Word-
Emotion Association Lexicon (EmoLex) (S. M.
Mohammad & Turney, 2013), NRC Emotion/Affect
Intensity Lexicon (S. Mohammad, 2018a),
SentiWordNet (Baccianella et al., 2010), SenticNet
(Cambria & Hussain, 2015), WordNet-Affect
(Strapparava & Valitutti, 2004), General Inquirer, or
Linguistic Inquiry, and Word Count (LIWC), also
summarized and explained in prior works (Jurafsky &
Martin, 2008; Yadollahi et al., 2017).
Corpus-based techniques exploit co-occurrence
statistics or syntactic patterns in a text corpus and a
small set of paradigm positive and negative seed
words and generates a domain-, context-, or topic-
specific lexicon (Darwich et al., 2019). The semantic
orientation of the word can be assigned from the
measure of its association with a set of predefined
words with positive semantic orientation 𝑃𝑤𝑜𝑟𝑑𝑠=
{𝑔𝑜𝑜𝑑,𝑛𝑖𝑐𝑒,𝑒𝑥𝑐𝑒𝑙𝑙𝑒𝑛𝑡,𝑓𝑜𝑟𝑡𝑢𝑛𝑎𝑡𝑒} , minus the
measure of its association with a set of predefined
words with negative semantic orientation 𝑁𝑤𝑜𝑟𝑑𝑠=
{𝑏𝑎𝑑,𝑛𝑎𝑠𝑡𝑦,𝑝𝑜𝑜𝑟, 𝑢𝑛𝑓𝑜𝑟𝑡𝑢𝑛𝑎𝑡𝑒} (Turney &
Littman, 2003): 𝑆𝑂− 𝐴
(
𝑤𝑜𝑟𝑑
)
=
∑
𝐴
(
𝑤𝑜𝑟𝑑,𝑝𝑤𝑜𝑟𝑑
)
∈
−
∑
𝐴
(
𝑤𝑜𝑟𝑑,𝑛𝑤𝑜𝑟𝑑
)
∈
. When the value of
𝑆𝑂− 𝐴
(
𝑤𝑜𝑟𝑑
)
is positive, the word is marked with a
positive semantic orientation, and with a negative
semantic orientation otherwise. The higher the value
of 𝑆𝑂− 𝐴
(
𝑤𝑜𝑟𝑑
)
, the stronger the sentiment
strength of the word. The measure of the association
𝐴
(
𝑤𝑜𝑟𝑑
,𝑤𝑜𝑟𝑑
)
between 𝑤𝑜𝑟𝑑
and 𝑤𝑜𝑟𝑑
can
be exemplarily specified through the Pointwise
Mutual Information (PMI) as
𝑃𝑀𝐼
(
𝑤𝑜𝑟𝑑
,𝑤𝑜𝑟𝑑
)
=
𝑙𝑜𝑔
(
)
(
)
(
)
, where 𝑁 is the
number of documents. The numerator of the PMI
refers to the probability that 𝑤𝑜𝑟𝑑
and 𝑤𝑜𝑟𝑑
occur
together and are thus semantically similar, while the
denominator reflects the probability that these words
occur independently.
Machine learning approaches in sentiment
analysis make use of (a) traditional machine learning
models, or (b) deep learning models to estimate the
overall sentiment polarity of a document. Traditional
machine learning models are related to machine
learning techniques, such as the naïve Bayes
classifier, maximum entropy classifier, or support
vector machines (SVM). For traditional machine
learning models, features are specified and extracted
manually or by employing feature selection methods.
Semantic, syntactic, stylistic, and Twitter-specific
features can be used as the input to these algorithms
(Giachanou & Crestani, 2016). In deep learning
models, features are determined and extracted
automatically.
Deep neural network (DNN) models are neural
networks with multiple hidden layers. The most
widely used learning algorithm to train a deep neural
network model involves backpropagation based on
gradient descent. In the first round, the weights are
initialized on a random basis. Then, the weights are
tuned to minimize the prediction error relying on
gradient descent. The learning procedure consists of
multiple consecutive forward and backwards passes.
In the forward pass, the input is forwarded through
multiple nonlinear hidden layers and the computed
output is compared with the actual output. Let 𝑋
be
the input and 𝑓
be the nonlinear activation function
for layer i, then the output of the layer I, which is also
the input for layer
(
𝑖+1
)
, is given by 𝑋
=
𝑓
(
𝑊
𝑋
+𝑏
)
, where 𝑊
and 𝑏
are the parameters
between layers i and
(
𝑖−1
)
.
In the backward pass, the error derivatives with
respect to the parameters are then back propagated so
that the parameters can be adjusted to minimize the
prediction error: 𝑊
=𝑊− 𝜂 𝜕𝐸 𝜕𝑊
⁄
, and
𝑏
=𝑏− 𝜂𝜕𝐸 𝜕𝑏
⁄
, where 𝐸 is the cost function,
and 𝜂 is the learning rate. The overall process
continues until a desired prediction improvement is
reached (Sengupta et al., 2020).
In one of the recent surveys, the analysis of 32
papers identified DNN, CNN, and hybrid approaches
as the most common models for sentiment analysis
(Dang et al., 2020). In a total of 112 deep learning-
based sentiment analysis papers published in 2020,
the most applied deep learning algorithms were Long-
Short Term Memory (LSTM) (36%), Convolutional
Neural Networks (CNN) (33%), Gated Recurrent
Units (GRU) (9%), and Recurrent Neural Networks
(RNN) (8%) (Ligthart et al., 2021). When seen in
comparison, CNN outperformed other models, when
considering both accuracy and CPU runtime. RNN
Commercial Sentiment Analysis Solutions: A Comparative Study
105

performed slightly stronger than CNN in terms of
reliability most of the times but needed more
computational time (Dang et al., 2020). The deep
neural network architecture of CNN is commonly
composed of convolutional layers and pooling or
subsampling layers, where convolution layers extract
features, whereas pooling or subsampling layers
reduce their resolution. The deep neural network
architecture of RNN captures and reuses the previous
computations in the following inputs. Long short-
term memory (LSTM) is a special type of RNN,
which uses long memory as the input of activation
functions in the hidden layer (Dang et al., 2020).
3 RELATED WORK ON
SENTIMENT SERVICES
Prior comparisons of 15 free web services in terms of
their accuracy on different types of texts (Serrano-
Guerrero et al., 2015) and three solutions – Alchemy,
Text2data, and Semantria (Gao et al., 2015) – were
both completed in 2015. A comparison of 24
sentiment analysis methods based on 18 labeled
datasets followed in 2016, where several commercial
sentiment analysis methods were evaluated: LIWC
(2007 and 2015), Semantria, SenticNet 3.0,
Sentiment140, and SentiStrength (Ribeiro et al.,
2016). Before that, eight sentiment analysis methods
were compared in terms of coverage (i.e., the fraction
of messages whose sentiment is identified) and
agreement (i.e., the fraction of identified sentiments
that are in tune with ground truth) (Gonçalves et al.,
2013). 20 Twitter sentiment analysis solutions were
tested on five various data sets (Abbasi et al., 2014).
Independent and parallel studies to this research
compare the accuracy of these services by four major
cloud platforms – Amazon, Google, IBM, and
Microsoft – against the bag-of-words approach
(Carvalho & Harris, 2020), and investigate the use of
ensemble approaches based on the sentiment analysis
services (Carvalho & Xu, 2021). To the best of our
knowledge, there are no further studies comparing
recent evolutions and novel implementations of all
such commercial services across a wide range of
well-established metrics, even though they are
heavily used in countless practical data science
applications in industry.
1
https://www.kaggle.com/crowdflower/twitter-airline-sentiment
4 EXPERIMENTAL DESIGN
4.1 Dataset
We base on a real-world Twitter data set of 14,640
records related to the airline service quality retrieved
from the publicly accessible kaggle.com platform
1
,
also used in a comparative study of deep learning
models in sentiment analysis (Dang et al., 2020) and
comparable to the data sets used in other related
studies (Carvalho & Harris, 2020; Carvalho & Xu,
2021). Twitter data sets have been widely used in
different sentiment analysis studies before (Bachura
et al., 2017; W. Chung et al., 2015; Ho et al., 2019;
Krouska et al., 2016; Li & Chong, 2019; Ribeiro et
al., 2016; Zhang & Lau, 2013). Tweets about service
quality can provide valuable insights about consumer
satisfaction and can be thus effective to infer firms’
future earnings (Ho et al., 2019), their directional
stock price movements (Zhang & Lau, 2013), etc.
Airlines are interested in using social media to
establish online communities und involve their
members into co-creating new solutions (Jarvenpaa &
Tuunainen, 2013), however, hardly manage to
respond even half of the tweets, as a relatively recent
analysis of over three million complaining tweets
related to seven major U.S. airlines on Twitter in the
time period from September 2014 to May 2015
demonstrated (Gunarathne et al., 2014).
Nevertheless, the sentimental orientation of
tweets requires special attention. Indeed, negative
tweets enable more accurate forecasts than do
positive tweets (Ho et al., 2019). Neutral tweets are
perceived as more helpful (Salehan & Kim, 2014),
lead to more neutral feedback (Deng & Khern-am-
nuai, 2019), and also tend also to be more retweeted
(Bachura et al., 2017). Sentimental reviews with
positive sentiment polarity in their title receive more
readership (Salehan & Kim, 2014). Sentiment-driven
positive feedback generally leads to a superior level
of online trust (Grigore & Rosenkranz, 2011),
knowledge reuse (Grigore et al., 2015), willingness to
share (Y.-W. Lin et al., 2019), and has substantial and
sustainable impact (Beduè et al., 2020).
The chosen data set included attributes such as
tweet ID, text (written in English; min: 12; mean:
104; std. dev.: 36; median: 114; max: 186 characters),
airline (the six largest U.S. airlines, i.e., United: 26%;
US Airways: 20%; American: 19%; Southwest: 17%;
Delta: 15%; Virgin America: 3%), polarity label
(manually evaluated, i.e., positive: 16%, negative:
63%, neutral: 21%), confidence value for label
WEBIST 2021 - 17th International Conference on Web Information Systems and Technologies
106

(mean: 0.90; std. dev.: 0.16), and publication date (the
period from February 16 to February 24, 2015). When
preparing the data set, the empty entries of each row
were pre-processed for storage in the database.
Afterwards, duplicates were removed based on the
column of the tweet ID, the unique identifier of
Twitter, what resulted in 14,639 left records. We
further sorted out tweets that were annotated by
humans with a confidence value of less than 0.65,
annotated with the given class by almost more than
two thirds of the human classifiers. The final data set
of 13,633 records consisted of 16% positive, 64%
negative, 20% neutral tweets.
4.2 Commercial Sentiment Analysis
Solutions
The market for commercial software for sentiment
analysis comprises many providers of different sizes.
Our initial screening revealed such as Amazon Web
Services Amazon Comprehend
2
, Dandelion
Sentiment Analysis API
3
, Google Cloud Platform
Natural Language API
4
, IBM Watson Natural
Language Understanding
5
, Lexalytics Semantria
API
6
, MeaningCloud Sentiment Analysis API
7
,
Microsoft Azure Text Analytics
8
, ParallelDots
Sentiment Analysis
9
, Repustate Sentiment Analysis
10
,
Text2data Sentiment Analysis API
11
, TheySay
PreCeive API
12
, and twinword Sentiment Analysis
API
13
. Some sentiment analysis solutions such as
AWS Amazon Comprehend, Google Cloud Platform
Natural Language API, and Microsoft Azure Text
Analytics (Carvalho & Harris, 2020; Carvalho & Xu,
2021), IBM Natural Language Understanding (NLU)
(Carvalho et al., 2019; Carvalho & Harris, 2020;
Carvalho & Xu, 2021), Lexalytics Semantria API
(Gao et al., 2015; Ribeiro et al., 2016), and Text2data
(Gao et al., 2015) were part of previous examinations.
Due to the focus of this work on commercial
software, we first checked whether the solutions are
chargeable. To enable this evaluation, we concentrated
only on those ones which offered a free trial version
with sufficiently large contingent available. If no free
contingent was offered or the volume of data sets
exceeded the free contingent of a service, the total costs
for a solution not exceeding the limit of 10 euros were
2
https://aws.amazon.com/de/comprehend/
3
https://dandelion.eu/
4
https://cloud.google.com/natural-language
5
https://www.ibm.com/de-de/cloud/watson-natural-language-
understanding
6
https://www.lexalytics.com/semantria
7
https://www.meaningcloud.com/products/sentiment-analysis
still accepted. Hence, the products of ParallelDots,
Repustate, Text2data, Twinword and TheySay were
excluded from further examination in this study. We
further excluded Dandelion since this solution only
offers document-level analysis depth and, compared to
Amazon Comprehend which also only provides
sentiment analysis at the document level, does not
enjoy higher visibility.
All solutions enable classification of sentiment
based on own data sets and did not require
configuration or training of models. Further, they also
provided a REST-compliant programming interface.
This ensures that a company can integrate the product
as easily as possible into its own applications. The
programming interface can be operated by the provider
in the cloud, thus a separate infrastructure at the
customer's site is not required. The functionality of the
product, including the REST interface or client
libraries, was well documented in a publicly accessible
manner. The solutions also enable communication via
the encrypted HTTPS protocol, so that companies can
also process personal or otherwise sensitive data.
4.3 Implementation
After selecting the six solutions specified above –
Amazon Web Services (AWS) Amazon
Comprehend, Google Cloud Platform Natural
Language API, IBM Watson Natural Language
Understanding (NLU), Microsoft Azure Text
Analytics, Lexalytics Semantria API, and
MeaningCloud Sentiment Analysis API – an analysis
framework in Python was designed and implemented.
First, a user account was created with each of the
corresponding SaaS providers.
To store the JSON-like nested responses of the
APIs, a document-oriented NoSQL MongoDB
database was set up and hosted at the MongoDB Atlas
cloud provider. For all database functionality, the
class DB_Manager based on the library pymongo
was implemented, which establishes a connection to
the database upon initialization and performs the
necessary database queries to read, save and modify
data. For each of the sentiment analysis solutions, the
functionality was implemented in separate modules
using the client libraries. Each module contained, if
8
https://azure.microsoft.com/de-de/services/cognitive-services/
text-analytics/
9
https://www.paralleldots.com/sentiment-analysis
10
https://www.repustate.com/sentiment-analysis/
11
https://text2data.com/sentiment-analysis-api
12
http://www.theysay.io/product/preceive/
13
https://www.twinword.com/api/
Commercial Sentiment Analysis Solutions: A Comparative Study
107
required, an authentication and configuration of the
service client, and the get_sentiment method to
request the individual service, get its response, and
extract from the response object the information
needed.
A class Benchmark was implemented, which
provides all logic for requesting the individual
services, measuring the response time, and assigning
the individual results to the data set by means of static
methods. The data set to be processed was made
available in the form of an object of the Tweet class.
When being passed to the get_sentiment method
from the respective module, the response time was
measured, and the result was assigned to the Tweet
object. In the Benchmark module, the
get_tweet_sentiment method also provided
the possibility to perform one query per service for
each tweet. This is then called for each tweet and
stores the result in the database after receiving each
response from a service along with the response time.
However, a request is only made for those
services for which there is not already a response in
the Tweet object, for example from a previous
execution of the script. In the Tweet object and thus
also in the database, the complete response is stored
with its respective nested structure. Even though
some providers also allow batch processing of a
query, only one text per query will be analyzed here
for reasons of comparability of response times.
For all solutions with the synchronous
programming interfaces, i.e., all except for Lexalytics
Semantria API, sequential processing of each
document was implemented. To shorten the
turnaround time, parallel processing of multiple
documents was further implemented using
multiprocessing. However, since this also requires the
pymongo client instance to be reinitialized for each
process, as pymongo is not fork-safe, the maximum
number of parallel processes was limited to four.
In case of the Lexalytics Semantria API,
asynchronous processing of the test data had to be
performed. In the Benchmark module, the
lexalytics_queue_tweets method adds
batches of five tweets to the Semantria API queue.
The batch size was set to five records for two
reasons: On the one hand, the processing time should
be as close as possible to the time needed for one
record to make the results comparable between the
services. On the other hand, during tests, it was found
that the time needed to receive the processed record
is almost identical for a batch size of one compared to
a batch size of five. Since this thread does not block
the program flow, a polling thread can be started
directly with the lexalytics_polling method.
The lexalytics_polling method polls the API for new
processed documents using four threads and at
random intervals between 0 and 100 milliseconds
until all documents added to the queue have been
processed. If one or more batches have been returned
in a polling request, these are processed further in
batches of a maximum of 20 documents. This
processing is done in separate threads – so as not to
block the polling method – and includes calculating
the response time and storing the results in the
database. For comparability of the solutions, the batch
size was reduced.
The results of the individual solutions were
compared with the polarity labels of the annotated
data sets (see Table 1). For IBM Watson NLU and
Lexalytics Semantria, the same classes as in the test
data were used. For MeaningCloud, the labels for
normal and strong positive and negative polarity were
combined into positive and negative. In addition, the
absence of sentiment (NONE) and a mixed sentiment
(NEW) were aggregated into the class neutral.
For Amazon and Azure, mixed sentiment was also
translated into the neutral polarity class, when there is
no tendency for the class to be positive or negative.
With Google, numerical values had to be translated
into polarity classes. The class boundaries for the
neutral class, which separates the positive from the
negative class, were chosen as -0.25 and +0.25, as
recommended in the product demonstration.
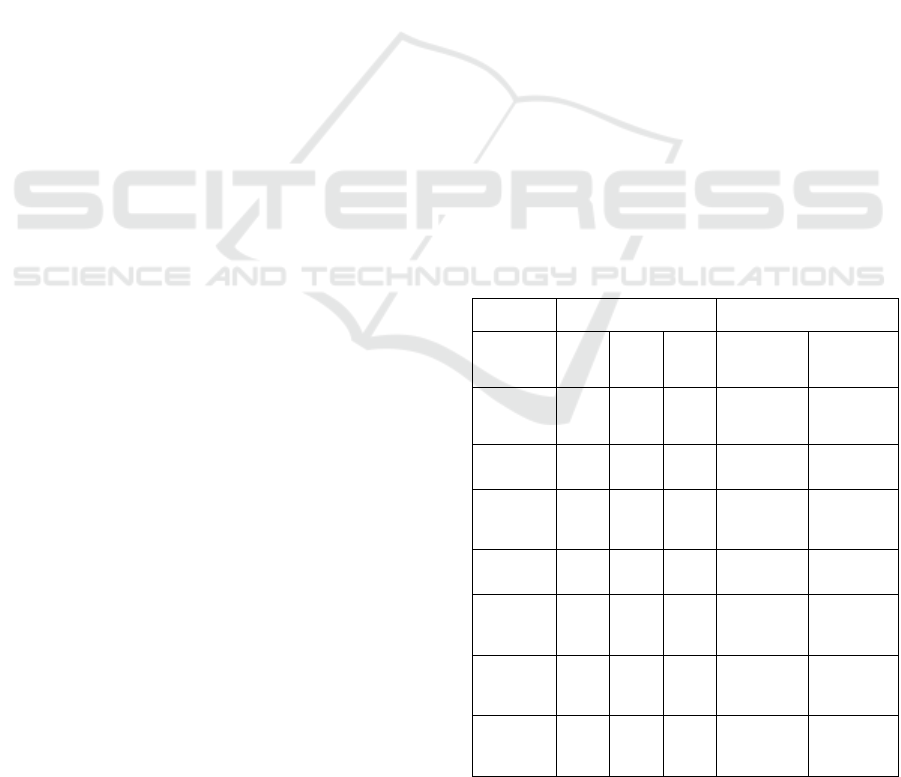
Table 1: Experimental settings.
Target Class Version Used
Sentiment
Analysis
Solution
Positive Positive Neutral API Client Library
Sentiment
Analysis
Solution
positive positive neutral
Amazon
Comprehend
Positive Positive Neutral,
Mixed
September 28,
2020
1.16.1
BOTO3.
Google Cloud
Natural
Language
(0.25, 1] (0.25, 1] [-0.25,
0.25]
1.2
(March 20,
2020)
2.0.0
{ "google-cloud-
language".)
IBM Watson
NLU
positive positive neutral 2020-08-01 4.7.1
(ibm-watson)
Microsoft
Azure Text
Analytics
positive positive
neutral,
mixed
3.0 5.0.0
{ "azure-ai-text
analytics".)
Lexalytics
Semantria API
positive positive neutral 4.2
(6-4-2016)
4.2.92
{ "semantria-
sdk".)
MeaningCloud
Sentiment
Analysis API
P+, P P+, P NEW,
NONE
2.1
(10/September/
2020)
2.0.0
(MeaningCloud
-python)
WEBIST 2021 - 17th International Conference on Web Information Systems and Technologies
108
5 RESULTS
Sentiment analysis solutions were evaluated in terms
of well-established measures such as accuracy,
precision, recall, (macro) F-score, calculated as
𝑝𝑟𝑒𝑐𝑖𝑠𝑖𝑜𝑛=
, 𝑟𝑒𝑐𝑎𝑙𝑙 =
, and 𝐹1=
(Giachanou & Crestani, 2016; Kowsari et al., 2019),
as well as time performance, and SLAs.
With around 79% correctly classified samples,
Watson NLU is the most accurate solution among the
services tested (see Table 2 and Figure 1). Only the
service from Google Cloud is closely behind it, with
73.4% accurate classifications. Lexalytics Semantria
API and MeaningCloud Sentiment Analysis API are
the least accurate solutions, each classifying just
slightly over half of the texts correctly – 51.8% and
52.6%, respectively.
For negative samples, all tested solutions
demonstrated rather high precision. The values range
from 94.4% (Amazon Comprehend) to 87.1% (IBM
Watson NLU). A more differentiated picture emerges
for the recall. With 88%, IBM Watson NLU has the
highest recall. Only Google Cloud Natural Language
can also provide comparably high coverage with a
recall of around 77%. The services by AWS and
Microsoft Azure stayed behind these solutions with
recalls of 61.4% and 57.7%, respectively. Lexalytics
and MeaningCloud Sentiment Analysis API did not
even reach 50% recall. IBM Watson NLU achieved
the best result among all solutions, with an F1 score
of 87.5%. Only Google Cloud Natural Language
could show a similarly high F1 score of 83%. The
middle field consists of AWS and Azure, with F1
scores of less than 75%. Lexalytics Semantria API
and MeaningCloud Sentiment Analysis API are the
least reliable solutions here.
For the positive samples, the solutions by AWS,
Google, IBM are the most precise solutions here,
although, with under-70% precision. With Microsoft
Azure Text Analytics and Lexalytics Semantria API,
only every second positive classification was correct.
MeaningCloud Sentiment Analysis API performed
worst with a precision of only about 36%.
Nevertheless, almost all solutions correctly identified
a similarly high proportion of texts as positive, with a
recall of between 89% (Google Cloud Natural
Language) and 82% (Microsoft Azure Text
Analytics). With 52% recall, only Lexalytics
Semantria API correctly classified just half of all
positive texts. As for F1 score, Amazon Comprehend
provides the best result with 76.9%, closely followed
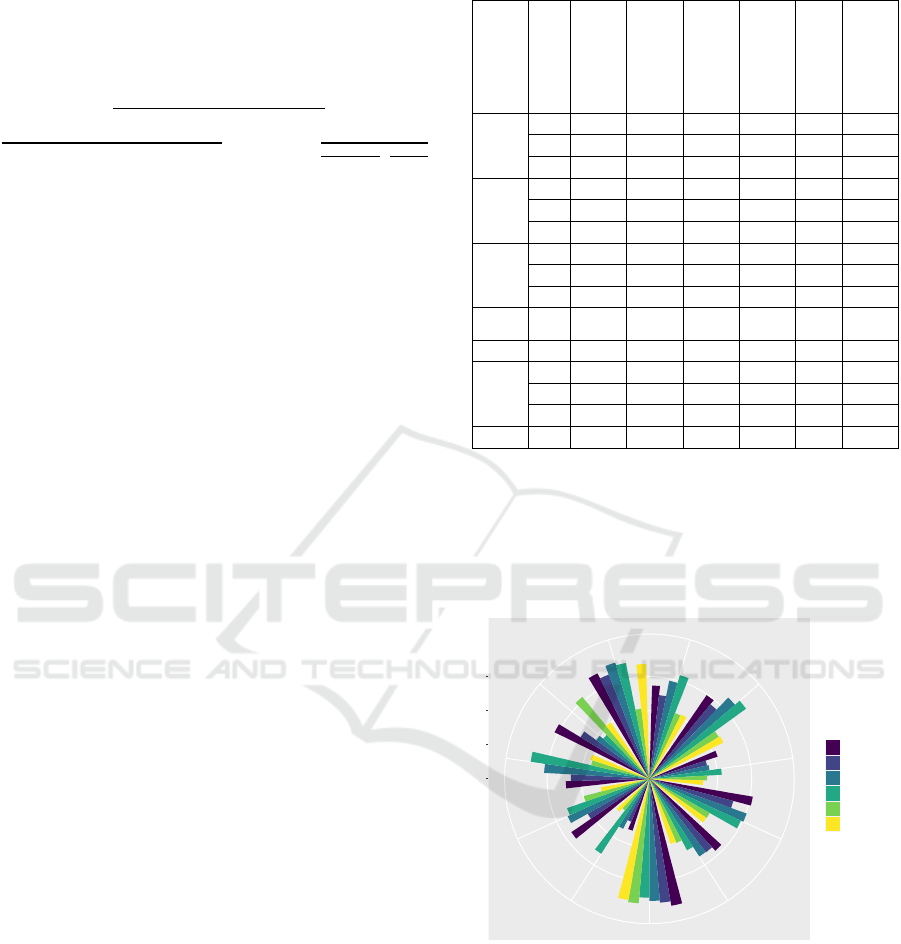
Table 2: Experimental results.
Amazon Comprehend
Google Cloud Natural
Language
IBM Watson NLU
Microsoft Azure Text
Analytics
Lexalytics Semantria
API
MeaningCloud
Sentiment Analysis
API
Precision, %
positive
69.3 65.9 64.1 51.9 49.8 36.2
neutral
39.9 41.4 65.3 34.2 29.2 32.5
negative
94.4 89.5 87.1 91.1 91.6 90.1
Recall, %
positive
86.2 88.8 86.7 82 51.8 84.3
neutral
77.4 48.2 44.9 59 77.6 50.3
negative
61.4 77.3 87.9 57.7 43.9 45.5
F1 score, %
positive
76.9 75.7 73.7 63.6 50.8 50.6
neutral
52.6 44.5 53.2 43.3 42.4 39.5
negative
74.4 83 87.5 70.7 59.4 60.4
Macro F1
score, %
68 67.7 71.5 59.2 50.9 50.2
Accuracy, %
68.5 73.4 79.2 61.8 51.8 52.6
Response
times,
milliseconds
Mean
194 299 253 151 1321 1244
Median
165 194 243 139 1296 1200
Std. Dev.
127 210 75 62 226 500
SLA, %
99.9131-99.9 99.9133-99.9 99.5134-99.9 99.9132-99.9 99.995 99.9136-99.9
by the solutions from Google and IBM with 75.7%
and 73.7%, respectively. In the middle field,
Microsoft Azure Text Analytics is behind with 63.6
%, whereas Lexalytics Semantria API and
MeaningCloud Sentiment Analysis API complete the
list with an F1 score of just over 50 %.
Figure 1: Selected experimental results (polar coordinates).
As for the neutral class, all solutions except IBM
Watson NLU (65%) showed low precision values of
under around 40%. The worst precision of only 29%
was shown by Lexalytics Semantria API. With
respect to recall, only the services by AWS and
Lexalytics achieved high coverage with around 77%.
The next best result was shown by Microsoft Azure
Text Analytics with 59% recall. The remaining
solutions have a recall of about 50% and below. As
A
c
c
u
r
a
c
y
F
1
_
N
e
g
a
t
i
v
e
F
1
_
N
e
u
t
r
a
l
F
1
_
P
o
s
i
t
i
v
e
M
a
c
r
o_
F
1
Precision_Negative
P
r
e
c
i
s
i
o
n_
N
e
u
tr
a
l
P
r
e
c
i
s
i
o
n
_
P
o
s
i
t
i
v
e
R
e
c
a
l
l
_
N
e
g
a
ti
v
e
R
e
c
a
l
l
_
N
e
u
t
r
a
l
R
e
c
a
l
l
_
P
o
s
i
t
i
v
e
0
25
50
75
Solution
Amazon
Azure
Google
IBM
Lexalytics
MeaningCloud
Commercial Sentiment Analysis Solutions: A Comparative Study
109

for F1 score, only AWS and IBM achieved an F1
score of just over 50%. MeaningCloud Sentiment
Analysis API stays under 40%.
While it took an average of over 1200
milliseconds to receive a response from the solution,
each of the major cloud providers only required an
average response time of under 300 milliseconds,
with Microsoft Azure Text Analytics being the fastest
solution in this study and with Lexalytics Semantria
API being the slowest. Nevertheless, one should keep
in mind that Lexalytics Semantria API offers an
asynchronous programming interface and therefore
requires two requests until the results of an analysis
are received. Since many factors influence the
response time of the API, including the Internet
connection and proximity to the server location, the
evaluation of this criterion shows only a preliminary
picture and is not necessarily representative.
However, due to the large number of requests, the
measurements of the individual solutions can be
compared with each other, since they were all created
under similar conditions. Therefore, the response
time is only considered in relation to the other
solutions and should not be considered as an absolute
value.
Not least, the availability of IT systems and
services is often contractually regulated in service
level agreements (SLA) The agreed operating time is
usually specified as a percentage and expresses the
proportion of a period during which a system should
be available. Moreover, if external services are used
as building blocks for more advanced solutions, an
analysis of weakest links and mitigation of potentially
cascading failures should be conducted. In case of
IBM Watson NLU, the (relatively) low uptime of
99.5134% is contractually guaranteed to customers of
the Standard tariff. This indicates that the solution
could be down for almost 44 hours in a year without
contractual regulations taking effect. Only from the
Premium tariff onwards a higher monthly uptime of
99.9% is agreed in the SLAs. Customers of the
products from Amazon (99.9131%), Google
(99.9133%), Microsoft Azure (99.9132%), and
MeaningCloud (99.9136%) must be willing to accept
around nine hours of downtime per year, with an
agreed uptime of 99.9%. Lexalytics Semantria API
promises an even higher monthly uptime of at least
99.995% at the time of this study.
6 DISCUSSION
Watson NLU achieved the highest value of accuracy
with 79%, only closely followed by Google Cloud
Natural Language with 73%. Lexalytics Semantria
API and MeaningCloud Sentiment Analysis API
classified just slightly over half of the texts correctly
– 52% and 53%, respectively, what is only slightly
more accurate than guessing. Our results are in line
with prior measurements on a comparable data set
(Carvalho & Harris, 2020), namely Amazon
Comprehend: 68.5% (overall: 72.7%, negative:
66.8%, neutral: 81.7%, positive: 92.2%); Google
Cloud Natural Language: 73.4% (overall: 74.1%,
negative: 77.7%, neutral: 39.4%, positive: 91.8%);
IBM Watson NLU: 79.2% (overall: 85.4%, negative:
91.2%, neutral: 52.0%, positive: 90.8%); Microsoft
Azure Text Analytics: 61.8% (overall: 66.2%,
negative: 68.6%, neutral: 31.3%, positive: 90.3%).
On the one hand, the results may indicate the presence
of still unresolved challenges in the technology of
sentiment analysis such as linguistic complications
(Do et al., 2019; Minaee et al., 2019), in case of social
media contents also potential use of non-standard
language (e.g., abbreviations, misspellings,
emoticons or multiple languages) (Fan et al., 2015;
Silva et al., 2016). Nevertheless, the researchers
training different deep learning models on the same
dataset, however, with only on two classes – positive
and negative (Dang et al., 2020) – could achieve
much higher accuracies: based on TF-IDF DNN:
86%, CNN: 85%, and RNN: 83%; based on word
embeddings DNN: 90%, CNN: 90%, and RNN: 90%.
For positive and neutral classifications, none of
the solutions could achieve a precision value of over
70%. For negative classifications, however, the
results looked more favourable: Amazon
Comprehend: 94%, Lexalytics Semantria API: 92%,
Microsoft Azure Text Analytics: 91%, Google Cloud
Natural Language: 90%, MeaningCloud Sentiment
Analysis API: 90%, and IBM Watson NLU: 87%.
The researchers training various deep learning
models on the same dataset reduced to positive and
negative classes (Dang et al., 2020), reported
comparable precisions as follows: based on TF-IDF
DNN: 88%, CNN: 86%, and RNN: 84%; based on
word embeddings DNN: 92%, CNN: 92%, and RNN:
93%.
All solutions except for Lexalytics Semantria API
showed high recalls for positive classifications, with
82% and higher. For neutral classifications, only
AWS and Lexalytics achieved high recalls of around
77%. Watson NLU achieved the highest value of
recall for negative classifications with 88%, only
closely followed by Google Cloud Natural Language
with 77%. The researchers training different deep
learning models on the same dataset with positive and
negative classes (Dang et al., 2020), achieved much
WEBIST 2021 - 17th International Conference on Web Information Systems and Technologies
110

more higher recalls: based on TF-IDF DNN: 96%,
CNN: 97%, and RNN: 97%; based on word
embedding DNN: 96%, CNN: 96%, and RNN: 95%.
Compared to prior studies, Lexalytics Semantria
API demonstrated quite mixed results, i.e., slightly
lower, but still comparable accuracy of 51.8%
(58.39% (Gao et al., 2015), and 61.54%, 68.89%
(Ribeiro et al., 2016)), rather strong precision of
91.6% (96.09% (Gao et al., 2015), and 39.57%,
49.82% (Ribeiro et al., 2016)) and recall of 43.9%
(37.31% (Gao et al., 2015), and 52.81%, 55.53%
(Ribeiro et al., 2016)) for negative classifications,
rather weak precision of 49.8% (81.91% (Gao et al.,
2015), and 67.28%, 48.86% (Ribeiro et al., 2016))
and recall of 51.8% (82.23% (Gao et al., 2015), and
57.35%, 63.73% (Ribeiro et al., 2016))) for positive
classifications, rather weak precision of 29.2%
(4.34% (Gao et al., 2015), and 65.98%, 82.02%
(Ribeiro et al., 2016)) and rather strong recall of
77.6% (43.28% (Gao et al., 2015), and 67.03%,
72.96% (Ribeiro et al., 2016)) for neutral
classifications.
Across all compared services, no solution could
achieve an F1 score of more than 80% for all classes.
In terms of the F metric, all models trained on the two
class dataset were more reliable (Dang et al., 2020):
based on TF-IDF DNN: 92%, CNN: 91%, and RNN:
90%; based on word embedding DNN: 94%, CNN:
94%, and RNN: 94%.
As for time performance, the major cloud
providers required an average response time of under
300 milliseconds, with Microsoft Azure Text
Analytics being the fastest solution: Amazon
Comprehend: 0.194 s, Google Cloud Natural
Language: 0.299 s, IBM Watson NLU: 0.253 s,
Microsoft Azure Text Analytics: 0.151 s, Lexalytics
Semantria API: 1.321 s, and MeaningCloud
Sentiment Analysis API: 1.244 s. The response time
of a solution can depend on a variety of factors, e.g.,
the distance and the routing to the used server of a
programming interface, the bandwidth of the Internet
connection. In the present study, however, they do not
seem to explain the variety in time performance. Both
Lexalytics and MeaningCloud do not allow selection
of server locations and do not seem to offer servers
outside the US. AWS also enables access only to the
region "us-east-1" in the USA in its academic version,
however, its solution is one of the best performing
solutions in this study. The higher average response
time for Lexalytics may also be due to the way it
functions as an asynchronous interface. The
previously mentioned experiments took longer
computational time: based on TF-IDF DNN: 1 min,
CNN: 34.41 s, and RNN: 1 h 54 s; based on word
embeddings DNN: 30.66 s, CNN: 1 min 22 s, and
RNN: 2 min 41 s (Dang et al., 2020).
IBM Watson NLU and Google Cloud Natural
Language achieved the highest recalls for negative
classifications of 88% and 77% and the highest F1
scores of 88% and 83%, respectively, and thus can be
preferred where correct classification of negative
texts is the primary concern. Indeed, negative tweets
enable more accurate forecasts than do positive
tweets (Ho et al., 2019). Moreover, social media and
review websites are generally prone to strategically
driven abuse and manipulation such as opinion spam
and fake reviews (Lee et al., 2014). Further potential
strategy to mitigate the variability in reliability is to
build ensemble models (Carvalho & Xu, 2021).
Our research contains some limitations and could
be continued in several dimensions to mitigate them:
first, additional and heterogeneous data sets could be
analysed with the selected services to provide results
also for other text corpora and other languages than
English (Dang et al., 2020; Habimana et al., 2019;
Yadollahi et al., 2017). Second, the set of selected
sentiment analysis services could be extended for
even broader market coverage, and other solutions
that do not fit the current selection criteria (Geske et
al., 2021), due to the focus of the present study on
commercial services, can be considered, such as
Dandelion, ParallelDots, Repustate, Text2data,
TheySay, and twinword. The reasons for the
differences should also be investigated. Indeed,
experiments demonstrate that higher sentiment
classification accuracies can be achieved by selecting
appropriate features and representations (Dang et al.,
2020; Krouska et al., 2016). The study by Gao et al.
(Gao et al., 2015) reports that the time efficiency of
Text2data is too low for these purposes. Third, this
study only represents the development status of the
solutions in November of 2020 and can be updated in
the future, since the reliability of the solutions may
change. Software scripts developed for this study,
which build a modular open source software
framework, that flexibly supports such analyses could
further be developed to allow easy extension with
new data sets and further sentiment analysis services
to support informed service selection. Fourth, further
criteria for the assessment of these solutions can be
also consulted as well. For example, considering
250,000 texts to be examined, the use of sentiment
recognition costs more than 2.5 times as much at IBM
as at Google ($660 versus $249.5).
Furthermore, the offering and quality of further
text analysis functions, e.g., availability and/or
speech recognition, can also be considered. All
solutions support at least ten different languages for
Commercial Sentiment Analysis Solutions: A Comparative Study
111

sentiment recognition. However, not all of them
detect the language automatically.
7 CONCLUSION
In this paper, current commercial SaaS solutions for
sentiment analysis of different market power were
investigated and compared. The results show that the
IBM Watson NLU and Google Cloud Natural
Language solutions can be preferred when the
detection of negative texts is the focus. In other cases,
all solutions might have some weaknesses, in
particular, Lexalytics Semantria API and
MeaningCloud Sentiment Analysis API. Overall, our
study shows that an independent, critical
experimental analysis of sentiment analysis services
can provide interesting insights into their general
reliability and particular accuracy of classification
beyond marketing statements, and to critically
compare solutions based on actual data and analyze
potential shortcomings and margins of error before
investing.
REFERENCES
Abbasi, A., Hassan, A., & Dhar, M. (2014). Benchmarking
Twitter Sentiment Analysis Tools. Proceedings of the
Ninth International Conference on Language
Resources and Evaluation (LREC’14), 823–829.
http://www.lrec-conf.org/proceedings/lrec2014/pdf/
483_Paper.pdf
Baccianella, S., Esuli, A., & Sebastiani, F. (2010, May).
SentiWordNet 3.0: An Enhanced Lexical Resource for
Sentiment Analysis and Opinion Mining. Proceedings
of the Seventh International Conference on Language
Resources and Evaluation (LREC’10). LREC 2010,
Valletta, Malta. http://www.lrec-conf.org/proceedings/
lrec2010/pdf/769_Paper.pdf
Bachura, E., Valecha, R., Chen, R., & Rao, H. R. (2017).
Data Breaches and the Individual: An Exploratory
Study of the OPM Hack. ICIS 2017 Proceedings.
https://aisel.aisnet.org/icis2017/HumanBehavior/Prese
ntations/26
Beduè, P., Förster, M., Klier, M., & Zepf, K. (2020).
Getting to the Heart of Groups – Analyzing Social
Support and Sentiment in Online Peer Groups. ICIS
2020 Proceedings. https://aisel.aisnet.org/icis2020/
social_media/social_media/11
Cambria, E., & Hussain, A. (2015). SenticNet. In E.
Cambria & A. Hussain (Eds.), Sentic Computing: A
Common-Sense-Based Framework for Concept-Level
Sentiment Analysis (pp. 23–71). Springer International
Publishing. https://doi.org/10.1007/978-3-319-23654-
4_2
Carvalho, A., & Harris, L. (2020). Off-the-Shelf
Technologies for Sentiment Analysis of Social Media
Data: Two Empirical Studies. AMCIS 2020
Proceedings. https://aisel.aisnet.org/amcis2020/social_
computing/social_computing/6
Carvalho, A., Levitt, A., Levitt, S., Khaddam, E., &
Benamati, J. (2019). Off-The-Shelf Artificial
Intelligence Technologies for Sentiment and Emotion
Analysis: A Tutorial on Using IBM Natural Language
Processing. Communications of the Association for
Information Systems, 44(1). https://doi.org/10.17705/
1CAIS.04443
Carvalho, A., & Xu, J. (2021). Studies on the Accuracy of
Ensembles of Cloud-Based Technologies for Sentiment
Analysis. AMCIS 2021 Proceedings. https://aisel.
aisnet.org/amcis2021/art_intel_sem_tech_intelligent_s
ystems/art_intel_sem_tech_intelligent_systems/12
Chung, S., Animesh, A., & Han, K. (2017). Customer
Attitude from Social Media, Customer Satisfaction
Index, and Firm Value. ICIS 2017 Proceedings.
https://aisel.aisnet.org/icis2017/SocialMedia/Presentati
ons/19
Chung, W., He, S., & Zeng, D. (2015). eMood: Modeling
Emotion for Social Media Analytics on Ebola Disease
Outbreak. ICIS 2015 Proceedings. https://aisel.
aisnet.org/icis2015/proceedings/SocialMedia/21
Dang, N. C., Moreno-García, M. N., & De la Prieta, F.
(2020). Sentiment Analysis Based on Deep Learning: A
Comparative Study. Electronics, 9(3), 483.
https://doi.org/10.3390/electronics9030483
Darwich, M., Mohd Noah, S. A., Omar, N., & Osman, N.
(2019). Corpus-Based Techniques for Sentiment
Lexicon Generation: A Review. Journal of Digital
Information Management
, 17, 296. https://doi.org/
10.6025/jdim/2019/17/5/296-305
Deng, Y., & Khern-am-nuai, W. (2019). The Value of
Editorial Reviews for UGC Platform. ICIS 2019
Proceedings. https://aisel.aisnet.org/icis2019/econo
mics_is/economics_is/31
Do, H. H., Prasad, P. W. C., Maag, A., & Alsadoon, A.
(2019). Deep learning for aspect-based sentiment
analysis: A comparative review. Expert Systems with
Applications, 118, 272–299. https://doi.org/10.1016/
j.eswa.2018.10.003
Fan, S., Ilk, N., & Zhang, K. (2015). Sentiment Analysis in
Social Media Platforms: The Contribution of Social
Relationships. ICIS 2015 Proceedings. https://aisel.
aisnet.org/icis2015/proceedings/DecisionAnalytics/10
Gao, S., Jinxing Hao, & Fu, Y. (2015). The application and
comparison of web services for sentiment analysis in
tourism. 2015 12th International Conference on Service
Systems and Service Management (ICSSSM), 1–6.
https://doi.org/10.1109/ICSSSM.2015.7170341
Geske, F., Hofmann, P., Lämmermann, L., Schlatt, V., &
Urbach, N. (2021). Gateways to Artificial Intelligence:
Developing a Taxonomy for AI Service Platforms.
ECIS 2021 Research Papers. https://aisel.aisnet.org/
ecis2021_rp/150
Giachanou, A., & Crestani, F. (2016). Like It or Not: A
Survey of Twitter Sentiment Analysis Methods. ACM
WEBIST 2021 - 17th International Conference on Web Information Systems and Technologies
112

Computing Surveys, 49(2), 28:1-28:41. https://doi.org/
10.1145/2938640
Gonçalves, P., Araújo, M., Benevenuto, F., & Cha, M.
(2013). Comparing and combining sentiment analysis
methods. Proceedings of the First ACM Conference on
Online Social Networks, 27–38. https://doi.org/
10.1145/2512938.2512951
Grigore, M., & Rosenkranz, C. (2011). Increasing The
Willingness To Collaborate Online: An Analysis of
Sentiment-Driven Interactions In Peer Content
Production. ICIS 2011 Proceedings. https://aisel.
aisnet.org/icis2011/proceedings/onlinecommunity/20
Grigore, M., Rosenkranz, C., & Sutanto, J. (2015). The
Impact of Sentiment-driven Feedback on Knowledge
Reuse in Online Communities. AIS Transactions on
Human-Computer Interaction, 7(4), 212–232.
Gunarathne, P., Rui, H., & Seidmann, A. (2014). Customer
Service on Social Media: The Effect of Customer
Popularity and Sentiment on Airline Response. ICIS
2014 Proceedings. https://aisel.aisnet.org/icis2014/
proceedings/SocialMedia/9
Habimana, O., Li, Y., Li, R., Gu, X., & Yu, G. (2019).
Sentiment analysis using deep learning approaches: An
overview. SCIENCE CHINA Information Sciences,
63(1), 111102. https://doi.org/10.1007/S11432-018-
9941-6
Ho, S. Y., Choi, K., & Yang, F. (Finn). (2019). Harnessing
Aspect - Based Sentiment Analysis: How Are Tweets
Associated with Forecast Accuracy? Journal of the
Association for Information Systems, 20(8).
https://doi.org/10.17705/1j ais.00 564
Hu, T., & Tripathi, A. (2015). The Effect of Social Media
on Market Liquidity. ICIS 2015 Proceedings.
https://aisel.aisnet.org/icis2015/proceedings/Decision
Analytics/21
Jarvenpaa, S., & Tuunainen, V. (2013). How Finnair
Socialized Customers for Service Co-Creation with
Social Media. MIS Quarterly Executive, 12(3).
https://aisel.aisnet.org/misqe/vol12/iss3/4
Jiang, C., Wang, J., TANG, Q., & Lyu, X. (2021).
Investigating the Effects of Dimension-Specific
Sentiments on Product Sales: The Perspective of
Sentiment Preferences. Journal of the Association for
Information Systems, 22(2). https://doi.org/10.17705/
1jais.00668
Jurafsky, D., & Martin, J. H. (2008). Jurafsky, D: Speech
and Language Processing: International Edition (2nd
ed.). Prentice Hall.
Kim, K., Lee, S.-Y. T., & Benyoucef, M. (2017). The
Impact of Social Sentiment on Firm Performance
Similarity. ICIS 2017 Proceedings. https://aisel.
aisnet.org/icis2017/SocialMedia/Presentations/8
Kowsari, K., Jafari Meimandi, K., Heidarysafa, M., Mendu,
S., Barnes, L., & Brown, D. (2019). Text Classification
Algorithms: A Survey. Information
, 10(4), 150.
https://doi.org/10.3390/info10040150
Krouska, A., Troussas, C., & Virvou, M. (2016). The effect
of preprocessing techniques on Twitter sentiment
analysis. 2016 7th International Conference on
Information, Intelligence, Systems Applications (IISA),
1–5. https://doi.org/10.1109/IISA.2016.7785373
Lee, S.-Y., Qiu, L., & Whinston, A. (2014). Manipulation:
Online Platforms’ Inescapable Fate. ICIS 2014
Proceedings. https://aisel.aisnet.org/icis2014/
proceedings/EconomicsandValue/2
Li, B., & Chong, A. (2019). What Influences the
Dissemination of Online Rumor Messages: Message
Features and Topic-congruence. ICIS 2019
Proceedings. https://aisel.aisnet.org/icis2019/crowds_
social/crowds_social/37
Li, G., Zheng, Q., Zhang, L., Guo, S., & Niu, L. (2020).
Sentiment Infomation based Model For Chinese text
Sentiment Analysis. 2020 IEEE 3rd International
Conference on Automation, Electronics and Electrical
Engineering (AUTEEE), 366–371. https://doi.org/
10.1109/AUTEEE50969.2020.9315668
Ligthart, A., Catal, C., & Tekinerdogan, B. (2021).
Systematic reviews in sentiment analysis: A tertiary
study. Artificial Intelligence Review. https://doi.org/
10.1007/s10462-021-09973-3
Lin, Y.-W., Ahsen, M. E., Shaw, M., & Seshadri, S. (2019).
The Impacts of Patients’ Sentiment Trajectory Features
on Their Willingness to Share in Online Support
Groups. ICIS 2019 Proceedings. https://aisel.
aisnet.org/icis2019/is_health/is_health/15
Lin, Z., & Goh, K. (2011). Measuring The Business Value
of Online Social Media Content For Marketers. ICIS
2011 Proceedings. https://aisel.aisnet.org/icis2011/
proceedings/knowledge/16
Liu, B. (2015). Sentiment Analysis: Mining Opinions,
Sentiments, and Emotions (Studies in Natural
Language Processing). Cambridge University Press.
Luo, X., Gu, B., Zhang, J., & Phang, C. W. (2017). Expert
Blogs and Consumer Perceptions of Competing Brands.
Management Information Systems Quarterly, 41(2),
371–395.
Mell, P., & Grance, T. (2011). The NIST Definition of Cloud
Computing (NIST Special Publication (SP) 800-145).
National Institute of Standards and Technology.
https://doi.org/10.6028/NIST.SP.800-145
Minaee, S., Azimi, E., & Abdolrashidi, A. (2019). Deep-
Sentiment: Sentiment Analysis Using Ensemble of
CNN and Bi-LSTM Models. ArXiv:1904.04206 [Cs,
Stat]. http://arxiv.org/abs/1904.04206
Mohammad, S. (2018a, May). Word Affect Intensities.
Proceedings of the Eleventh International Conference
on Language Resources and Evaluation (LREC 2018).
LREC 2018, Miyazaki, Japan. https://aclanthology.org/
L18-1027
Mohammad, S. (2018b). Obtaining Reliable Human
Ratings of Valence, Arousal, and Dominance for
20,000 English Words. Proceedings of the 56th Annual
Meeting of the Association for Computational
Linguistics (Volume 1: Long Papers), 174–184.
https://doi.org/10.18653/v1/P18-1017
Mohammad, S. M., & Turney, P. D. (2013). Crowdsourcing
a Word–Emotion Association Lexicon. Computational
Intelligence
, 29(3), 436–465. https://doi.org/10.1111/
j.1467-8640.2012.00460.x
Commercial Sentiment Analysis Solutions: A Comparative Study
113

Ribeiro, F. N., Araújo, M., Gonçalves, P., Gonçalves, M.
A., & Benevenuto, F. (2016). SentiBench—A
benchmark comparison of state-of-the-practice
sentiment analysis methods. EPJ Data Science, 5(1), 1–
29. https://doi.org/10.1140/epjds/s13688-016-0085-1
Salehan, M., & Kim, D. (2014). Predicting the Performance
of Online Consumer Reviews: A Sentiment Mining
Approach. ICIS 2014 Proceedings. https://aisel.
aisnet.org/icis2014/proceedings/DecisionAnalytics/8
Sengupta, S., Basak, S., Saikia, P., Paul, S., Tsalavoutis, V.,
Atiah, F., Ravi, V., & Peters, A. (2020). A Review of
Deep Learning with Special Emphasis on
Architectures, Applications and Recent Trends.
Knowledge-Based Systems, 194, 105596.
https://doi.org/10.1016/j.knosys.2020.105596
Serrano-Guerrero, J., Olivas, J. A., Romero, F. P., &
Herrera-Viedma, E. (2015). Sentiment analysis: A
review and comparative analysis of web services.
Information Sciences, 311, 18–38.
https://doi.org/10.1016/j.ins.2015.03.040
Silva, N. F. F. D., Coletta, L. F. S., & Hruschka, E. R.
(2016). A Survey and Comparative Study of Tweet
Sentiment Analysis via Semi-Supervised Learning.
ACM Computing Surveys, 49(1), 15:1-15:26.
https://doi.org/10.1145/2932708
Strapparava, C., & Valitutti, A. (2004, May). WordNet
Affect: An Affective Extension of WordNet.
Proceedings of the Fourth International Conference on
Language Resources and Evaluation (LREC’04).
LREC 2004, Lisbon, Portugal. http://www.lrec-
conf.org/proceedings/lrec2004/pdf/369.pdf
Troussas, C., Virvou, M., Espinosa, K. J., Llaguno, K., &
Caro, J. (2013). Sentiment analysis of Facebook
statuses using Naive Bayes classifier for language
learning. IISA 2013, 1–6. https://doi.org/10.1109/
IISA.2013.6623713
Turney, P. D., & Littman, M. L. (2003). Measuring praise
and criticism: Inference of semantic orientation from
association. ACM Transactions on Information
Systems, 21(4), 315–346. https://doi.org/10.1145/
944012.944013
Wiegand, M., Balahur, A., Roth, B., Klakow, D., &
Montoyo, A. (2010). A survey on the role of negation
in sentiment analysis. Proceedings of the Workshop on
Negation and Speculation in Natural Language
Processing, 60–68. https://www.aclweb.org/anthology/
W10-3111
Wilson, T., Wiebe, J., & Hoffmann, P. (2009). Recognizing
contextual polarity: An exploration of features for
phrase-level sentiment analysis. Computational
Linguistics, 35(3), 399–433. https://doi.org/10.1162/
coli.08-012-R1-06-90
Yadav, A., & Vishwakarma, D. K. (2020). Sentiment
analysis using deep learning architectures: A review.
Artificial Intelligence Review, 53(6), 4335–4385.
https://doi.org/10.1007/s10462-019-09794-5
Yadollahi, A., Shahraki, A. G., & Zaiane, O. R. (2017).
Current State of Text Sentiment Analysis from Opinion
to Emotion Mining. ACM Computing Surveys,
50(2),
25:1-25:33. https://doi.org/10.1145/3057270
Zhang, W., & Lau, R. (2013). The Design of A Network-
Based Model For Business Performance Prediction.
ICIS 2013 Proceedings. https://aisel.aisnet.org/
icis2013/proceedings/KnowledgeManagement/10
WEBIST 2021 - 17th International Conference on Web Information Systems and Technologies
114
