
Impact of Tailored Network Splitting and Community Features’ Change
Rates on Prediction Accuracy in Dynamic Social Networks
Narimene Dakiche
1
, Karima Benatchba
1
, Fatima Benbouzid-Si Tayeb
1
and Yahya Slimani
2
1
Laboratoire des M
´
ethodes de Conception de Syst
`
emes (LMCS), Ecole Nationale Sup
´
erieure d’Informatique (ESI),
BP 68M - 16270 Oued Smar, Alger, Algeria
2
Computer Science Department, ISAMM Institute of Manouba, 2010 Manouba, Tunisia
Keywords:
Dynamic Social Networks, Community Behavioral Events, Evolution Prediction.
Abstract:
With its various real-life applications, predicting community evolution is a challenging task in the field of
social network analysis. In this paper, we analyze communities’ evolution prediction accuracy in dynamic
social networks. The proposed approach combines two key concepts of the process, aiming to enrich the
prediction model by additional information that could improve the results: (1) a tailored network splitting
that results in snapshots of different periods rather than a static one, and (2) the change rates of communities’
features that characterize them over time instead of absolute values of features. Our experiments on four real-
world social networks confirm that community evolution prediction can be achieved with a very high accuracy
by using both tailored network splitting as a first step of prediction process and change rates of features.
1 INTRODUCTION
Nowadays, social networks have become widespread
and increasingly popular. For numerous useful pur-
poses, Social Network Analysis (SNA) exploits graph
theories to study the social relationships between in-
teracting actors. Indeed, graphs are commonly used
to represent social networks in which nodes are of-
ten individuals or social entities and edges describe
their social interactions (Tabassum et al., 2018). The
dynamic network is a further abstraction of the net-
work concept that evolve over time. Several changes
happen as new nodes join the network, existing nodes
leave it, and existing pairs of nodes develop new rela-
tionships or end old ones. Social networks are known
to have a community structure, i.e., groups of nodes
closer to each other in comparison to other nodes of
the network. These communities may undergo differ-
ent behavioral events and transitions over time such as
growth, split, merge and survive (Br
´
odka et al., 2013).
The prediction of community evolutionary events
is the heart of social network analysis’ phenomenal
rise. The main issues in the related literature are how
to identify communities’ behavioral events that may
have taken place, and how to forecast their future.
Previous works on predicting community evolution
(Dakiche et al., 2021; Rajita et al., 2020; Saganowski
et al., 2019; Pavlopoulou et al., 2017;
˙
Ilhan and
¨
O
˘
g
¨
ud
¨
uc
¨
u, 2016; Diakidis et al., 2015; Takaffoli et al.,
2014; Br
´
odka et al., 2013) are typically addressed
through the same main steps. First, the dynamic net-
work is divided into a time-series of snapshots. Then,
for each snapshot, an algorithm of community detec-
tion is used to identify its communities. Subsequently,
a set of relevant features is computed, for each com-
munity, to describe its state. Then, similar communi-
ties of successive snapshots are matched to label the
transformation with an appropriate possible behav-
ioral event. As a results, evolution sequences describ-
ing the states of each pair of matched communities are
created. Finally, the classification step consists in de-
riving information from the evolution sequences and
predicting the upcoming behavioral events of commu-
nities.
This process faces two main issues. The first one
concerns the dynamic social network splitting into a
sequence of consecutive snapshots, each one contains
a set of interactions aggregated over discrete time pe-
riods. However, the challenge related to network’s
splitting is the resolution level at which the interac-
tions are aggregated to build the snapshots. Indeed,
the detected community structures, their behavioral
events, and the prediction are all influenced by the
periods selected to split the network. In order to deal
with this issue, Dakiche et al. (2018) have investigated
the problem of choosing the appropriate scale for net-
Dakiche, N., Benatchba, K., Benbouzid-Si Tayeb, F. and Slimani, Y.
Impact of Tailored Network Splitting and Community Features’ Change Rates on Prediction Accuracy in Dynamic Social Networks.
DOI: 10.5220/0010709300003058
In Proceedings of the 17th International Conference on Web Information Systems and Technologies (WEBIST 2021), pages 95-102
ISBN: 978-989-758-536-4; ISSN: 2184-3252
Copyright
c
2021 by SCITEPRESS – Science and Technology Publications, Lda. All rights reserved
95

work splitting which would improve the prediction.
Later, they proposed a new framework that provides a
tailored network splitting by examining activity dis-
tribution of users over time to produce more accu-
rate community evolution prediction (Dakiche et al.,
2021).
The second issue is related to community features’
computation and the selection of a suitable set of
features to describe communities and how those fea-
tures are used in the prediction task. Indeed, there
is an abundance of community structural and tem-
poral features that could be considered by comput-
ing their absolutes values (
˙
Ilhan and
¨
O
˘
g
¨
ud
¨
uc
¨
u, 2016;
Pavlopoulou et al., 2017; Saganowski et al., 2019;
Rajita et al., 2020). In this sens, Dakiche et al.
(2019) have investigated community evolution pre-
diction based on change rates of features that describe
a community throughout its evolution life-cycle rather
than absolute values of features.
In this paper, we investigate community evolution
prediction accuracy by, simultaneously, using a tai-
lored network splitting rather than a static one and
the change rates of features that represent the com-
munities instead of absolute values of features. Our
challenge is to achieve very high community evolu-
tion prediction accuracy. The rest of the paper is orga-
nized as follows. Section 2 introduces the community
evolution prediction approach. Section 3 presents the
experimental study and the obtained results. Finally,
Section 4 summarizes the work and outlines future
developments.
2 COMMUNITY EVOLUTION
PREDICTION
Community evolution prediction is typically ad-
dressed as a supervised learning task where commu-
nities history is exploited to forecast their behavioral
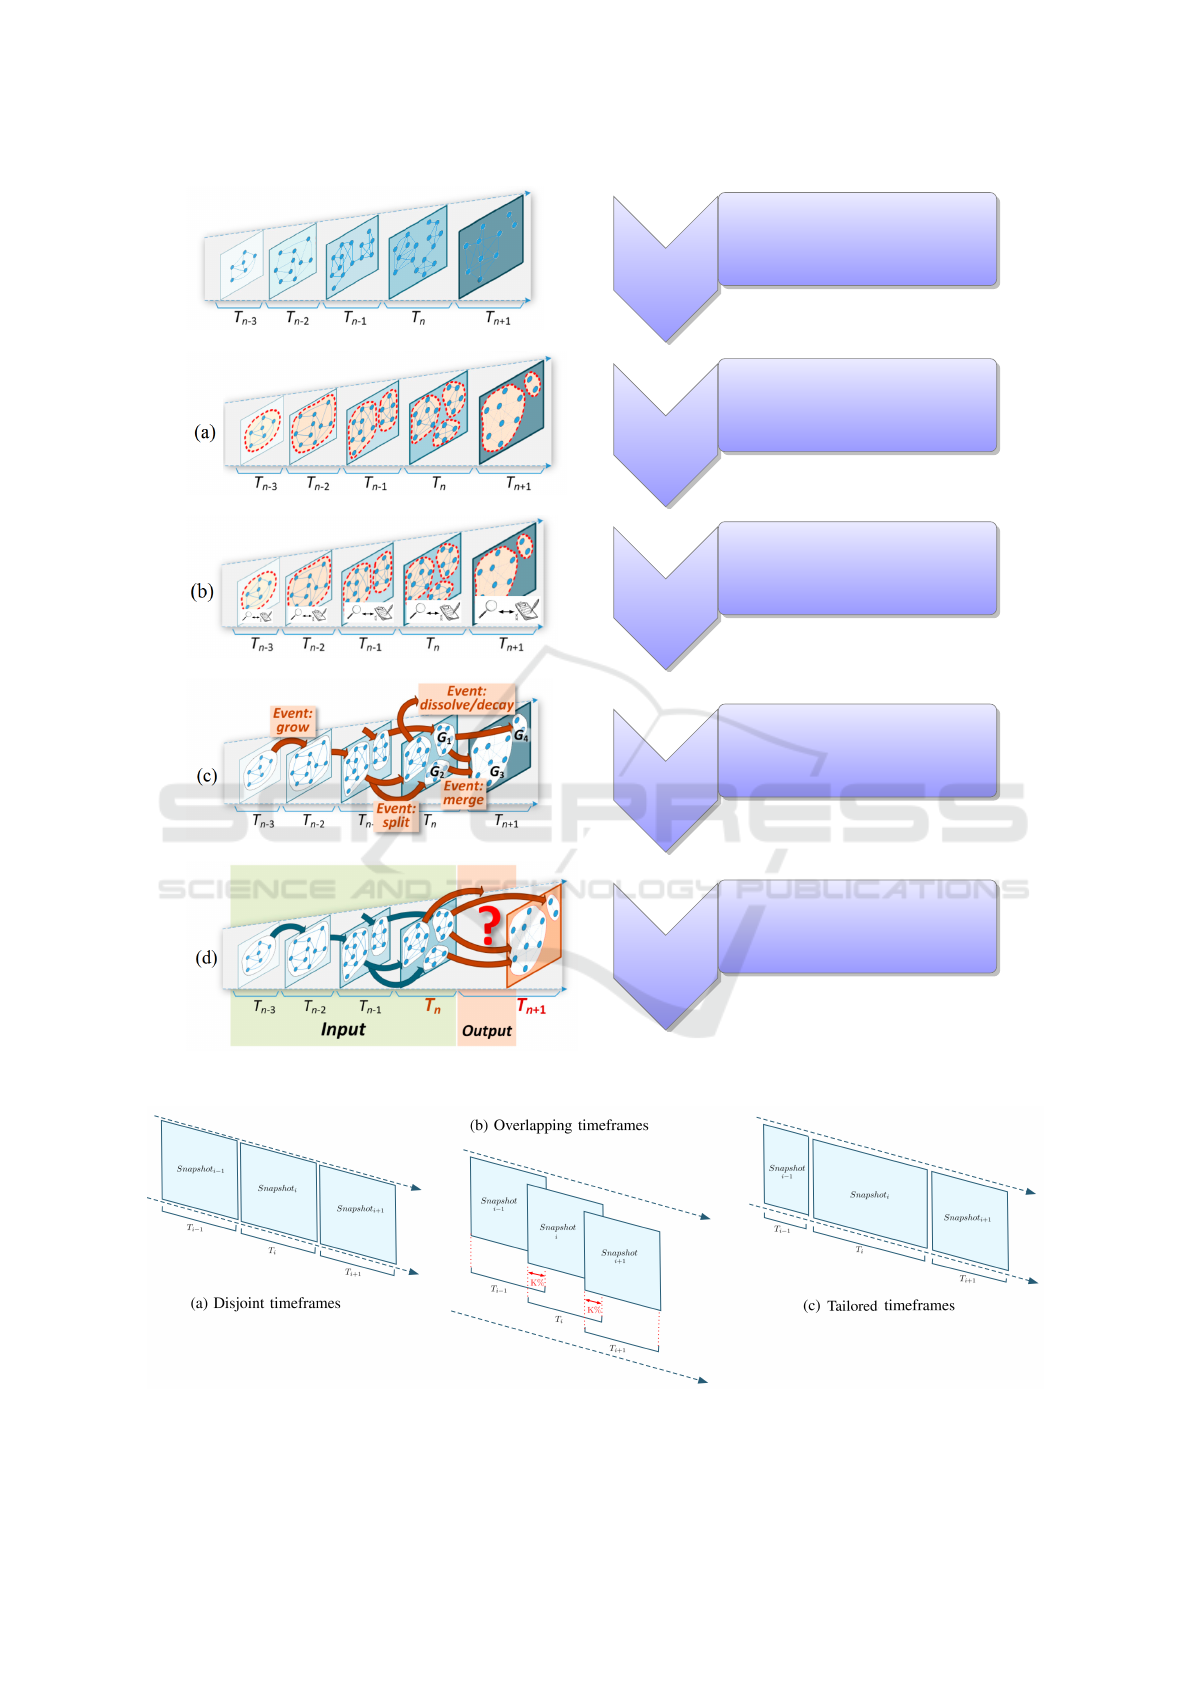
transformations. As shown in Fig. 1, it consists of the
following essential steps: (1) The dynamic social net-
work data is separated into a number of snapshots; (2)
Then, for each snapshot, a community detection algo-
rithm is applied to determine its communities; (3) For
each community, a set of mostly structural features
such as cohesion, size, and density, is computed to
describe its state; (4) Following that, identical com-
munities from successive snapshots are matched us-
ing a community evolution tracker, and the change is
tagged with a suitable event among the potential be-
havioral events. (4) Finally, to forecast future occur-
ring events in communities’ life-cycle, a predictive
model is built. In next subsections, through the dif-
ferent phases of community evolution prediction pro-
cess, we will present the new features incorporated.
2.1 Network Splitting
A dynamic social network G = (V, E
t
) is defined by
a set of nodes V and a set of time-stamped edges.
Each edge e ∈ E
t
represents an interaction between
two nodes u, v ∈ V at time t (Holme and Saram
¨
aki,
2012). It is usually split into τ consecutive snapshots
G = (G
0
, ..., G
τ
)., where G
i
= (V
i
, E
i
) corresponds to
a graph with only the set of nodes and edges that ap-
pears in the interval (t
i
,t
i+1
).
Usually, existing works on community evolution
prediction use snapshots of an arbitrary fixed-length
aggregation period, with or without overlap. The
snapshots’ durations are frequently based on conve-
nience or intuition, or selected according to the col-
lecting data technology (hourly, daily, monthly, and
yearly) (Pavlopoulou et al., 2017;
˙
Ilhan and
¨
O
˘
g
¨
ud
¨
uc
¨
u,
2016; Diakidis et al., 2015). Very recently, Dakiche
et al. (2021) introduced the concept of network tai-
lored splitting. It consists in analyzing the network
data distribution over time and grouping periods that
have low activity interactions in one snapshot, while
times with high activity interactions are broken up
into many snapshots. Their approach depends on a
parameter γ that outputs the data amount required per
snapshot. Thus, the snapshots’ periods may differ.
Fig. 2 illustrates the three types of snapshots.
2.2 Community Detection
Community detection consists in finding groups of
nodes closer to each other in comparison to other
nodes of the network. While G
i
represents the
graph of the i
th
snapshot in a dynamic network,
the k detected communities are denoted by C
i
=
(C
1
i
,C
2
i
, ...,C
k
i
) where community C
p
i
∈ C
i
, 1 ≤ p ≤ k,
is also a graph denoted by (V
p
i
, E
p
i
).
In the literature, several methods have been
proposed (El Moussaoui et al., 2019), each of
which draws communities with distinct characteris-
tics. Some of these result in disjointed communi-
ties, while others result in communities that over-
lap. It is often hard to compare the influence of two
types of community detection algorithms on classifi-
cation accuracy because each approach produces dif-
ferent communities, which result in different behav-
ioral events.
We adopt Clique Percolation Method (CPM
1
)
(Palla et al., 2005) rather than modularity maximiza-
tion (Clauset et al., 2004) in this study. Indeed, CPM
1
http://www.cfinder.org/
WEBIST 2021 - 17th International Conference on Web Information Systems and Technologies
96
Network
splitting
Split the dynamic social network
into a sequence of consecutive
snapshots G = (G
0
, , G
τ
).
Community
detection
Detect community structures
of each graph G
i
in the se-
quence: C
i
= (C
1
i
, C
2
i
, , C
k
i
) .
Feature
extraction
Comupte a set of features
F
i
= (f
1
i
, f
2
i
, , f
k
i
) for
each community c
i
t
in C
t
.
Event
detection
Apply a community event
tracker to identify the behav-
ioral events of communities.
Classification
(Prediction)
Apply the classifiers on com-
munity evolution sequences to
produce the prediction results.
Figure 1: Community evolution prediction process (Dakiche et al., 2021).
Figure 2: Different snapshot types (Dakiche et al., 2018).
Impact of Tailored Network Splitting and Community Features’ Change Rates on Prediction Accuracy in Dynamic Social Networks
97

Table 1: A set of community structural features.
Feature Definition Formula
Size Ratio
Total of nodes inside the community i at
time t
n
t
i
Density
Ratio of edges to the maximum possible
edges.
2|E
t
i
|
|V
t
i
|(|V
t
i
|−1)
Cohesion
Strength of connections inside the commu-
nity in relation to the connections outside of
it.
2|E
t
i
|
|V
t
i
|(|V
t
i
|−1)
E
t
i
‘
,i
Average Cluster-
ing Coefficient
Ratio of the sum of clustering coefficient
of the community nodes cc
t
i
to the total of
nodes in the community.
cc
t
i
n
t
i
Average Degree
Centrality
Ratio of the sum of degrees of the nodes in
the community D
t
i
to the total of nodes in
the community
D
t
i
n
t
i
Average Closeness
Centrality
Ratio of the total node closeness in the com-
munity C
t
i
to the total of nodes in the com-
munity.
C
t
i
n
t
i
Average Eigen-
Vector Centrality
Ratio of the total node EigenVector in the
community E
t
i
to the total of nodes in the
community.
E
t
i
n
t
i
discovers more realistic overlapping communities. In
the next stage, the detected communities are used to
compute relevant features that describe their statuses.
2.3 Feature Extraction
A variety of metrics can be used to characterize a
community at a given snapshot. Researchers have
put in a lot of work to propose such metrics, and as
a result, there are a lot of them. The selection of the
proper collection of measures to include for the pre-
diction is a critical problem that has been discussed in
the literature (Saganowski et al., 2019).
We use two kinds of features to build information
about communities that describe their several prop-
erties: structural community features and community
influential members features. Indeed, these features
have been shown to be useful for prediction results
(Shahriari et al., 2016). The following sections go
through the features that were taken into considera-
tion.
2.3.1 Structural Features of Communities
Community structures gather nodes which are more
closely linked to one another than to the rest of the
network. We may use all of the information gained
from communities’ topological study. To achieve this,
we select features from Table 1 that we believe are
sufficient to capture various community properties.
2.3.2 Influential Members Features
We normally include all members and their proper-
ties while assessing the network dynamics. How-
ever, communities are frequently headed by individ-
uals with significant influence over the others and
who shape their community’s evolution. In this sens,
we evaluate the characteristics of the most prominent
nodes, referred to as leaders. In general, nodes with
the greatest 20% eigenvector centrality values are re-
garded as leaders (Takaffoli et al., 2014). We look at
the following characteristics for the detected leaders:
• LeaderDegCen: leaders average degree.
• LeaderClosenessCentrality: leaders average
closeness.
• LeaderEigenCentrality: leaders average eigen-
vector.
Usually, absolute values of communities’ features are
employed to represent them. Yet, Dakiche et al.
(2019) proposed to use the rates at which community
features change. The objective is to leverage these
change rates to generate new data to be exploited in
the prediction step. Formally, the change rates of
community C
i
t
characteristics f
j
are computed de-
pending on its prior instance’s existing properties, i.e.
C
i
t−1
. The following formula is used to calculate the
rate of change of the j
th
feature of community i at
time t:
f
j
i,t
− f
j
i,t−1
f
j
i,t−1
∗ 100 (1)
with f
j
, 1 ≤ j ≤ 10 are the features introduced above
that represent community structure and its influential
members.
WEBIST 2021 - 17th International Conference on Web Information Systems and Technologies
98

2.4 Event Detection
This phase’s most important purpose is to detect com-
munity behavioral events between snapshots. It en-
tails locating a number of comparable communities in
various time points which are ordered by time snap-
shots. Thus, a dynamic community is formalized as
DC = {C
t
0
,C
t
1
, ...,C
t
τ
}, where t
0
< t
1
< ... < t
τ
and C
t
i
represents the community instance at time ti. Further-
more, the evolution of a community is represented by
the events that occur from one snapshot to the next,
such as splitting, growing, merging, dissolving, and
so on. This complicates the task of locating a specific
community at time t
i
among those of time t
i+1
.
In the literature, there are numerous taxonomies
that define the transitions that are expected to oc-
cur for a community. Thus, community evolution
can then be described as a time-ordered succession
of communities, beginning with the first appearance
and ending with the last appearance. In this study,
we apply the GED method (Group Evolution Detec-
tion (Br
´
odka et al., 2013)), which was chosen as the
one that gives the most satisfying results in the recent
evaluation of existing evolution trackers (He et al.,
2017). To match similar communities, GED uses an
inclusion measure. It computes the extent to which
one community is integrated into another by comput-
ing the amount and quality of community members as
follows:
I(C
t
i
,C
t+1
j
) =
|C
t
i
∩C
t+1
j
|
|C
t
i
|
.
∑
u∈C
t
i
∩C
t+1
j
NI(C
t
i
(u))
∑
u∈C
t
i
NI(C
t
i
(u))
(2)
The first half of the equation reflects the quantity,
which represents the proportion of nodes from C
i
who
also belong to C
j
. The second portion of the equation
expresses the quality, which represents the contribu-
tion of important nodes from C
i
in C
j
. As a result, the
inclusion measure produces a balance between com-
munities with a large number of less important nodes
and communities with a small number of significant
nodes. NI(C
t
i
(u)) is usually a statistical metric that
evaluates the relevance of a node within its commu-
nity.
2.5 Prediction
The predictive step consists in using previously com-
puted features and identified behavioral events as
community evolution sequences to train and test the
classifiers. A community evolution sequence is made
up of a community and its multiple preceding in-
stances from earlier frames. It consists of the present
community C
p
t
i
, the p
th
community of snapshot t
i
, and
its previous instances C
p
t
i−1
, C
p
t
i−2
, ..., C
p
t
i−n
. Each com-
munity instance is described by its structural features
and its identified evolution event. For example, Fig.
3 depicts an evolution sequence that includes two in-
stances of a community Ci at snapshot t −1 and snap-
shot t , as well as its evolution event. Thus, the aim is
to forecast the community C
i
’s next behavioral event
between snapshots t and t + 1.
Figure 3: An evolution sequence of two states (Dakiche
et al., 2021).
To perform the prediction, we adopt a multi-class
classification method. The result is one of the be-
havioral events except the forming one. Indeed, the
forming event cannot be regarded as a response vari-
able because it refers to the formation of a commu-
nity. Otherwise, each of the remaining behavioral
events is treated as a class of the prediction model. To
assign relevant event labels, we use Logistic, Naive-
Bays, J48, and Support Vector Machines (SMO) clas-
sifiers
2
.
3 EXPERIMENTAL STUDY
In this section, we analyze the investigate of dynamic
networks’ tailored splitting on the predictive model
based on community features’ change rates. To do so,
we use four different networks (see Table 2):
1. CollegeMsg Network: it is a students’ network in
which they exchange private messages on an on-
line social network at the University of California,
Irvine (Panzarasa et al., 2009). It contains data
over 193 days between 15
th
April and 26
th
Octo-
ber 2004.
2. Facebook Wall-posting Network: it is a directed
network of posts to other users’ wall on Face-
book New Orleans network. Each directed edge
is one post that links a person who publishes a
post to a user whose wall the post is published on
(Viswanath et al., 2009). It contains data over 4
years between 14
th
September 2004 and 22
th
Jan-
uary 2009.
2
WEKA Data Mining implementation of the classifiers
(Hall et al., 2009)
Impact of Tailored Network Splitting and Community Features’ Change Rates on Prediction Accuracy in Dynamic Social Networks
99

Table 2: Networks’ information.
Network Nodes Interactions Period
CollegeMsg 1 899 59 835 15
th
April - 26
th
October 2004
Facebook 46 952 87 993 14
th
September 2004 - 22
th
January 2009
ML King 2013 327 707 421 083 25
th
August - 02
nd
September 2013
Moscow Athletics 2013 88 804 303 330 5
th
August - 19
th
August 2013
3. ML King 2013 Network: it is a social relation-
ships network between Twitter’s users during the
exceptional event of the 50
th
anniversary of Mar-
tin Luther King’s speech “I have a dream ...” in
2013 (Omodei et al., 2015). It contains data over
7 days between 25
th
August and 02
nd
September,
2013.
4. Moscow Athletics 2013 network: it is a so-
cial relationships network between Twitter’s users
during the exceptional event of World Champi-
onships in Athletics in 2013 (Omodei et al., 2015).
It contains data over 14 days between 5
th
August
and 19
th
August, 2013.
For each network, we considered both static and
tailored splitting of the network. Then, for each
splitting, we considered the predictive model with
and without communities descriptive features’ change
rates. This resulted in four scenarios for each network
as follows:
• using static network splitting with absolute values
of community features,
• using static network splitting with change rates of
community features,
• using tailored network splitting with absolute val-
ues of community features,
• using tailored network splitting with change rates
of community features.
In order to obtain the tailored splitting of each net-
work, we have conducted several tests which revealed
that the best tailored splitting for both Facebook and
CollegeMsg networks was obtained with α = 2, 5%,
while the best tailored splitting for ML King 2013
and Moscow Athletics 2013 networks was obtained
with α = 5%. Consequently, we have considered for
each network its corresponding tailored splitting with
a static splitting that produces the same number of
snapshots. This results in static splitting of 40 snap-
shots for Facebook (40 days per snapshot) and Col-
legeMsg (5 days per snapshot) networks and 20 snap-
shots for Moscow Athletics 2013 (12 hours per snap-
shot) and ML King 2013 (6 hours per snapshot) net-
works.
Table 3 presents the prediction results of all net-
works which are expressed as the F-measure val-
ues obtained with the best performing classifiers un-
der different evolutionary sequence lengths. The F-
measure is the harmonic mean of precision and recall,
which reaches its highest level at 1 and its lowest level
at 0 (Sasaki, 2007). We used this F-measure to present
the classification performance of each particular event
(class). Nonetheless, we use the average F-measure of
all events to represent overall classification quality in
this paper. Indeed, we select the average F-measure
because it considers each class to be equally impor-
tant. Thus, the results of minority classes are not lost.
By analyzing the results of all networks, we can
notice that using a static network splitting with abso-
lute values of communities’ features gives the low-
est prediction accuracy. Yet, when considering the
change rates of communities’ features, the predictive
model achieved better results. Those good results are
also obtained when using a tailored splitting of the
network even with absolute values of features. The
last scenario which combines tailored network split-
ting with change rates of communities’ features im-
proves significantly the prediction results compared
to other scenarios and achieves the highest prediction
accuracy for all networks. Consequently, the results
have shown that using the change rates of descriptive
community features improves the prediction. How-
ever, these results can still be improved by using the
tailored splitting of the network which allows a better
follow-up of the communities.
4 CONCLUSION
Community evolution prediction process involves
several steps and choices made in each step can affect
the prediction accuracy. For instance, a static network
splitting may result in a large number of snapshots
that are difficult to exploit or snapshots that are mean-
ingless for tracking evolution. Moreover, there is an
abundance of features that could be considered to de-
scribe communities and the selection of a suitable set
is a challenging task.
In this work, we investigated the impact of using
tailored network splitting and change rates of features
on community evolution prediction accuracy. The ex-
periments have shown that using the change rates of
descriptive community features improves prediction
compared to using absolute values of features. In ad-
WEBIST 2021 - 17th International Conference on Web Information Systems and Technologies
100

Table 3: F-measure values, of all networks, using (1) a static network splitting and (2) a tailored network splitting, both with
(a) features’ absolute values and (b) features’ change rates.
CollegeMsg network
(1) Static network splitting with : (2) Tailored network splitting with :
P Classifier (a) features’ absolute values (b) features’ change rates (a) features’ absolute values (b) features’ change rates
3
Logistic 0,733 0,845 0,787 0,884
NaiveBayes 0,736 0,886 0,820 0,884
J48 0,719 0,780 0,786 0,901
SMO 0,767 0,804 0,829 0,906
5
Logistic 0,774 0,800 0,809 0,875
NaiveBayes 0,722 0,782 0,855 0,898
J48 0,746 0,820 0,792 0,902
SMO 0,785 0,813 0,776 0,908
7
Logistic 0,746 0,788 0,789 0,897
NaiveBayes 0,741 0,822 0,828 0,892
J48 0,705 0,821 0,873 0,860
SMO 0,772 0,785 0,877 0,904
Facebook wall posting network
(1) Static network splitting with : (2) Tailored network splitting with :
P Classifier (a) features’ absolute values (b) features’ change rates (a) features’ absolute values (b) features’ change rates
2
Logistic 0,726 0,700 0.786 0,917
NaiveBayes 0,664 0,696 0.887 0,884
J48 0,779 0,768 0.892 0,912
SMO 0,758 0,752 0.885 0,907
5
Logistic 0,728 0,736 0.897 0,901
NaiveBayes 0,622 0,728 0.901 0,926
J48 0,737 0,746 0.896 0,893
SMO 0,684 0,732 0.894 0,908
7
Logistic 0,689 0,749 0.776 0,923
NaiveBayes 0,637 0,729 0.824 0,933
J48 0,742 0,768 0.865 0,888
SMO 0,728 0,734 0.865 0,908
Moscow Athletics 2013 network
(1) Static network splitting with : (2) Tailored network splitting with :
P Classifier (a) features’ absolute values (b) features’ change rates (a) features’ absolute values (b) features’ change rates
3
Logistic 0,698 0,794 0,842 0,867
NaiveBayes 0,720 0,798 0,828 0,883
J48 0,696 0,815 0,790 0,893
SMO 0,723 0,819 0,791 0,890
5
Logistic 0,757 0,808 0,833 0,876
NaiveBayes 0,763 0,830 0,816 0,875
J48 0,703 0,811 0,831 0,891
SMO 0,684 0,796 0,813 0,860
7
Logistic 0,705 0,798 0,832 0,898
NaiveBayes 0,703 0,829 0,815 0,893
J48 0,728 0,805 0,814 0,885
SMO 0,759 0,827 0,818 0,870
ML king 2013 network
(1) Static network splitting with : (2) Tailored network splitting with :
P Classifier (a) features’ absolute values (b) features’ change rates (a) features’ absolute values (b) features’ change rates
3
Logistic 0,750 0,794 0,870 0,910
NaiveBayes 0,724 0,864 0,876 0,918
J48 0,847 0,886 0,877 0,860
SMO 0,757 0,848 0,853 0,909
5
Logistic 0,846 0,854 0,875 0,906
NaiveBayes 0,819 0,795 0,851 0,899
J48 0,874 0,809 0,843 0,899
SMO 0,834 0,849 0,873 0,920
7
Logistic 0,871 0,839 0,842 0,915
NaiveBayes 0,715 0,828 0,888 0,881
J48 0,791 0,818 0,881 0,912
SMO 0,766 0,832 0,851 0,910
Impact of Tailored Network Splitting and Community Features’ Change Rates on Prediction Accuracy in Dynamic Social Networks
101

dition, these results have been further improved by
using a tailored splitting of the network. Indeed, the
latter allows a better follow-up of community struc-
tures.
REFERENCES
Br
´
odka, P., Saganowski, S., and Kazienko, P. (2013).
Ged: the method for group evolution discovery in so-
cial networks. Social Network Analysis and Mining,
3(1):1–14.
Clauset, A., Newman, M. E., and Moore, C. (2004). Finding
community structure in very large networks. Physical
review E, 70(6):066111.
Dakiche, N., Benbouzid-Si Tayeb, F., Benatchba, K., and
Slimani, Y. (2021). Tailored network splitting for
community evolution prediction in dynamic social
networks. New Generation Computing, pages 1–38.
Dakiche, N., Benbouzid-Si Tayeb, F., Slimani, Y., and Be-
natchba, K. (2018). Sensitive analysis of timeframe
type and size impact on community evolution predic-
tion. In 2018 IEEE International Conference on Fuzzy
Systems (FUZZ-IEEE). IEEE.
Dakiche, N., Benbouzid-Si Tayeb, F., Slimani, Y., and
Benatchba, K. (2019). Community evolution pre-
diction in dynamic social networks using commu-
nity features’ change rates. In Proceedings of the
34th ACM/SIGAPP Symposium on Applied Comput-
ing, pages 2078–2085.
Diakidis, G., Karna, D., Fasarakis-Hilliard, D., Vogiatzis,
D., and Paliouras, G. (2015). Predicting the evolution
of communities in social networks. In Proceedings of
the 5th International Conference on Web Intelligence,
Mining and Semantics, pages 1–6. ACM.
El Moussaoui, M., Agouti, T., Tikniouine, A., and El Ad-
nani, M. (2019). A comprehensive literature review on
community detection: Approaches and applications.
Procedia Computer Science, 151:295–302.
Hall, M., Frank, E., Holmes, G., Pfahringer, B., Reutemann,
P., and Witten, I. H. (2009). The weka data min-
ing software: An update. SIGKDD Explor. Newsl.,
11(1):10–18.
He, Z., Tajeuna, E. G., Wang, S., and Bouguessa, M. (2017).
A comparative study of different approaches for track-
ing communities in evolving social networks. In 2017
IEEE International Conference on Data Science and
Advanced Analytics (DSAA), pages 89–98. IEEE.
Holme, P. and Saram
¨
aki, J. (2012). Temporal networks.
Physics reports, 519(3):97–125.
˙
Ilhan, N. and
¨
O
˘
g
¨
ud
¨
uc
¨
u, S¸. G. (2016). Feature identification
for predicting community evolution in dynamic social
networks. Engineering Applications of Artificial In-
telligence, 55:202–218.
Omodei, E., De Domenico, M., and Arenas, A. (2015).
Characterizing interactions in online social networks
during exceptional events. Frontiers in Physics, 3:59.
Palla, G., Der
´
enyi, I., Farkas, I., and Vicsek, T. (2005).
Uncovering the overlapping community structure of
complex networks in nature and society. Nature,
435(7043):814–818.
Panzarasa, P., Opsahl, T., and Carley, K. M. (2009). Pat-
terns and dynamics of users’ behavior and interaction:
Network analysis of an online community. Journal
of the American Society for Information Science and
Technology, 60(5):911–932.
Pavlopoulou, M. E. G., Tzortzis, G., Vogiatzis, D., and
Paliouras, G. (2017). Predicting the evolution of com-
munities in social networks using structural and tem-
poral features. In 2017 12th International Workshop
on Semantic and Social Media Adaptation and Per-
sonalization (SMAP), pages 40–45. IEEE.
Rajita, B., Ranjan, Y., Umesh, C. T., and Panda, S. (2020).
Spark-based parallel method for prediction of events.
Arabian Journal for Science and Engineering, pages
1–17.
Saganowski, S., Br
´
odka, P., Koziarski, M., and Kazienko,
P. (2019). Analysis of group evolution prediction in
complex networks. PloS one, 14(10):e0224194.
Sasaki, Y. (2007). The truth of the f-measure. Teach Tutor
Mater, 1(5):1–5.
Shahriari, M., Gunashekar, S., Domarus, M. v., and
Klamma, R. (2016). Predictive analysis of temporal
and overlapping community structures in social me-
dia. In Proceedings of the 25th International Confer-
ence Companion on World Wide Web, pages 855–860.
International World Wide Web Conferences Steering
Committee.
Tabassum, S., Pereira, F. S., Fernandes, S., and Gama, J.
(2018). Social network analysis: An overview. Wiley
Interdisciplinary Reviews: Data Mining and Knowl-
edge Discovery, 8(5):e1256.
Takaffoli, M., Rabbany, R., and Za
¨
ıane, O. R. (2014). Com-
munity evolution prediction in dynamic social net-
works. In 2014 IEEE/ACM International Conference
on Advances in Social Networks Analysis and Mining
(ASONAM), pages 9–16. IEEE.
Viswanath, B., Mislove, A., Cha, M., and Gummadi, K. P.
(2009). On the evolution of user interaction in face-
book. In Proceedings of the 2nd ACM SIGCOMM
Workshop on Social Networks (WOSN’09).
WEBIST 2021 - 17th International Conference on Web Information Systems and Technologies
102
