
How Do Russian Banks Evaluate the Retail Credit Risks?
Henry Penikas
1a
and Darya Savenko
2
1
Bank of Russia, Laboratory of Mathematical Modeling of Complex Systems of the P.N. Lebedev Physical Institute,
Moscow, Russian Federation
2
Moscow Institute of Electronics and Mathematics (MIEM), Moscow, Russian Federation
Keywords: IRB, lending, risk-taking, risk-appetite, SIFI.
Abstract: We use novel data for the lending rate offers by the Russian banks since November 2020 to April 2021. The
data source is the aggregator website banki.ru. It had initially retail loan offers from 19 banks. We control for
the cost of funding and the bank’s risk-appetite in terms of the Return on Equity (ROE). As the result, we are
able to decompose the lending rate into transaction- and bank-specific components. As with the research on
the international banks for the variability in the risk-weights we find that the banks running IRB approach
tend to evaluate retail credit risk higher and set higher interest rates. Banks with the foreign ownership,
inversely, tend to price in lower risk all else being equal and set lower lending rates. The narrow segment of
banks with the available planned ROE data allow us to say that the state-owned banks evaluate the retail credit
risk and set the rates higher, though the magnitude is lower than for the IRB impact. For the narrow segment
also we do not find statistically significant differences in the risk assessment for the listed banks, though we
see that they impose higher lending rates all else being equal.
1 INTRODUCTION
This is not surprising that banks may offer different
lending rates when the very same borrower applies.
One may easily guess that the bank funding mix or its
risk-appetite matter. For instance, expensive deposits
require a bank to impose higher lending rates.
Wishing to obtain higher return on equity (ROE) a
bank may also claim higher lending rates. We do not
discuss here the perverse consequences when higher
lending rates attract less creditworthy borrowers and
thus may result in lower return or even in a bank
failure.
However, if we were able to extract the above
components from the lending rate, we could see how
a bank prices the risk associated with a loan. A
baseline hypothesis would naturally be that banks
price the very same risk similarly. That should
particularly be true when the banks use own default
data and models, and not solely rely upon the
prudential estimates. The former approach is known
as the internal-ratings based (IRB) one. Many studies
discuss its specifics (Gordy, 2000), (Gordy, 2003)
including such shortcomings like procyclicality
a
https://orcid.org/0000-0003-2274-189X
(Gordy & Howells, 2006), infinite granularity
assumption (Gordy & Lütkebohmert, 2013), and its
implications to bank risk-taking (Repullo, 2004).
Regulators and researchers also departed from this
assumption when studying IRB-banks. However,
both stakeholders came to disappointing findings that
the banks are materially not in concordance in their
risk assessments (BCBS, 2013c), (BCBS, 2016),
(Behn, et al., 2016). Nevertheless, a recent study
counterargues that the differences in the risk-
assessments are more due to the fundamentals (EBA,
2021).
All the studies above considered European
countries, except Russia. That is why we wish to
verify what the situation in Russia is, i.e., do banks
evaluate the very same borrowers and transactions
similarly or not. Such a verification means that bank-
specific factors (other than funding costs or risk-
appetite) should not impact neither the risk
assessment, nor the ultimate lending rate.
To undertake such a verification, we lay down our
methodology and describe available data in section 2.
We present our findings in section 3. Section 4
concludes.
354
Penikas, H. and Savenko, D.
How Do Russian Banks Evaluate the Retail Credit Risks?.
DOI: 10.5220/0010704800003169
In Proceedings of the International Scientific-Practical Conference "Ensuring the Stability and Security of Socio-Economic Systems: Overcoming the Threats of the Crisis Space" (SES 2021),
pages 354-363
ISBN: 978-989-758-546-3
Copyright
c
2022 by SCITEPRESS – Science and Technology Publications, Lda. All rights reserved
2 MATERIALS AND METHODS
We follow the straightforward approach presented by
(Horny, et al., 2018) when studying the EU sovereign
bond yields. As (Diebolt, 2015) recommends, we try
to fit the best full sample model without breaking the
subsample into the training and testing ones. This
limitation also originates from the scarce data we
possess at our disposal. Let us cover in more detail
our methodology and data below.
2.1 Methodology
We wish to decompose the lending rate
ijt
Rate
at
time t for bank i and loan type j into time dummies
t
T
, bank-specific drivers
it
X
(including funding costs
and risk-appetite) and risk component
jt
Y
. Latter one
comprises de facto of the transaction-specific factors.
We denote the respective vectors of estimates as
t
Ω
,
i
Β
,
j
Φ
. To account for heteroskedasticity we use
robust estimates for the model residuals
ijt
in (1).
ijt t t it i jt j ijt
Rate T X Y
ΩΒΦ
(1)
To derive the risk component directly, we first
compute the break-even lending rate
MIN
it
R
. It
captures the funding mix by accounting for the capital
adequacy ratio
it
CAR
as the equity portion proxy.
CAR is the ratio of the bank’s capital over its risks.
Simplistically, the risk amount equals to the risk-
weight multiplied by the asset (or exposure) amount.
The equity funding cost or the bank risk-appetite is
the return over equity
it
ROE
. We will consider the
actual and planned values where available. The non-
equity cost of funding is the deposit rate
D
it
r
in local
currency as the loans are offered in our dataset only
in RUB.
1
MIN D
it it it it it
R r CAR ROE CAR
(2
)
We assume that the risk component is the
differential of the actual lending rate and the break-
even one. We call it as the probability of default (PD)
because it generally combines the factors leading to
default on a particular loan.
M
IN
ijt it
Rate R
ijt
PD
(3
)
Having obtained PD estimate, we may run
regression over it in (4) where
it
X
does not comport
ROE, CAR and deposit rate like
it
X
had. This is
equivalent by estimating model (1) with restrictions
over particular coefficients.
t t it i jt j ijt
TXY
ijt
PD Ω Β Φ
(4
)
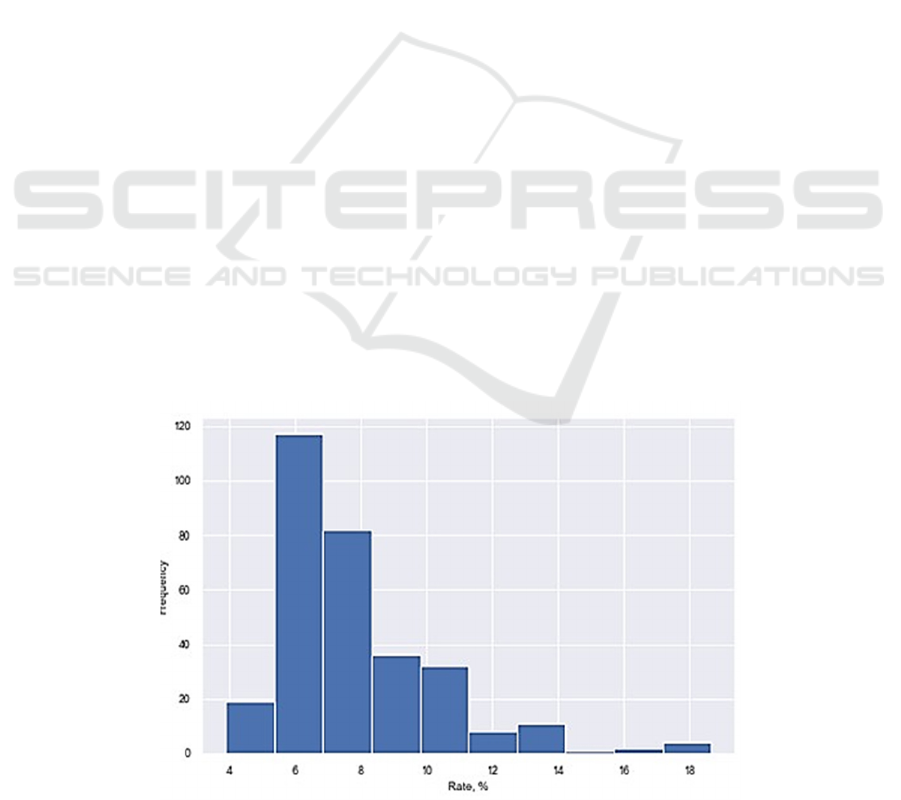
Figure 1: Lending Rate Frequency Distribution.
How Do Russian Banks Evaluate the Retail Credit Risks?
355
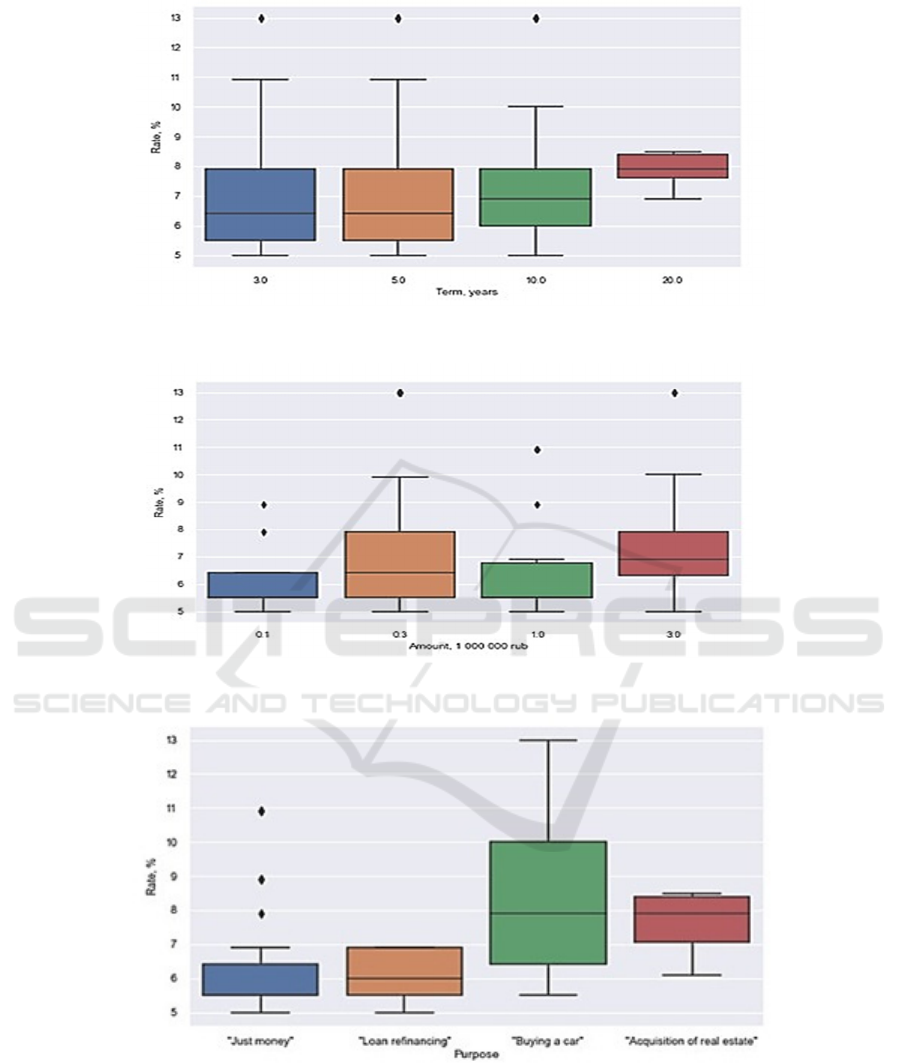
Figure 2: Lending Rate Distribution By Maturity (Term).
Figure 3: Lending Rate Distribution By Volume (Amount).
Figure 4: Lending Rate Distribution By Loan Purpose.
SES 2021 - INTERNATIONAL SCIENTIFIC-PRACTICAL CONFERENCE "ENSURING THE STABILITY AND SECURITY OF
SOCIO - ECONOMIC SYSTEMS: OVERCOMING THE THREATS OF THE CRISIS SPACE"
356
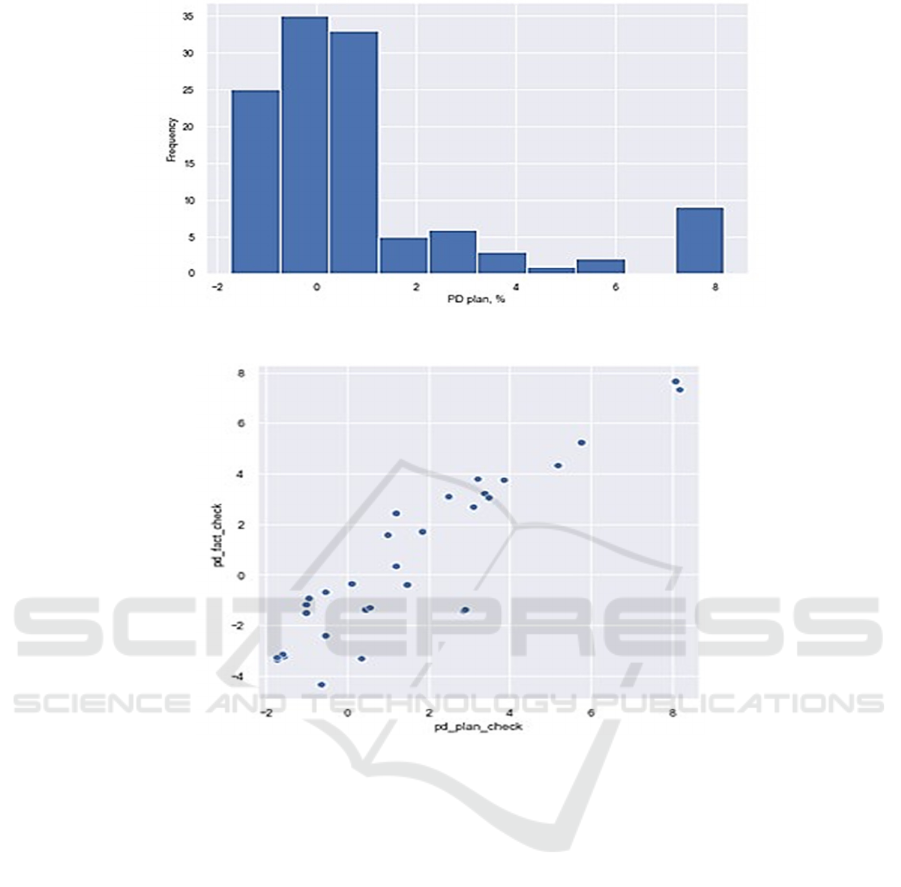
Figure 5: Planned PD Frequency Distribution.
Figure 6: Planned and Actual PD Co-Dependence.
In the principal part of the manuscript we present
the regression estimates for the significant variables
only (
Table 1
), where as Appendix has the output for
the entire list of variables even if the respective
coefficient was insignificant (Table 5).
2.2 Data
We wished to utilise a country-wide dataset of loans,
applications and the respective risk assessments
equivalent to that of (Jimenez, et al., 2014). However,
those are not publicly available.
That is why we utilise a unique publicly available
dataset from the Russian aggregator website banki.ru.
It has no archive. That is why we were lucky to have
made downloads in November 2020, March and April
2021. The website allows a person to enter one’s
quasi-personal data and obtain a set of lending offers
from several banks. We tried entering difference
income, age etc. parameters, but always obtained the
same minimum lending rates. That is why we proceed
with the study of these minimum offered rates for a
single profile inputted to the website.
Importantly, no one – even ourselves included –
knows the borrower risk. Thus, we do not claim to
have perfect risk prediction, but we do compare risk
assessments by different banks. We do not know
which bank has a risk prediction closer to a true one,
but what we wish to find out is to what extent and why
estimates of different banks are misaligned.
Since April 2021 the number of loan offering
banks rose to a hundred. As we started in November
with 19 banks only, we proceed with these 19 banks.
The lending rate varies from 4% to 18% (Fig. 1).
Larger rates are observed for car loans and mortgages
(two right boxes at Fig 4), than for consumer loans or
loan refinancing purposes (two left boxes there).
The mean rates rise when the loan maturity (term)
goes up. However, the dispersion of the observed rates
– on the contrary – shrinks when the maturity rises.
How Do Russian Banks Evaluate the Retail Credit Risks?
357

Table 1: Regression Output.
Determinan
t
PD_plan PD_fact PD_fact Rate_plan Rate_fact Rate_fact
Intercept -0.395 -0.948*** 7.199*** 10.124*** 6.416*** 7.419***
dt_march -1.191*** -2.262*** -1.214***
dt_nov
1.307*** -1.229** 0.779***
Loan Features
term 0.124*** 0.093** 0.128***
dg_CarLoan 2.565*** 2.743*** 2.340*** 1.930***
dg_CashLoan
-1.808*** 1.326***
dg_Refinance
-2.407*** 1.049**
Bank Features
CAR
-1.045*** 0.117***
R_
d
-0.690***
roe_fact
0.091***
roe_plan
-0.784***
t_foreign
-6.804*** -2.700*** -1.382***
t_governmen
t
0.893*** 1.423*** -3.910*** 2.451*** -0.623**
t_private -1.288*** -2.371*** -3.192*** 9.252*** 3.965***
t_irb 1.304*** 2.580*** 4.643*** 5.077***
t_listed
-5.403*** 12.824*** 5.421*** -0.728***
t_sifi
2.414*** -1.828** 3.446***
Observations 119 119 312 119 119 312
R2 0.361 0.516 0.235 0.427 0.443 0.287
Adjusted R2 0.333 0.495 0.220 0.391 0.408 0.264
F Statistic 8.818*** 35.079*** 41.025*** 403.069*** 401.519*** 19.378***
Note: *p<0.1; **p<0.05; ***p<0.01
We would also expect higher rates for larger loan
volumes. However, there is no clear pattern here.
We also switch to the PD data according to
formulas (2) and (3). PD proxy lies in the range of -
2% to +8% when we consider the planned ROE data.
Same time we do not observe material differences in
PD rankings when using planned or actual ROE
values. Using planned ones, allows us to benefit from
less observations with the negative PD estimates.
Such values are de facto feasible as, for instance, a
bank in our dataset offers lending rates for RUB 100k
at 7.9% and for RUB 1m at 6.9% when the break-
even level is 7.45%. Thus, the PD is -0.55% in the
latter case, while it is +0.45% in the former one.
More granular description of the independent
variables used in regression (1) is available in Table
2, its descriptive statistics come in
Table 4. Table 3
explains how we assigned bank-specific indicators to
particular banks.
3 RESULTS AND DISCUSSION
As a result, we test six model specifications. Three
models where the PD is a dependent variable (see PD
in the column header for specification (4)), and the
three ones where the offered lending rate is a
dependent one (see Rate in the column header for
specification (1)). The first two sub-columns within
each dependent variable type relate to the reduced set
of five banks (119 observations). For those banks we
run a regression with the planned ROE data in the first
column and with the actual one in the second column.
The third column relates to the enhanced data sample
of 19 banks (312 observations). For those we use only
the actual ROE values for comparability in-between
different banks. Results for the significant
coefficients are available in
Table 1. If interested, the
coefficients for all not-excluded variables are given in
Annex.
We are more confident to interpret the
determinants and their signs in case we do not see
controversies in between various specifications.
Thus, we observe that lending rates in March 2021
were lower, than in April by around 1-2 pp. (see
dt_march). We may remember that the Central Bank
raised the key rate from 4.5% to 5.0% p.a. on
April 23, 2021. However, this should not be priced in
the PD estimates as the PD is already cleaned from
the funding component. Unless the banks decided not
to increase the deposit rates after the policy rate hike,
but did it only for the lending rates.
Each RUB 1m adds around 0.1% to the risk (PD)
estimate, as well as to the lending rate (see term).
As for the loan types, the association measure for
the consumer and refinancing loans is mixed when
looking at the lending rate and it is insignificant when
looking at PD (see dg_CashLoan, dg_Refinance).
Thus, we may more confidently conclude that the car
loans are riskier than the mortgage ones by a level of
SES 2021 - INTERNATIONAL SCIENTIFIC-PRACTICAL CONFERENCE "ENSURING THE STABILITY AND SECURITY OF
SOCIO - ECONOMIC SYSTEMS: OVERCOMING THE THREATS OF THE CRISIS SPACE"
358

2-3 pp. As a result, the lending rate is also higher by
that magnitude (see dg_CarLoan). We may recall
here that the mortgage loans might be subsidized by
the government. That might be the reason for the
lower risk assessment in mortgages.
Interpreting actual ROE has a drawback of reverse
causality (endogeneity) that we did not control for.
The rates might be higher when the ROE target is
high. Same time high rates may imply high actual
ROE. To avoid such a discussion, we will look at the
planned ROE. Importantly, we find a statistically
significant negative sign for the lending rates. This
means the higher the target ROE is, the lower lending
rates the bank offers all else being equal. This is
exactly the illustration of the bank risk-taking
channel. The bank sets rates lower wishing to attract
more clients and expecting to thus earn more profit.
However, underpricing may result in extra losses and
most probably harm the profit targets.
As for the bank-specific features, we have several
quite robust findings. Foreign banks tend to
underprice risk by up to -7 pp. and offer lower loan
rates by 1-2 pp. That might be in part due to the use
of the parent company risk models. When latter are
calibrated in the developed economy, they might
yield over-optimistic risk estimates in the emerging
economy than they really are.
State-owned banks – at least in the reduced sample
– demonstrate higher risk evaluation and setting
higher rates than other banks by around 1-2 pp. This
may come from their more prudent or more
conservative credit policy when bank’s safety is a
higher priority than its earnings. However, the status
of a systemically important bank does not seem to
statistically significantly impact neither risk
assessment, nor the loan ultimate pricing.
Banks that applied for the IRB permission
systematically demonstrate higher risk-assessment by
1-2 pp. and set rates by 4-5 pp. higher. Such a
difference may come from banks using own default
statistics and thus being able to more correctly assess
the retail credit risk.
Private and listed banks demonstrate interesting,
though in part controversial trends. From one side,
they are likely to underprice the retail credit risk from
-1 to -5 pp. From another side, they tend to set lending
rates – on the opposite – higher by 4-12 pp.
To sum up, we find that Russian banks tend to
materially differently evaluate retail credit risk as
well as differently price retail loans. This echoes the
findings of the international prudential authority
(BCBS, 2013c), (BCBS, 2016) and the academic
researchers (Behn, et al., 2016). Some of the
differences may originate from the differences in
constraints applied to banks. For instance, IRB-banks
compute risk and risk-weights themselves to derive
the capital adequacy, whereas other banks are forced
to utilize predefined fixed risk-weights. Positive
coefficients for the IRB status imply that the
prudential predefined risk-weights might be more
optimistic as they under-assess the retail credit risk.
A sort of implication for a bank might be not to file
IRB application for a retail book as long as possible
to benefit from the lower prudential risk-weights and
CAR constraints.
4 CONCLUSIONS
Bank risk-taking is an important research stream
within the Central Bank. People wish to investigate
how risk-taking changes in response to changes in the
monetary policy (Repullo, 2004), (Jimenez, et al.,
2014).
The natural demonstration of the bank risk-taking
behaviour is how it assesses risks and how it sets the
lending rates afterwards. Earlier studies demonstrated
that banks tend to materially differ in risk-assessment
for the very same borrower (actual or hypothetical
ones) (BCBS, 2013c), (Behn, et al., 2016).
In this paper we wished to screen Russian banks
to verify whether they are different to their European
counterparts from the above studies. Generally, we
find out that Russian banks are not much different as
they also produce different risk estimates and offer
different lending rates after controlling for the
funding costs and the bank risk-appetite proxied by
actual and planned ROE values.
Our research is unique in several aspects. First, it
uses unique, though not extensive dataset on the loan
offered rated for the same person since late 2020.
Second, we are the first to identify the differences in
the risk perception by the Russian banks. Third, we
found that most probably Russian banks decided to
faster uplift the lending rates and their risk assessment
after the key rate increase in April 2021, rather than
to proportionately increase the deposit rates. Fourth,
we uniquely study the specifics in the IRB-banks
behaviour in Russia. To the best of our knowledge, no
one considered IRB as a separate differentiating
factor of Russian banks. The fair excuse is that most
researchers before focused on data prior to 2018 when
the first Russian banks launched IRB for CAR
computation. Fifth, we seem to have found not only
the determinants of the differences in risk-
perceptions, but have concrete policy implications.
We see that foreign banks and private banks tend to
underassess the retail risk compared to the state and
How Do Russian Banks Evaluate the Retail Credit Risks?
359

IRB-banks. This may come from the usage of the
parent datasets and models by foreign banks. On the
contrary, IRB-banks have Russian up-to-date default
data to be able to more adequately assess local risks.
This implies that the local standardized (fixed) risk-
weights might be too outdated and be too optimistic
in retail credit risk assessment compared to the IRB
risk-weights.
ACKNOWLEDGEMENTS
Opinions expressed in the paper are solely those of
the authors and may not reflect the official position of
the affiliated institutions.
REFERENCES
Gordy, M. B., Anatomy of credit risk models. In J. of
Banking and Finance. 24. pp. 119-149.
Behn, M., Haselmann, R., Vig, V., 2016. The Limits of
Model-based Regulation. European Central Bank
Working paper series.
Diebolt, F. X., 2015. Comparing Predictive Accuracy,
Twenty Years Later: A Personal Perspective on the
Use and Abuse of Diebolt-Mariano Tests. In J. of
Business & Economic Statistics. 33(1). pp. 1-9.
EBA releases its annual assessment of the consistency of
internal model outcomes for 2020, 2021. EBA.
Gordy, M. B., 2003. A risk-factor model foundation for
ratings-based bank capital rules. In J. of Financial
Intermediation. 12. pp. 199-232.
Gordy, M. B., Howells, B., 2006. Procyclicality in Basel
II: Can We Treat the Disease Without Killing the
Patient? In J. of Financial Intermediation. 15. pp. 395–
417.
Gordy, M. B., Lütkebohmert, E., 2013. Granularity
adjustment for regulatory capital assessment. In Int. J.
of Central Banking. 9(3). pp. 33-70.
Horny, G., Manganelli, S., Mojon, B., 2018. Measuring
Financial Fragmentation in the Euro Area Corporate
Bond Market. In J. of Risk and Financial
Management. 74(11). pp. 1-19.
Jimenez, G., Ongena, S., Peydro, J.-L., Saurina, J., 2014.
Hazardous times for monetary policy: what do twenty
three million bank loans say about the effects of the
monetary policy on credit risk-taking? In
Econometrica. 82(2). pp. 463-505.
Regulatory consistency assessment programme (RCAP) -
Analysis of risk-weighted assets for credit risk in the
banking book, 2013. BCBS.
Regulatory Consistency Assessment Programme (RCAP).
Assessment of Basel III risk-based capital regulations
– Argentine, 2016. BCBS.
Repullo, R., 2004. Capital requirements, market power,
and risk-taking in banking. In J. of financial
Intermediation. 13(2). pp. 156-182.
Vernikov, A., 2015. Russian bank data: Breaking down the
sample of banks by ownership. SSRN.
SES 2021 - INTERNATIONAL SCIENTIFIC-PRACTICAL CONFERENCE "ENSURING THE STABILITY AND SECURITY OF
SOCIO - ECONOMIC SYSTEMS: OVERCOMING THE THREATS OF THE CRISIS SPACE"
360

APPENDIX
Table 2: The Variables Description.
No. Variable Units. Source
D
escription Note
1 dt_march Dummy Banki.ru Indicator for March 2021 data; 1
2 dt_nov Dummy Indicator for November 2020 data 1
L
oan Features
3 amount RUB mln Banki.ru The loan amount that a client may choose
4 term Years Banki.ru The contract loan maturity when requested
5 dg_CarLoan Dummy Banki.ru Indicator for the loan to purchase a car, i.e., collateralized loan; 2
6 dg_CashLoan Dummy Banki.ru Indicator for the consumer loan (in Russian - 'Just Cash' or
'Prosto Den'gi'), i.e., UNcollateralized loan;
2
7 dg_Refinance Dummy Banki.ru Indicator for the loan to refinance an existing one; we cannot
definitely say whether it is collateralized or not (depends upon
the original loan type to be refinanced)
2
B
ank Features
8 CAR pp. Banki.ru The actual total capital adequacy ratio (N1.0); we use it as a
proxy for the share of equity in the total funding mix of a bank;
respectively, (1-CAR) is the proportion of the non-equity
funding
9 R_d pp. Banki.ru the cost of the non-equity funding. It is the deposit rate in local
currency (RUB) for the closest maturity to that of the loan. We
extract the rate from the same website, but from another
webpage devoted to deposits (we thank Denis Shibitov for help
in deposit data collection). We collapse our data by maturity
for all deposit offers. Thus, we take an average RUB deposit
rate for a bank on the eve of our loan data collection date
10 roe_fact pp. Banki.ru Actual return on equity (roe) on the eve (the preceding month)
to the loan data collection; we take it as one of the two costs of
equity funding. It is available for all banks
3
11 roe_plan pp. Authors Planned return on equity. We take it as a second proxy for the
equity funding component of a bank. We were able to publicly
find values for the five banks only
3
12 t_foreign Dummy Authors +
(Vernikov,
2015)
The indicator (FOR) that a bank has a foreign ownership stake;
generally speaking, it is a foreign bank subsidiary in Russia
2
13 t_government Dummy The indicator (GOV) that a bank has a state ownership
component; in common citizen's perception it is a government
(state-owned) ban
k
2
14 t_private Dummy The indicator that a bank is a local private bank, i.e., it has
neither foreign ownership, nor the state one
2
15 t_irb Dummy Authors The indicator that a bank has filed application for the use of the
Basel II own default statistics and own models; also known as
Internal-Ratings-Based Approach (IRB), regulated by local
legislation No. 483-P and 3752-U. At the moment of the
research preparation three Russian banks filed an application
for the IRB to the Central Bank, two of them (Sberbank and
Raiffeisen) fully run it since 2018 and 2019, respectively
4
16 t_listed Dummy Authors The indicator that a bank or its Russian subsidiary under
consideration is or was listed on the stock exchange in Russia
or abroad
17 t_sifi Dummy Authors The indicator that a bank belongs to the list of the domestic
systemically important banks (D-SIBs), or in other word is a
systemically important financial institution (SIFI)
Notes:
1) the respective regression coefficient signals for differences against recent (April 2021) data.
2) the respective regression coefficient is benchmarked against the mortgage loans.
3) we also call it the bank's risk-appetite.
4) see https://bosfera.ru
How Do Russian Banks Evaluate the Retail Credit Risks?
361

Table 3: Bank Features.
Regn Name Gov For Priv. IRB SIFI Listed* ROE_plan notes
316
Home Credit (OOO
"KHKF Bank") 1
354
Gazprombank (Bank GPB
(АO)) 11
429 PАO KB "UBRiR" 1
650
Postbank (PАO "Pochta
Bank") 1
902 PАO "Norvik Bank" 1
912 PАO "MInBank" 1
963 PАO "Sovkombank" 1
1000 Bank VTB (PАO) 1 1 VTB 15% 1
1326 АO "АL'FА-BАNK" 1 1 1 1 15% 2
1481 PАO Sberbank 1 1 1 SBER 20% 3
1810
"Аziatsko-Tikhookeanskij
Bank" (PАO) 1
1978
PАO "MOSKOVSKIJ
KREDITNYJ BАNK" 1 1 CBOM
2209 PАO Bank "FK Otkrytie" 1 1 OPEN 18% 4
2673 АO "Tin'koff Bank" 1 TCS LI 30% 5
2707 KB "LOKO-Bank" (АO) 1
2776 OOO "АTB" Ban
k
1
3073 PАO "RGS Bank" 1
3138 АO "Bank BZHF" 1
3251 PАO "Promsvyaz'bank" 11
3292 АO "Rajffajzenbank" 111
3354
KB "Renessans Kredit"
(OOO) 1
Notes: * where applicable, a ticker is given; if a unity is not marked for a dummy, a zero value is used.
1) https://www.vtb.ru
2)https://alfabank.ru
3) Statement by VTB IB analyst team for the Sberbank valuation, made on April 12, 2021.
4) https://cdn.open.ru
5)https://acdn.tinkoff.ru
Table 4: Descriptive Statistics for The Considered Independent Variables.
119 obs (5 banks) 312 obs (19 banks)
Variable Mean St.Dev. Min Max Mean St.Dev. Min Max
dt
_
march 0.34 0.48 0 1 0.21 0.41 0 1
dt_nov 0.18 0.38 0 1 0.32 0.47 0 1
Loan Features
amount 1.38 1.27 0.1 3 1.32 1.22 0.1 3
ter
m
6.20 3.98 3 20 6.11 3.74 3 20
d
g_
CarLoan 0.31 0.46 0 1 0.28 0.45 0 1
d
g_
CashLoan 0.25 0.44 0 1 0.41 0.49 0 1
dg_Refinance 0.32 0.47 0 1 0.22 0.42 0 1
Bank Features
CAR 12.78 1.09 11.20 15.42 14.25 5.95 3.70 54.11
R
_d
4.19 0.75 1.56 5.52 4.31 0.79 1.56 5.52
roe
_
fact 27.37 15.31 4.12 58.53 13.81 20.75 -53.29 64.95
roe_plan 19.77 6.50 15.00 30.00
t_foreign 0.21 0.41 0.00 1.00 0.18 0.39 0.00 1.00
t_gove
r
nment 0.51 0.50 0.00 1.00 0.37 0.48 0.00 1.00
t
_p
rivate 0.49 0.50 0.00 1.00 0.53 0.50 0.00 1.00
t
_
irb 0.25 0.44 0.00 1.00 0.16 0.37 0.00 1.00
t
_
liste
d
0.25 0.41 0.00 1.00 0.32 0.47 0.00 1.00
t_sifi 0.72 0.45 0.00 1.00 0.40 0.49 0.00 1.00
SES 2021 - INTERNATIONAL SCIENTIFIC-PRACTICAL CONFERENCE "ENSURING THE STABILITY AND SECURITY OF
SOCIO - ECONOMIC SYSTEMS: OVERCOMING THE THREATS OF THE CRISIS SPACE"
362

Table 5: Regression output with all variables included.
Determinant PD
_p
lan PD
_
fact PD
_
fact Rate
_p
lan Rate
_
fact Rate
_
fact
Intercept -0.010 -1.003** 4.327*** 10.068*** 6.175*** 7.650***
dt
_
march -1.303*** -2.393*** -1.355** -0.421 -0.978** -0.520
dt_nov -0.887* 0.003 0.890* -1.495** -0.223 0.595*
Loan Features
amount -0.013 -0.068 0.195 -0.030 -0.054 0.075
ter
m
0.079 0.097 0.076 0.007 0.020 0.129***
dg_CarLoan 1.668* 2.957*** 2.561*** 0.921 1.668** 2.116***
d
g_
CashLoan -1.253 -0.168 2.289*** -1.193 -0.554 1.439**
dg_Refinance -0.869 0.509 2.324*** -1.649** -0.863 1.189*
Bank Features
CAR 0.528 -0.743 0.105***
R_
d
-0.000 -0.440 -0.765***
roe
_
fact 0.074*** -0.006
roe_plan -1.111*
t
_
forei
g
n -0.709 -0.759 -6.495*** -4.113 1.066 -0.726
t_government 0.946*** 1.203*** -3.688*** -0.392 2.247*** -0.474
t_private -0.955* -2.206*** -2.942*** 10.460*** 3.928*** 0.238
t
_
irb 2.154 2.764** 0.062 4.810 3.003 -0.712
t_liste
d
0.699 -0.245 -5.343*** 14.181*** 5.109*** -0.620
t
_
sifi 0.237 0.444 2.643*** -4.505 3.313*** 0.117
Observations 119 119 312 119 119 312
R2 0.389 0.523 0.253 0.446 0.465 0.296
Adjusted R2 0.332 0.479 0.221 0.377 0.399 0.258
Residual Std.
Erro
r
2.098
(df=108)
2.243
(df=108)
4.168
(df=298)
1.682
(df=105)
1.652
(df=105)
2.189
(df=295)
F Statistic 4.765*** 18.982*** 20.699*** 252.347*** 263.071*** 15.820***
df
(df=10;
108
)
(df=10;
108
)
(df=13;
298
)
(df=13;
105
)
(df=13;
105
)
(df=16;
295
)
Note: *p<0.1; **p<0.05; ***p<0.01
How Do Russian Banks Evaluate the Retail Credit Risks?
363
