
Strengthening Financial Stability based on the Factor Forecast of
Profitability of the Enterprise
Natalia Aleksandrovna Voronina
1a
, Elena Gennadyevna Zhulina
1b
,
Natalia Yuryevna Sadchenko
2c
and Elena Aleksandrovna Yurmanova
1d
1
Yuri Gagarin State technical university of Saratov, Saratov, Russia
2
Volga region cooperative Institute of Russian University of cooperation, Engels, Russia
Keywords: financial stability, assessment, factors, forecast, profitability of activities, equity, correlation and regression
analysis, methodology.
Abstract: The article presents the materials of theoretical and empirical studies of the influence of factors on such a
significant indicator of the activities of enterprises and organizations as profitability. In the theoretical part of
the work, the types of factor analysis are considered; the importance and necessity of using correlation and
regression analysis in the study of the influence of factors on the profitability of the organization's activities
are justified; the conditions and tasks of using this type of analysis are described. In the practical part of the
work, the described methodology for analyzing the influence of factors on the profitability indicator was
tested on the example of BioVitrum M LLC, which sells medical laboratory and diagnostic equipment. The
assessment of the degree of influence of factors on the change in the profitability of the analyzed enterprise
was carried out on the basis of data for 2014-2019. For the purposes of evaluation, the method of stochastic
modeling, such as correlation and regression analysis, was used. On the basis of the constructed regression
model, the forecast level of profitability of the activities of LLC "BioVitrum M" was determined, which was
formed under the influence of the growth of equity capital, and contributes to the strengthening of the financial
stability of the enterprise.
1 INTRODUCTION
In modern economic conditions, the efficiency of any
enterprise is evaluated using various indicators. In
turn, the value of the company's performance
indicators is formed under the influence of various
factors, the totality of which can be divided into
objective and subjective, external and internal factors.
The final result of the activity, which acts as a
generalizing indicator of the effectiveness of the
functioning of any organization, is the indicator of
profitability.
The study of various groups of factors and the
assessment of their impact on the change in the
performance indicators and sustainability of the
organization, the identification of existing reserves is
possible through competent management. In this
a
https://orcid.org/0000-0003-1415-8290
b
https://orcid.org/0000-0002-7464-3100
c
https://orcid.org/0000-0002-9297-8385
d
https://orcid.org/0000-0002-4361-1755
regard, the importance and necessity of using
correlation and regression analysis in the study of the
influence of factors on the profitability of an
organization is justified; the conditions and tasks of
using this analysis, and the stages of its practical
implementation are described (Tarasova, 2019;
Shokumova, 2019; Shchepkina, 2019). In the
practical part of the work, on the basis of this
methodology, the key factor of influence on the
profitability indicator of LLC "BioVitrum M" and its
financial stability is determined.
2 MATERIALS AND METHODS
Factor analysis is used to analyze profitability and the
factors that influence it (Savitskaya, 2014). This
Voronina, N., Zhulina, E., Sadchenko, N. and Yurmanova, E.
Strengthening Financial Stability based on the Factor Forecast of Profitability of the Enterprise.
DOI: 10.5220/0010698000003169
In Proceedings of the International Scientific-Practical Conference "Ensuring the Stability and Security of Socio-Economic Systems: Overcoming the Threats of the Crisis Space" (SES 2021),
pages 253-258
ISBN: 978-989-758-546-3
Copyright
c
2022 by SCITEPRESS – Science and Technology Publications, Lda. All rights reserved
253
methodological toolkit allows us to identify the
degree of influence of each factor on the overall
change in the final result (Kogdenko, 2016).
The type of factor analysis – deterministic or
stochastic (Galchina, 2009) - is determined by the
nature of the relationship under study. Using this
methodological approach involves performing the
following actions: determining the factors that affect
the performance indicator, grouping these factors and
systematizing them, modeling the relationship
between the factors and the performance indicator,
assessing the degree of influence of each factor on the
result, as well as identifying the reserves for growth
of the performance result and formulating a
management decision on this basis (Ponomarenko,
2014; Voronina, 2018; Zhulina, 2020).
A specific mathematical equation obtained during
the analysis and evaluation allows us to measure the
role of a single factor in the formation of the final
estimated indicator (Voronina, 2015). At the same
time, stochastic (regression) modeling serves as a
supplement to deterministic factor analysis and is
used in cases where the factors cannot be combined
in one model, or the complexity of the factors cannot
be estimated by a single quantitative indicator. Using
correlation and regression analysis, the degree of
tightness of the relationship between the sets of
indicators is established and an analytical expression
of the stochastic dependence between the studied
features is formed (Voronina, 2015; Voronina, 2020).
The practical use of correlation and regression
analysis involves the construction of models of this
type using ready-made software packages, such as
Statistica, MathCad, MatLab, applications in Excel,
etc. (Kundakchyan, 2014).
3 RESULTS AND DISCUSSION
Testing of the described method was carried out on
the materials of LLC "BioVitrum M", which sells
medical laboratory and diagnostic equipment. To
assess the degree of influence of factors on the change
in the profitability of the activities of LLC
"BioVitrum M" for 2014-2019, such a method of
stochastic modeling as correlation and regression
analysis was used.
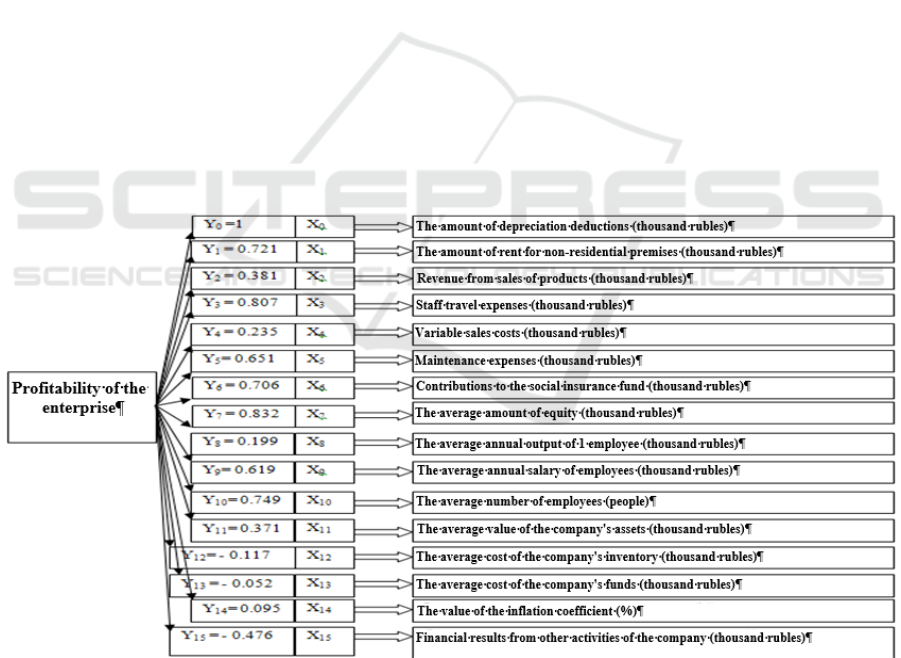
For the purpose of the assessment, a list of factors
that affect the effective indicator of the profitability
of the organization (Y) was determined, and the
coefficients of the pair correlation between the factors
were calculated (Fig. 1).
Figure 1: Values of paired correlation coefficients between factors affecting the level of profitability of the enterprise
Based on the determination of the "weight" of the
indicators and their ranking by the degree of
decreasing relationship (Table 1), only factors X
7
and
X
10
were taken into account to exclude
multicollinearity (the other factors were excluded
from the model construction).
SES 2021 - INTERNATIONAL SCIENTIFIC-PRACTICAL CONFERENCE "ENSURING THE STABILITY AND SECURITY OF
SOCIO - ECONOMIC SYSTEMS: OVERCOMING THE THREATS OF THE CRISIS SPACE"
254

Table 1: Calculation of the specific weight of influence factors.
Indicator
Correlation coefficient
Sum of coefficients
"Weight" of the
indicator
K
i
|K
i
|
Х
7
0.832 0.832
7.781
10.69
Х
3
0.807 0.807 10.38
Х
1
0.765 0.765 9.83
Х
10
0.749 0.749 9.63
Х
0
0.721 0.721 9.27
Х
6
0.706 0.706 9.07
Х
5
0.651 0.651 8.37
Х
9
0.619 0.619 7.96
Х
15
-0.476 0.476 6.12
Х
2
0.381 0.381 4.90
Х
11
0.371 0.371 4.78
Х
4
0.235 0.235 3.02
Х
8
0.199 0.199 2.56
Х
12
-0.117 0.117 1.51
Х
14
0.095 0.095 1.23
Х
13
-0.052 0.052 0.67
The empirical formula (mathematical model) for
the dependent variable "Profitability of the
enterprise" due to the factors X
7
and X
10
was formed
using the Excel software package. For these purposes,
the functions LINEAR (linear approximation) and
LGRFPRIBL (exponential approximation) were
used. The results of the calculations are presented in
Tables 2, 3.
Table 2: Results of calculation of linear regression indicators.
Constant 1 Constant 0
m
n
= 0.0222 m
n-1
= 8E - 05 b = 0,517
m
n
= 0.04 m
n-1
= 6E - 05 b = 0
S
en
= 0.0477 S
en-1
= 6E - 05 S
eb
= 1.32
S
en
= 0.01 S
en-1
= 4E -05
# No data
available
R
2
= 0.713 S
ey
= 0.438
# No data
available
R2 = 0.971 S
ey
= 0.3887
# No data
available
F = 3.7274 Df = 3
# No data
available
F = 67.19 Df = 4
# No data
available
Ssreg = 1.4288 Ssresid = 0.575
# No data
available
Ssreg = 20.3 Ssresid = 0.6044
# No data
available
Table 3: Results of calculation of exponential regression indicators (constant 1).
Constant 1 Constant 0
m
n
= 1.0125 m
n-1
= 1 b = 0.8175 m
n
= 1.005 m
n-1
= 1 b = 1
S
en
= 0.023 S
en-1
= 3E - 05 S
eb
= 0.6345 S
en
= 0.005 S
en-1
= 0
# No data
available
R2 = 0.7874 S
ey
= 0.2105
# No data
available R2 = 0.939 S
ey
= 0.19
# No data
available
F = 5.5539 Df = 3
# No data
available F = 30.83 Df = 4
# No data
available
Ssreg = 0.4922 Ssresid = 0.1329
# No data
available Ssreg = 2.118 Ssresid = 0.14
# No data
available
The choice of the model that allows the most
accurate description of how close the equation
approximates the actual data was carried out on the
basis of the determinism coefficient (R
2
).
For the linear type of dependence (equation of the
form y(x) = b
0
+ b
1
ꞏ x), the value of R2 was 0.713.
For the linear form of dependence (equation of the
form y(x) = b ꞏ x) the value of R2 was 0.971.
Strengthening Financial Stability based on the Factor Forecast of Profitability of the Enterprise
255

For the exponential type of dependence (equation
of the form y(x) = b
0
ꞏ b
х
1
) , the value of R2 was
0.787.
For the exponential type of dependence (equation
of the form y(x) = b
х
) , the value of R2 was 0.939.
The highest value of the determination coefficient
was obtained for a model of the form y(x) = b
1
ꞏ x
1
+
b
2
ꞏ x
2
. In this regard, the quality of the model was
evaluated according to the Student and Fisher criteria.
The evaluation was carried out by comparing the
calculated values with the data in the tables.
The calculated value of the Fischer F-test for our
model was obtained at the level of 50,389.
The critical value of this statistic corresponds to F
Table
(0.05; 2; 3) = 9.552 (table 4).
Since F
is calculated
> F
table
, the regression equation
can be considered adequate, that is, the constructed
model of the dependence of the profitability of the
enterprise on such factors as the average size of equity
and the average number of employees explains 97.1%
of the total variance of the Y attribute:
Y = 0.00006 ꞏ X
7
+ 0.04 ꞏ X
10
Y 0,00006*X
0,04*X
. (1)
Table 4: estimated performance of the model according to the Fisher F-criterion and the Student's coefficient (t-criterion).
F
Estimated
F
table
Regression equation Factor t t Significance
50.389 9.552 is adequately Х
7
3.001 2.776 significant
Х
10
2.262 2.776 insignificant
The evaluation of the model quality according to
the Student's criterion (Kuznetsova, 2019), taking
into account the level of significance (α = 0.05) and
the number of degrees of freedom (n - 2), showed the
significance of the factor X10 as not significant (t
is
observed
< t
of the criterion
) (Table 4). Therefore, the
"average headcount" factor was also excluded from
the model.
Thus, the model of the influence of factors on the
level of profitability of activities has received the
form of the equation of paired (one-factor) regression.
The initial data for modeling the relationship
between the level of profitability of the activities of
LLC "BioVitrum M" and the value of the average size
of the company's equity are presented in Table 5 and
in the form of a scatter plot, which shows the presence
of such a relationship (Fig. 1).
Table 5: Initial data for constructing the regression model.
Period
Profitability of activity of LLC
"BioVitrum M", %
The average equity capital
,
RUB ths
2014 1.16 578
2015 1.23 1,881
2016 1.35 3,811
2017 2.64 9,092
2018 1.87 12,155
2019 2.40 13,050
The average value of the indicato
r
1.78 6,761
Figure 1: The dependence of the profitability (y) of the activities of LLC "BioVitrum M" on the average size of equity.
Linear(Y)
Theaveragevalueofequity,thousandrubles.
Profitabilityof
operations,%
SES 2021 - INTERNATIONAL SCIENTIFIC-PRACTICAL CONFERENCE "ENSURING THE STABILITY AND SECURITY OF
SOCIO - ECONOMIC SYSTEMS: OVERCOMING THE THREATS OF THE CRISIS SPACE"
256
Using the MS Excel software package "Data
Analysis", the regression equation was constructed on
the basis of the obtained source data:
Y = 1.113234423 + 0.000097877 ꞏ X
7.
Y 0,00006*X
0,04*X
. (2)
The results of the correlation analysis conducted
by MS Excel allowed us to obtain the following
results (Table 6).
The multiple correlation coefficient (r =
0.83211833) characterizes a strong relationship
between the dependent and independent variables of
the constructed model.
The coefficient of determination (R
2
=
0.69242092) shows that the variation in the values of
the profitability indicator of the enterprise by 69.2%
depends on the size of the equity capital. The
influence of unaccounted factors on the profitability
of the enterprise in the resulting model is 30.8%.
The value of the standard error (in our calculation
"0.392527571") means that the deviation of the actual
value of the profitability indicator from the projected
values is no more than 0.39 percentage points.
Table 6: Results of the correlation analysis conducted by MS Excel.
Indicator Regression statistics
Multiple R 0.83211833
R-square 0.69242092
Normalized R-square 0.61552615
Standard error 0.39252757
Coefficients: Y-intersection 1.11323442
Х
7
9.7877Е – 0,5
t-statistics: Y-intersection 4.083701
Х
7
3.000798
The free term of the equation (b
0
= 1.11323442)
shows that the value of the profitability indicator in
the absence of the X7 factor will be at the level of
1.113234423%.
The regression coefficient (b
1
= 0.000097877)
shows that with an increase in the amount of equity
by 1 thousand rubles, the expected increase in the
profitability of activities will be 0.000097877
percentage points.
Checking the obtained model by the F-criterion
showed that the regression equation is considered
adequate.
Checking the significance of the model at the five
percent significance level (t
b0
= 4.0837, t
b1
= 3.0008)
showed a linear relationship between the indicators.
Further, on the basis of the constructed regression
model, the forecast of the values of the profitability
indicator of the analyzed enterprise was determined,
subject to an increase in the amount of equity by
7.36% (similar to the growth rate of the indicator in
2019). The results of the calculations are shown in
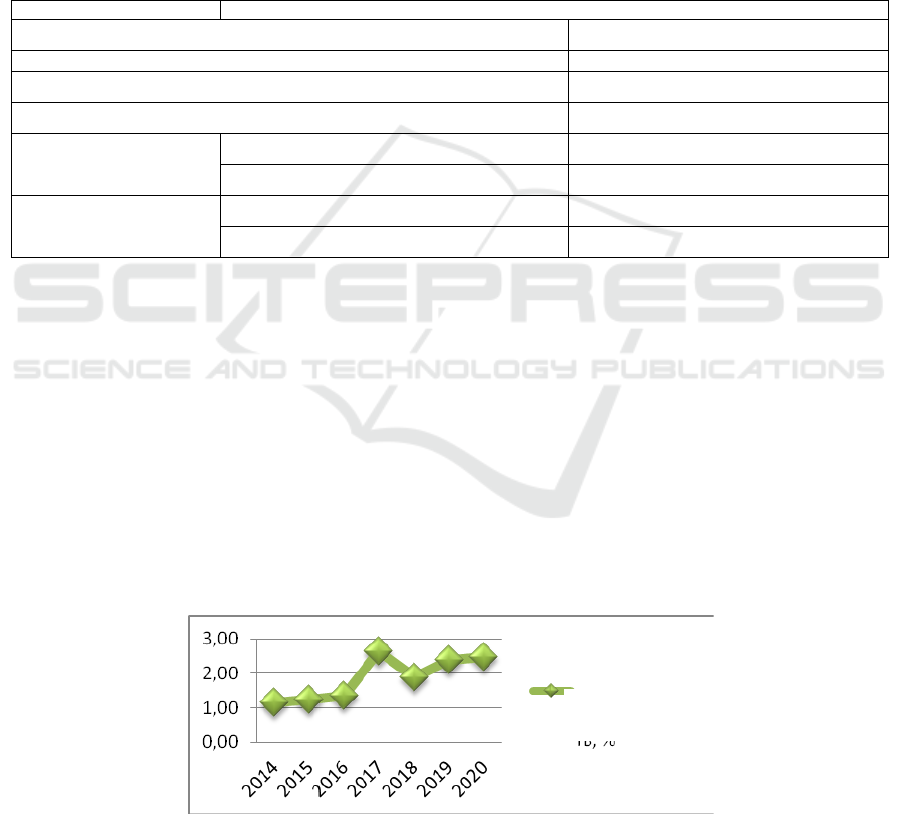
Fig. 2.
The analysis of forecast calculations shows that
with an increase in the amount of equity by 7.36%,
the forecast value of the level of profitability of the
enterprise will be 2.49% (with 2.40% in 2019).
Figure 2: Forecast of the values of the profitability indicator of LLC "BioVitrum M"
Profitability,%
Strengthening Financial Stability based on the Factor Forecast of Profitability of the Enterprise
257

4 CONCLUSIONS
To assess the degree of influence on the performance
indicator – the profitability of the activities of LLC
"BioVitrum M" of individual factors, a sample was
conducted and 15 characteristics of the activities that,
according to experts, have a significant impact were
identified. The results of the correlation and
regression analysis showed that of all the factors
listed, only one (the amount of equity) is in a
significant linear relationship with the resulting
indicator and actually affects the change in the level
of profitability of the enterprise. Thus, it was proved
that the growth of the amount of equity capital leads
to an increase in the efficiency of activities,
acceleration of the mobilization of own sources and
strengthening of the financial stability of the
enterprise.
REFERENCES
Vasilyeva, E.K., Lyalin, V.S., 2017. Statistics: textbook.
Moscow.: UNITY-DANA.
Voronina, N.A. 2015. Methodology for the study of the
impact of factors on the financial results of the
organization. Scientific review: theory and practice.
Voronina, N.A., Kuznetsova, I.V., 2018. Theory and
practice of studying the influence of factors on the
financial performance of enterprises. Saratov: Limited
Liability Company "Institute for Research and
Development of Professional Competencies".
Voronina, N.A., Kuznetsova, I.V., Zhulina, E.G., 2020.
Model of the evaluation of population living standards
dependence on the sphere of services development.
Quality - Access to Success.
Zhulina, E.G., 2020. Management of the company's
profitability reserves. IV International scientific and
practical Conference "Scientific dialogues in the era of
innovative transformations of society". Saratov:
Limited Liability Company "Institute for Research and
Development of Professional Competencies".
Kogdenko, V.G., 2016. Economic analysis. Moscow.
UNITY-DANA.
Kundakchyan, R.M., Zulfakarova, L.F., 2014. Current
issues of optimal capital structure based on forecasting
financial performance of the company. In LIFE
SCIENCE JOURNAL.
Ponomarenko, M. A., 2014. Classification of factors
affecting the financial condition of the enterprise
International Scientific Conference. "Innovative
Economy". Kazan: Buk .
Savitskaya, G.V., 2014. Methodology of complex analysis
of economic activity. Moscow. INFRA-M.
Shchepkina, N., 2019. Assessment of the economic
efficiency of the innovative development of industrial
enterprises. E3S WEB OF CONFERENCES
International Scientific Conference «Construction and
Architecture: Theory and Practice for the Innovation
Development», CATPID.
Tarasova, A.Yu., Burykin, A.D. Methodological
approaches to the analysis of the financial results of the
enterprise. In Economics and Management: problems,
solutions.
Shokumova, R.E., 2019. Analysis of factors affecting the
financial performance of the enterprise. In Economy
and entrepreneurship.
Kuznetsova, O.A., Mazurmovich, O.N., 2019.
Econometrics. Samara: Samara University Publishing
House.
SES 2021 - INTERNATIONAL SCIENTIFIC-PRACTICAL CONFERENCE "ENSURING THE STABILITY AND SECURITY OF
SOCIO - ECONOMIC SYSTEMS: OVERCOMING THE THREATS OF THE CRISIS SPACE"
258
