Visualization of Human Motion via Virtual Reality Interface and
Interaction based on It
Akihiro Sakurai
1
, Yosuke Ikegami
1
, Milutin Nikoli´c
2
, Yoshihiko Nakamura
3
and Ko Yamamoto
1
1
Graduate School of Information Science and Technology, University of Tokyo, Tokyo, Japan
2
Faculty of Technical Science, University of Novi Sad, Vojvodina, Serbia
3
Human-Motion Data Science Laboratory, Research into Artifact Center for Engineering, University of Tokyo, Tokyo, Japan
Keywords:
Virtual Reality, Motion Capture, Musculoskeletal Model, Sport Analysis.
Abstract: This paper presents the concept of ecological sports training and the initial developments based on biomechan-
ics analysis, VR technologies, and visualization of interaction. Computation algorithms in robotics have been
applied to biomechanics analyses including muscle force estimation. These technologies are widely used for
the self-biomechanics training, in which an athlete accesses and evaluates the analyzed results on his/her own
motions and will necessarily move toward the ecological training that considers interactions with the counter-
part and the environment in a sport game. We develop a VR visualization system of musculoskeletal analysis
that provides a realistic experience of the interactions to an athlete. We also report an initial evaluation of the
interactions with the virtual counterpart in the virtual environments through the VR system.
1 INTRODUCTION
Biomechanics is the basis of sports training. Tech-
nologies have been developed and widely used to fa-
cilitate the self-biomechanics training, which implies
a training where an athlete by oneself accesses scien-
tific evaluation and objective advice (Yoo et al., 2020)
(Maroto-Izquierdo et al., 2019). The analysis of mus-
culoskeletal activity exists as one of the methods of
motion analysis (Hill, 1938) (Stroeve, 1999) (Naka-
mura et al., 2005). And an application is being de-
veloped to visualize these results so that they can be
easily understood by non-specialists, subjects them-
selves (Murai et al., 2010). However, since many
sports are played not only by oneself but also by com-
peting against other competitors, in teams, or by in-
teracting with the surrounding environment, analysis
of only one subject is insufficient. Therefore, it is
necessary to develop ecological training that includes
others surrounding the subject. Ecological training is
a type of training that involves not only oneself, but
also others and the environment proposed by Davids
and Handford (Davids et al., 1994) (Handford et al.,
1997). The possibility of stimulation from environ-
ments other than oneself is called affordance and is
proposed by Gibson (Gibson, 2014). By recreating an
environment with an affordance like that of a game,
the player can train with an understanding of not only
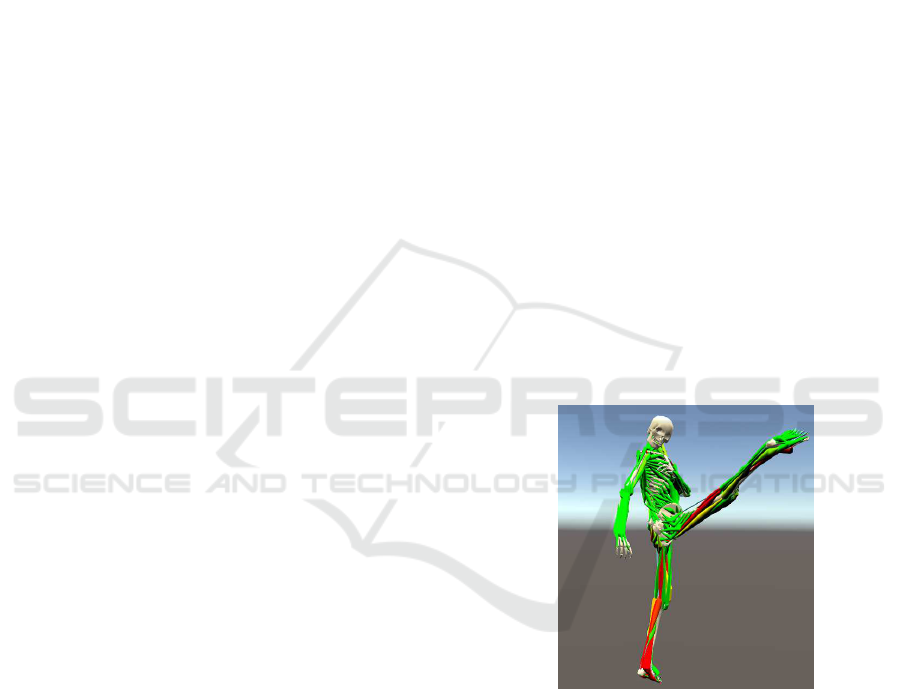
Figure 1: Visualization of musculoskeletal analysis on a
taekwondo kick motion measured by IMU-based motion
capture suite.
oneself but also the surroundings. In this study, we
define it as training that is conducted by presenting
others and environments other than oneself.
When ecological training is conducted, it is inad-
equate to reproduce the actual game or training en-
vironment by using conventional monitors for pre-
sentation. But the use of a VR headset during the
presentation increases the realism of the environment
and helps to build a training method that replicates
the environment surrounding the player. Reproduc-
ing the surrounding environment allows the subject
130
Sakurai, A., Ikegami, Y., Nikoli
´
c, M., Nakamura, Y. and Yamamoto, K.
Visualization of Human Motion via Virtual Reality Interface and Interaction based on It.
DOI: 10.5220/0010688800003059
In Proceedings of the 9th International Conference on Sport Sciences Research and Technology Support (icSPORTS 2021), pages 130-137
ISBN: 978-989-758-539-5; ISSN: 2184-3201
Copyright
c
2021 by SCITEPRESS – Science and Technology Publications, Lda. All rights reserved

to play under the influence of them and us (including
the subject) to analyze their movements. Some stud-
ies of VR training and analysis has been conducted by
recreating environment. In sports, analysis of the dif-
ference in skills between advanced and novice play-
ers has been conducted, as well as controlled exper-
iments on the level of improvement when using VR
and when not using VR (Hosp et al., 2020) (Petri
et al., 2019) (Kimura et al., 2018). In other fields, VR
simulators for heavy machinery such as construction
site cranes and forklifts are being developed (Tech-
nologies, 2021), and research is being conducted on
drilling drill proficiency training (Zhang, 2017).
In order to support the ecological training method,
this study aims to develop a training method in which
the player is presented with a space that reproduces
the competition opponent and the surrounding envi-
ronment using VR, and the player can compete under
the influence of each other and analyze the movement.
In this case, the results of musculoskeletal analysis,
which is the result of biomechanical analysis of the
athlete, can be presented for use in ecological train-
ing. In this report, we developed a method to visu-
alize the results of biomechanical analysis presented
to players. In addition, we verified the reproducibility
of the interaction with the opponent and surrounding
environment in the VR space compared to the real en-
vironment by bidirectional walking.
2 MUSCULOSKELETAL MODEL
VISUALIZATION
2.1 Visualization Flow
In this study, we use a wire approximation model of
muscle (Nakamura et al., 2005). This model uses in-
verse kinematics to calculate the position and posture
of the skeleton from the 3D positions of markers that
represent the positions of body parts. The muscle
wires are basically attached to the skeleton, and from
the obtained skeletal motion and mechanical parame-
ters, the wire tensions are optimized using inverse dy-
namics, assuming that the sum of the squares of the
wire tensions is minimized.
The musculoskeletal rendering method using this
wire model (Murai et al., 2009) was based on
OpenGL, which doesn’t allow for fast and detailed
real-time rendering and display in VR headset. To
solve this problem, we implemented a fast-rendering
method using Unity, which is a development environ-
ment that supports a variety of platforms. In addition,
in the real-time rendering of muscles, polygon rupture
CPU
Musculoskeletal analysis
Forward Kinematics
Muscle raw shaping
Interpolating
Coloring
Joint angles
Muscle tensions
Image output
Muscle activity
GPU
Geometry shader
Wire vertices
Figure 2: Musculoskeletal visualize flow. Polygon position
calculation is divided to CPU part and GPU part.
occurs when rendering diffraction shapes, causing a
sense of discomfort, but we have solved this prob-
lem by rendering detailed muscle shapes. And by us-
ing geometry shader which increases the number of
polygons in GPU simultaneously, we distribute cost
between the CPU and GPU and improve processing
speed. The flow of the visualization process is shown
in Figure. 2. Joint angles and muscle tensions are
obtained from the results of musculoskeletal analysis.
From the joint angles, the wire vertices of the mus-
cle can be obtained by solving forward kinematics on
the CPU, which are input to the GPU to calculate the
muscle shape using a geometry shader. Muscle ten-
sions are used as input to the GPU for coloring them.
The final screen output is obtained through the above
processing.
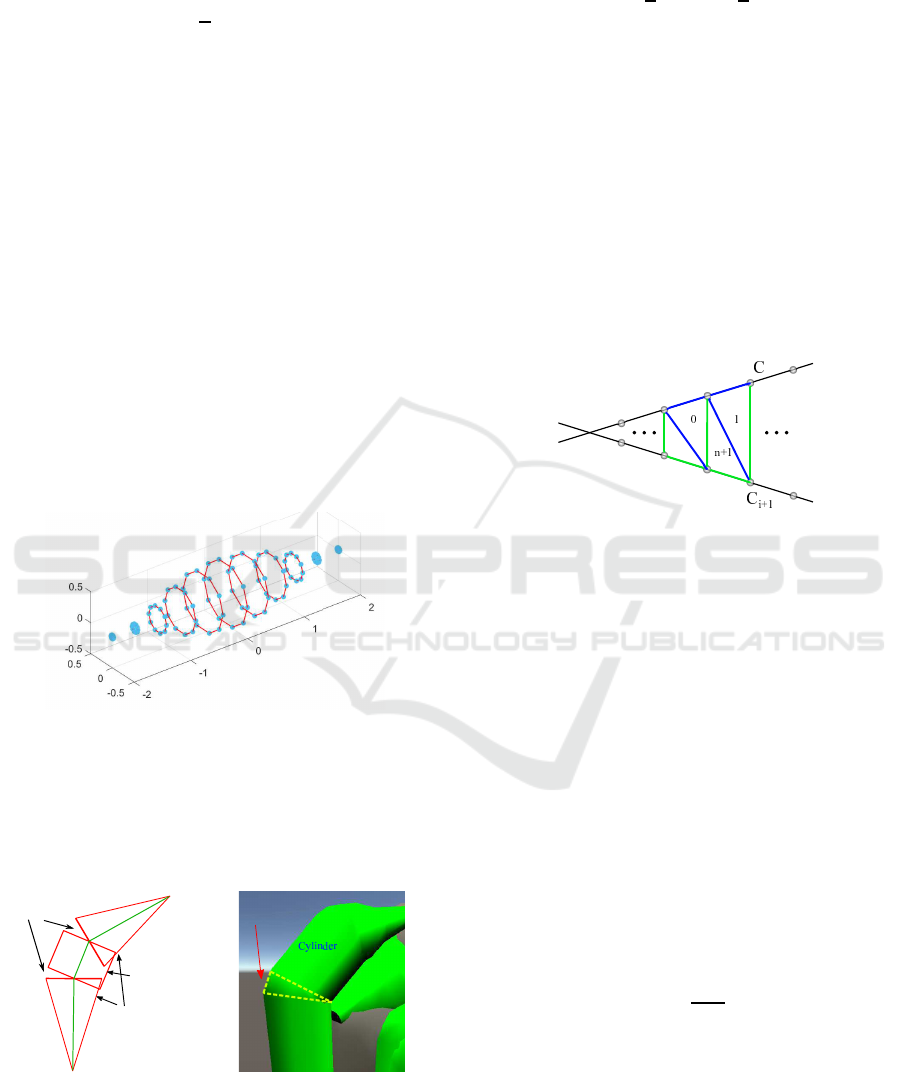
2.2 Creation of Muscle Shape Polygons
We create a muscle-like appearance while avoiding
tearing of the diffraction shape by using the wire mus-
cle model (Nakamura et al., 2005). Let the wire ver-
tices of the muscle be p
0
, p
1
,·· · , p
n−1
in order. p
0
is
the origin point and p
n−1
is the arrest point. The other
vertices are defined as passing points. Obtain a circle
C
i
orthogonal to the line connecting p
i
and p
i+1
. C
i
is
represented by two vectors u
i
and v
i
that are orthogo-
nal to each other.
t = p
i+1
− p
i
(t = (t
x
,t
y
,t
z
)) (1)
a
i
= (0,t
z
,−t
y
) (2)
b
i
= (t
2
y
+ t
2
z
,−t
x
t
y
,−t
x
t
z
) (3)
u
i
=
a
i
|a
i
|
,v
i
=
b
i
|b
i
|
(4)
The radius of this C
i
is changed to create the spin-
dle shape of the muscle. To reproduce the spindle
Visualization of Human Motion via Virtual Reality Interface and Interaction based on It
131
shape of the muscle, the radius is calculated using the
quadratic function.
f(x) =
p
4
(x
2
− a
2
)
2
(5)
f(0) = pa
4
/4 is the maximum radius of the mus-
cle, which is proportional to the maximum force of
the muscle. The spindle shape is created as shown
in Figure. 3. If one of the two points representing
the line l
i
is the origin or arrest point, a half spindle-
shaped polygon is created; otherwise, a cylindrical
polygon is created. At this time, there is a gap be-
tween the polygons near the transit point due to the
diffraction shape as shown in Figure. 4.
To fill this gap, we create new triangular polygons
by connecting the polygons on the two orthogonal
circles on the passing point. Let the two orthogo-
nal circles on the passing point be C
i
and C
i+1
, and
the unit vectors representing each circle be u
i
,v
i
and
u
i+1
,v
i+1
. At this time, the degree of the polygon gap
changes depending on the bending angle of the wire
on the target passing point. Therefore, the interpola-
tion method is changed according to the bending an-
gle, and appropriate interpolation is performed.
Figure 3: Shuttle 3d polygon points. Each circle radius is
due to f(x) = p(x
2
− a
2
)
2
/4.
2.2.1 When the Bending Angles is 120
◦
or More
Let the radius of the orthogonal circle be r. At this
time, the polygon vertices on C
i
are obtained when
Cylindrical shape
Spindal shapes
Polygon gaps
Figure 4: Polygon gap by
the wire bending. Green
line shows wired muscle.
Red triangles and rect show
created muscle polygons.
Interpolatring
polygons
Spindal
shape
shape
Figure 5: Polygon gap on
the passing point is interpo-
lated.
the circles are approximated by regular n-gon.
q
ij
= p
i
+ r(u
i
cos2π
j
n
+ v
i
sin2π
j
n
) (0 ≤ j < n)
(6)
Select the vertices t
k,0
,t
k,1
,t
k,2
, which consist the
triangle polygon t
k
, from on each orthogonal circle so
that the each distance between the polygon vertices is
minimized.
t
k,0
= q
i, j
(7)
t
k,1
= q
i+1, j+1
(8)
t
k,2
=
(
q
i+1, j
(0 ≤ k < n)
q
i, j+1
(n ≤ k < 2n)
(9)
This selection of vertices interpolates the gap with
a total of 2n triangular polygons as shown in Figure.
6.
t t
t
n
t
i
Figure 6: Polygon gap creation from orthogonal circles on
the passing point. Each triangle has 3 polygon vertices on
the circles.
2.2.2 When the Bending Angle Is Less than 120
◦
When the bending angle is 120
◦
or more, a triangular
polygon was constructed by connecting the polygon
vertices on the C
i
and C
i+1
to hide the crack, but if
the angle is close to an acute angle, the interpolation
is rapid and unnatural. So, we create an intermediate
circle C
m
and perform a gentle interpolation. Let l
i
and l
i+1
be the lines that make up the wire that inter-
sects at the passing point and let n
i
and n
i+1
be the di-
rectional vectors on the lines. The unit vectors u
m
,v
m
that represent the orthogonal circle C
m
which divides
the wire segment are obtained as follows. Interpola-
tion is by filling two gaps betweenC
i
and C
m
, C
m
, and
C
i+1
.
a
m
= n
i
+ n
i+1
(10)
u
m
=
a
m
|a
m
|
(11)
v
m
= n
i
× n
i+1
(12)
2.3 Fast Rendering by Geometry
Shader
In this way, natural muscle polygons with no tears can
be created as shown in Figure. 5. The process of cre-
icSPORTS 2021 - 9th International Conference on Sport Sciences Research and Technology Support
132

ating muscle polygons is performed using the geome-
try shader on GPU. The geometry shader is a process
that takes polygon vertices as input and increases the
number of vertices. Parallel processing on the GPU
allows for fast polygon increment processing.
3 SPORT MOTION
PRESENTATION ON VR
WORLD
3.1 Motion Measurement and
Musculoskeletal Analysis
We conducted measurement and presentation to re-
produce the interaction in VR world with an opponent
by taekwondo motion, which is one of the interper-
sonal sports. We measured taekwondo motion of one
player and one coach by IMU-suit motion capture and
applied musculoskeletal analysis. The obtained mus-
culoskeletal motion was presented on a head-mounted
display to taekwondo athletes, coaches, who have
knowledge of taekwondo for evaluation. The IMU
suit was used in the measurement experiment of taek-
wondo. The result of musculoskeletal analysis by ap-
plying inverse kinematics and inverse dynamics to the
measured motion is shown in Figure. 1.
3.2 Presentation on VR World
The measured motion is visualized in the VR world
using the musculoskeletal analysis result drawing
method described in Chapter 2 and presented to the
subjects wearing the VR headset. The head-mounted
display used for the presentation was the Oculus
Quest2 by Oculus. The subjective evaluation and
response of the subjects during the presentation are
shown below.
• The musculoskeletal presentation using a display
was not so good, but the VR presentation using
headset had a completely different sense of scale
and gave a sense of realism to the kicking.
• You could observe the motions up close, and al-
though you could see the differences in the kicks
of the players on the display, I could see the dif-
ferences even more.
• The subjects felt that measuring the opponent’s
kicks in competitions and presenting the mea-
sured motions in VR would be more useful than
research using displays to learn the opponent in
advance.
3.3 Discussion
From the impressions and evaluations, it is consid-
ered that the musculoskeletal motion presentation can
reproduce the interaction with the opponent as in the
real world. By using this interaction, we can repro-
duce the movements of the opponent, which is dif-
ficult to achieve in the real world, and lead to more
efficient training than before.
4 MEASUREMENT
INTERACTION ON REAL
WORLD
To reproduce human-human interaction in the VR
world, we conducted 3D integrated measurement ex-
periments of humans and the environment. The mo-
tion obtained from the musculoskeletal analysis of the
measured data is presented in the VR space.
4.1 Measurement Methods
4.1.1 Motion Capture
In this experiment, we use video motion capture
(VMocap) developed by Ohashi et al. (Ohashi et al.,
2018), which estimates the 3D positions of joints by
capturing images with multiple cameras and using the
probability of the existence of the subject’s joints ob-
tained by Openpose (Cao et al., 2017).
4.1.2 Environment Measurement
VisualSLAM (Moulon et al., 2012) is a method for
estimating the 3D positional relationship between the
camera that captured the image and the feature points
based on the correspondence between images of fea-
ture points on the image, using multiple images of the
object as input. The application of photogrammetry,
Meshroom (AliceVision, 2018), can be used to recon-
struct 3D models of the environment.
4.2 Conditions
The measurement space is shown in Figure. 7, where
there is an obstacle like a desk in the center of the
environment, and subjects passing near the obstacle
and interacting with the environment. The 3D model
of the measurement environment was created using
Meshroom in advance, and the measurement was per-
formed in a situation where subjects were passing
each other, and VMocap was used to obtain the mo-
tion of the subjects. We instructed two subjects to
Visualization of Human Motion via Virtual Reality Interface and Interaction based on It
133
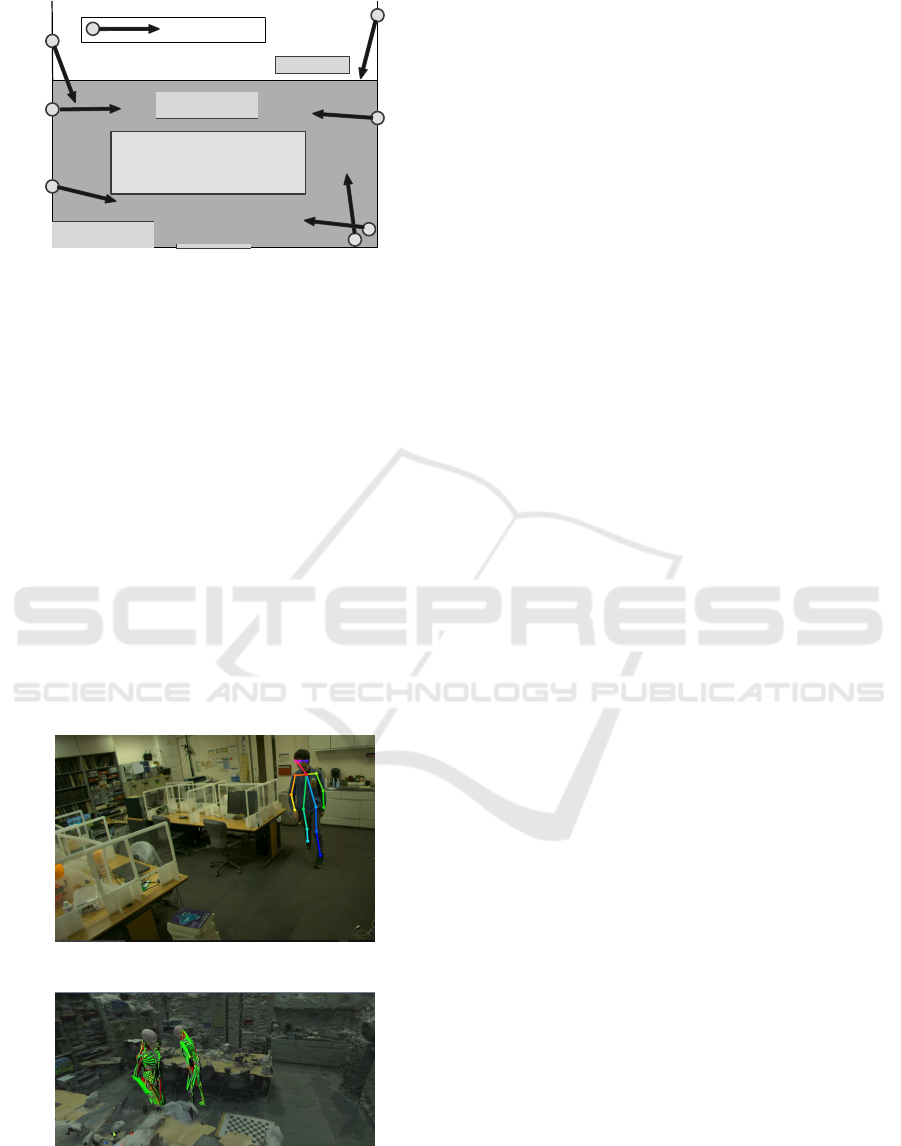
Recording space
Desk
Kitchen
Entrance
Point A
Camera direction
Figure 7: Recording area, which has entrance and desk at
the center. 7 cameras covered area.
perform the following walking motions in a real envi-
ronment and asked them to pass each other.
• The subject who walks clockwise around the desk
from the entrance is designated as Subject A. Sub-
ject A is asked to pick up the pencil case on the
desk and proceed to the entrance again.
• The subject who passes subject A is called subject
B. Subject B was given no instructions other than
to pass each other.
4.3 Reconstruction Result
Figure. 8 is the result of subject’s key points detec-
tion by Openpose. Key points are well detected in
the environment. The musculoskeletal motion and en-
vironment estimation results of two subjects passing
motion is shown in Figure. 9.
Figure 8: Subject key points estimation result.
Figure 9: Musculoskeletal motions of the passing motion in
the environment.
5 INTERACTION
REPRODUCTION ON VR
WORLD
5.1 Presentation Method
The data measured in the previous chapter are repro-
duced in the VR world, and the presentation experi-
ment is conducted to reproduce the passing motion of
the subject in the real space and the VR world. For
the presentation, we used the Oculus Quest2.
5.2 Conditions
The subjects are asked to reproduce the following ac-
tions in the real world measured in the previous sec-
tion.
1. The subject lonely starts at the entrance, moves
clockwise around the desk in the center of the en-
vironment, retrieves the pencil case, and returns
to the entrance.
2. Passing motion with a person starting from the
Point A and proceeding to the washroom.
3. Passing motion with a person starting from the en-
trance and proceeding clockwise around the desk
Since Motion 1 is performed by only one person, the
VR presentation does not use the motion measured in
the previous section. In order to compare whether the
behavior changes depending on the presentation of
the person passing by, we used the presentation with
muscle rendering and the presentation with only the
skeleton without muscle rendering in Motion 2 and
3. The conditions used in this study are the following
motions measured in the previous section.
a. Motion 2 with muscle drawing
b. Motion 2 without muscle drawing
c. Motion 3 with muscle drawing
d. Motion 3 without muscle drawing
A total of five subjects participated in the study.
5.3 Results
5.3.1 Trajectory Comparison
Figure. 10 is the walking motion of a single person
moving clockwise around a desk. The red line shows
the trajectory in real world, blue lines show the tra-
jectory in VR world. Figure. 11 is a superimposed
drawing of the walking motion in the VR world and
the walking motion in the real world under conditions
a, b, c and d.
icSPORTS 2021 - 9th International Conference on Sport Sciences Research and Technology Support
134
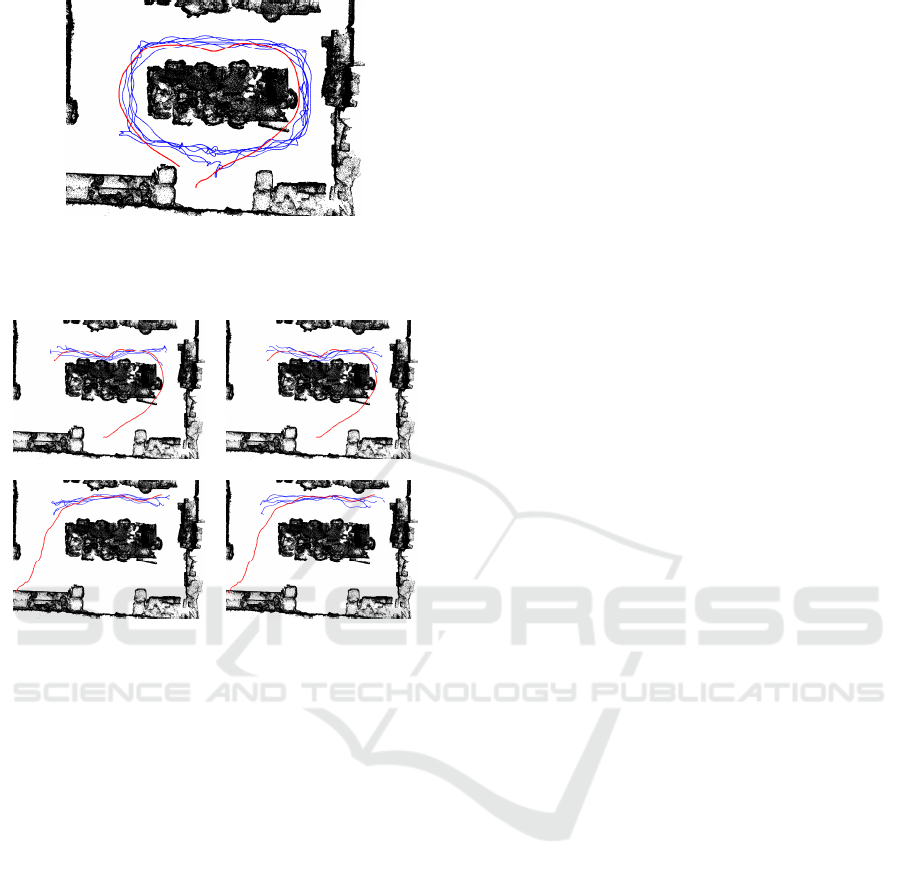
Figure 10: Trajectories of walking around desk (Motion 1).
Red line shows trajectory measured in real world by video
motion capture. Blue lines show subjects trajectory.
Walk Motion a) Walk Motion b)
Walk Motion c) Walk Motion d)
Figure 11: Trajectories of crossing paths with Opponents
a), b), c), d).
In the clockwise walking motion in the environ-
ment (Motion 1), the trajectory in the real world pro-
gresses smoothly around a corner, while the trajectory
in the VR world tends to make a right turn. The trajec-
tory in the VR world remains in line with the desk for
most subjects, while the trajectory in the real world
leaves the desk immediately after the acquisition of
the pencil case. Comparing the trajectories in the VR
space in condition a and b, the trajectories in condi-
tion a showed less variation. In the action of walking
pass each other while retrieving the pencil case (Mo-
tion 2), the trajectories in the real world and in the VR
world are almost the same in the Motion 3 of passing
a person who acquires a pencil case, especially in the
middle of the trajectory where they pass each other.
The trajectories in the VR space for condition c and
d were compared, and as in the case of Motion 2, the
trajectories in condition c showed less variation.
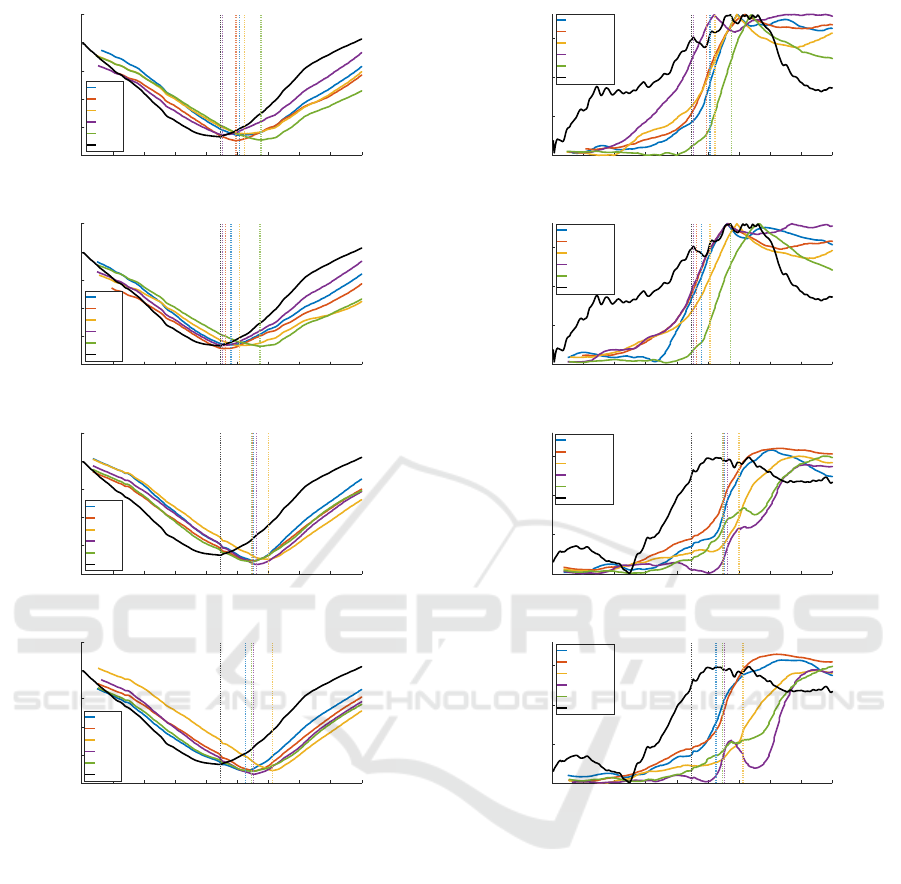
5.3.2 Distance and Gaze Direction Vector
against Opponent
We focused the change on the distance between the
subject and the passing opponent as an interaction.
Figure. 12 is a time series graph of the distance be-
tween the subject’s head and the passing opponent
projected onto a horizontal plane. The vertical line in-
dicates the timing of the minimum distance between
the subject and the passer-by. View the distance graph
in the beginning. In all conditions, the timing of the
minimum distance to the opponent is faster in the case
of passing each other in the real world. In addition, in
conditions a and b, the minimum distance to the op-
ponent tends to be smaller in the case of passing each
other in the VR world.
Next, we focused on the gaze direction graph. Fig-
ure. 13 is a time series graph of the gaze vector angle
against the passing opponent. The closer the angle is
to 0
◦
, the more the subject is gazing at the opponent.
In all the figures, we can see that the subjects in the
VR world gaze at the opponent longer. In addition, in
conditions a and b, the subjects in the real world do
not gaze at the other person for a long time, such as
immediately removing their gaze after gazing at the
other person for about one second from the beginning
of passing, while the subjects in the VR world tend to
gaze at the other person until just before passing.
5.4 Discussion
Using the walking motion in the real world measured
in the previous section and the environment informa-
tion reconstructed by VisualSLAM, we conducted a
reproduction experiment in the VR world to compare
the walking motion in the real world and the walking
motion in the VR world. Awkward clockwise walk-
ing in VR world (Motion 1) is thought to be because
the subject did not fully grasp of the space in the VR
world and felt resistance to moving while walking. In
addition to grasping of the space, the actual environ-
ment in which the VR reproduction experiment was
conducted was surrounded by walls, and the subject
is controlled not to collide with such real obstacles.
This movement restrictions are also shown in the time
series graphs of the distance and direction of gaze of
the passers-by, and the time at which large changes
occur in the graphs is often later in the VR world than
in the real world.
When we compared the time when the opponent in
VR world was visualized with muscles included and
the time when only the skeleton was visualized, the
variation of the path was less when muscles were in-
cluded. The reason for this is that including muscles
Visualization of Human Motion via Virtual Reality Interface and Interaction based on It
135
0 0.5 1 1.5 2 2.5 3 3.5 4 4.5
Time[s]
0
1
2
3
4
5
Distance between heads[m]
dis.1
dis.2
dis.3
dis.4
dis.5
dis.ref
Walk Motion a
0 0.5 1 1.5 2 2.5 3 3.5 4 4.5
Time[s]
0
1
2
3
4
5
Distance between heads[m]
dis.1
dis.2
dis.3
dis.4
dis.5
dis.ref
Walk Motion b
0 0.5 1 1.5 2 2.5 3 3.5 4 4.5
Time[s]
0
1
2
3
4
5
Distance between heads[m]
dis.1
dis.2
dis.3
dis.4
dis.5
dis.ref
Walk Motion c
0 0.5 1 1.5 2 2.5 3 3.5 4 4.5
Time[s]
0
1
2
3
4
5
Distance between heads[m]
dis.1
dis.2
dis.3
dis.4
dis.5
dis.ref
Walk Motion d
Figure 12: Solid lines show time series change of distance
between subject and opponent. Dotted vertical lines show
the timing of minimum distance to the opponent.
increased the existence of the opponent and narrowed
the range of the subject’s choice of path. In addition,
the subjects thought that they were passing between
a desk and the opponent in the environment, and the
environmental information was given close to the re-
ality. Although the presence or absence of the mus-
cle visualizing influenced the choice of the path, the
minimum distance to the passing partner was not dif-
ferent. It did not influence the timing of the actual
crossing, when the opponent is reflected at the edge
of the field of vision, making it more difficult to see
than in the center of the field of vision. When we
compared how long the subjects gazed at the oppo-
nent, the subjects in the VR world tended to gaze at
0 0.5 1 1.5 2 2.5 3 3.5 4 4.5
Time[s]
0
50
100
150
Gaze direction vector angle[°]
gaze dir.1
gaze dir.2
gaze dir.3
gaze dir.4
gaze dir.5
gaze dir.ref
Walk Motion a
0 0.5 1 1.5 2 2.5 3 3.5 4 4.5
Time[s]
0
50
100
150
Gaze direction vector angle[°]
gaze dir.1
gaze dir.2
gaze dir.3
gaze dir.4
gaze dir.5
gaze dir.ref
Walk Motion b
0 0.5 1 1.5 2 2.5 3 3.5 4 4.5
Time[s]
0
50
100
150
Gaze direction vector angle[°]
gaze dir.1
gaze dir.2
gaze dir.3
gaze dir.4
gaze dir.5
gaze dir.ref
Walk Motion c
0 0.5 1 1.5 2 2.5 3 3.5 4 4.5
Time[s]
0
50
100
150
Gaze direction vector angle[°]
gaze dir.1
gaze dir.2
gaze dir.3
gaze dir.4
gaze dir.5
gaze dir.ref
Walk Motion d
Figure 13: Solid lines show time series change of angle be-
tween the line of sight and the line connecting subject and
opponent. Dotted vertical lines show the timing of mini-
mum distance to the opponent.
him longer. It is thought that it was necessary to ob-
serve him for a long time when passing each other
in the VR world. First, unlike in the real world, the
motion of the passer-by is based on a musculoskeletal
model, so it is easy to attract the eyes of the subjects.
In addition, visualizing the skeletal makes it difficult
to see the eyes of the opponent and to know which di-
rection he is facing and moving to. So, the estimated
results of muscle tension did not affect the prediction
of the movement of the opponent and the difficulty in
predicting the direction of gaze may have affected the
subject’s walking.
icSPORTS 2021 - 9th International Conference on Sport Sciences Research and Technology Support
136

On the other hand, the presentation of environ-
mental information by VisualSLAM does not give the
subject a sense of discomfort, but is given as infor-
mation, and can play a role close to reality in the in-
teraction between the subject, the opponent, and the
environment. For sport training, it makes a sense to
use the musculoskeletal model. But for reproducing
real environmentin VR world, it is assumed that using
more human-like models is more important. It is as-
sumed that it is more important to use models that do
not give the subject a sense of discomfort while keep-
ing the joint positions close to the actual one, rather
than using a musculoskeletal model for the presenta-
tion of the passing partner, in order to reproduce the
passing gait in the VR world, not in sport training.
6 CONCLUSION
The results of musculoskeletal analysis were rendered
in VR space, which is useful for ecological training in
interpersonal sports. The environmental information
was well reproduced, but the general human model
was more effective in the walking motion experiment.
In the future, it is necessary to reproduce the subject’s
own information in order to use it for ecological train-
ing.
REFERENCES
AliceVision (2018). Meshroom: A 3d reconstruction soft-
ware. https://github.com/alicevision/meshroom.
Cao, Z., Simon, T., Wei, S.-E., and Sheikh, Y. (2017). Real-
time multi-person 2d pose estimation using part affin-
ity fields. In Proceedings of the IEEE conference on
computer vision and pattern recognition, pages 7291–
7299.
Davids, K., Handford, C., and Williams, M. (1994). The
natural physical alternative to cognitive theories of
motor behaviour: An invitation for interdisciplinary
research in sports science? Journal of sports Sciences,
12(6):495–528.
Gibson, J. J. (2014). The ecological approach to visual per-
ception: classic edition. Psychology Press.
Handford, C., Davids, K., Bennett, S., and Button, C.
(1997). Skill acquisition in sport: Some applications
of an evolving practice ecology. Journal of sports sci-
ences, 15(6):621–640.
Hill, A. V. (1938). The heat of shortening and the
dynamic constants of muscle. Proceedings of the
Royal Society of London. Series B-Biological Sci-
ences, 126(843):136–195.
Hosp, B., Schultz, F., H¨oner, O., and Kasneci, E. (2020).
Eye movement feature classification for soccer goal-
keeper expertise identification in virtual reality. arXiv
preprint arXiv:2009.11676.
Kimura, T., Nasu, D., and Kashino, M. (2018). Utilizing
virtual reality to understand athletic performance and
underlying sensorimotor processing. In Multidisci-
plinary Digital Publishing Institute Proceedings, vol-
ume 2, page 299.
Maroto-Izquierdo, S., Fernandez-Gonzalo, R., Magdi,
H. R., Manzano-Rodriguez, S., Gonz´alez-Gallego, J.,
and De Paz, J. a. (2019). Comparison of the mus-
culoskeletal effects of different iso-inertial resistance
training modalities: Flywheel vs. electric-motor. Eu-
ropean journal of sport science, 19(9):1184–1194.
Moulon, P., Monasse, P., and Marlet, R. (2012). Adaptive
structure from motion with a contrario model estima-
tion. In Proceedings of the Asian Computer Vision
Conference (ACCV 2012), pages 257–270. Springer
Berlin Heidelberg.
Murai, A., Kurosaki, K., Yamane, K., and Nakamura, Y.
(2009). Computationally fast estimation of muscle
tension for realtime bio-feedback. In 2009 Annual
International Conference of the IEEE Engineering
in Medicine and Biology Society, pages 6546–6549.
IEEE.
Murai, A., Kurosaki, K., Yamane, K., and Nakamura, Y.
(2010). Musculoskeletal-see-through mirror: Compu-
tational modeling and algorithm for whole-body mus-
cle activity visualization in real time. Progress in bio-
physics and molecular biology, 103(2-3):310–317.
Nakamura, Y., Yamane, K., Fujita, Y., and Suzuki, I.
(2005). Somatosensory computation for man-machine
interface from motion-capture data and musculoskele-
tal human model. IEEE Transactions on Robotics,
21(1):58–66.
Ohashi, T., Ikegami, Y., Yamamoto, K., Takano, W., and
Nakamura, Y. (2018). Video motion capture from the
part confidence maps of multi-camera images by spa-
tiotemporal filtering using the human skeletal model.
In 2018 IEEE/RSJ International Conference on Intel-
ligent Robots and Systems (IROS), pages 4226–4231.
IEEE.
Petri, K., Emmermacher, P., Danneberg, M., Masik, S.,
Eckardt, F., Weichelt, S., Bandow, N., and Witte, K.
(2019). Training using virtual reality improves re-
sponse behavior in karate kumite. Sports Engineering,
22(1):2.
Stroeve, S. (1999). Impedance characteristics of a neuro-
musculoskeletal model of the human arm i. posture
control. Biological cybernetics, 81(5):475–494.
Technologies, I. (2021). Mining training simulators.
https://www.immersivetechnologies.com/products/
Simulators.htm.
Yoo, K., Wu, X., Zhuang, W., Xia, Z., and Liu, Y. (2020).
The effects of audible feedback as a coaching strategy
on golf skill learning for novice players. International
Journal of Performance Analysis in Sport, 20(4):596–
609.
Zhang, H. (2017). Head-mounted display-based intuitive
virtual reality training system for the mining industry.
International Journal of Mining Science and Technol-
ogy, 27(4):717–722.
Visualization of Human Motion via Virtual Reality Interface and Interaction based on It
137
