
Investigation of UX and Flow Experience in Sports Activities during the
Covid-19 Pandemic: A Comparative Analysis of Cycling Apps
Klemens Weigl
1,2,3 a
, Sabrina Schuster
1 b
and Andreas Riener
1 c
1
Human-Computer Interaction Group, Technische Hochschule Ingolstadt (THI), Esplanade 10, 85049 Ingolstadt, Germany
2
Department of Psychology, Catholic University Eichst
¨
att-Ingolstadt, Germany
3
Department of Psychology, DHGS German University of Health and Sport, Berlin, Germany
Keywords:
Outdoor Cycling, Smartphone Apps, eSports, User Experience (UX), Flow, Motivation.
Abstract:
Since the onset of the Covid-19 pandemic, a dramatic increase in mHealth application (app) downloads has
been documented. However, overall dwell retention for fitness apps is low, so gamification techniques are used
within apps with the goal of positively influencing the user experience and ultimately the user’s motivation.
The so-called flow, which is related to intrinsic motivation, has been little explored in the context of cycling
apps. Therefore, we conducted a quasi-experimental cycling study with 34 cyclists (20 female, 14 male;
19 to 57 years old) who tested the adidas Running by Runtastic (Adidas Runtastic), Komoot, and Strava
cycling apps during a 20-minute bike ride. After testing each cycling app, they completed the User Experience
Questionnaire (UEQ) and the Flow State Scale-2 Short (FSS-2S). Our results showed no significant differences
across the six factors of the UEQ, nor across the total score of the FSS-2S. Thus, we conclude that the three
cycling apps Adidas Runtastic, Komoot, and Strava are perceived and rated almost equally by female and male
cyclists.
1 INTRODUCTION
Smartphone applications (Apps) are ubiquitous nowa-
days. In 2020, the four main App stores offered more
than 6 million applications for their respective users
(Appfigures, & VentureBeat, 2021). Since the first
quarter of 2020, marking the beginning of the Covid-
19 pandemic, the number of health and fitness App
downloads worldwide increased from 419 million
downloads in the fourth quarter of 2019 to 656 mil-
lion downloads in the second quarter of 2020, which
translates into an increase of 237 million downloads
(+56,56%) within just nine months (Sensor Tower,
2020). With nationwide lockdowns and closed gyms,
people tried to stay fit with Mobile Health (mHealth)
(Olla and Shimskey, 2015) Apps.
However, what can often be seen is a decrease
in interest over time known as hype cycle (Ferrara,
2012). After a few days or weeks the initial excite-
ment slowly drops and nearly one out of four Apps
will only be used once after the download (Business
a
https://orcid.org/0000-0003-2674-1061
b
https://orcid.org/0000-0003-2396-1907
c
https://orcid.org/0000-0002-9174-8895
2 Community, 2019). This is a critical scenario as
users will either abandon an App or continue using it.
Hence, more and more applications include gamifica-
tion (Deterding et al., 2011) to influence the user ex-
perience (UX) and captivate users encouraging them
for a long-term use of an App. Based on several
studies in recent years, paradigms (Deterding et al.,
2011), categorizations (Lister et al., 2014), frame-
works (Vaghefi and Tulu, 2019; Chou, 2019) and lists
of the most important game elements (Dallinga et al.,
2018) were established. The true effectiveness of
gamification has not yet been fully explored, however,
it appears that the use of gamification has an impact
on users both short-term and long-term motivation
(Hamari and Koivisto, 2013; Link et al., 2014; Bar-
ratt, 2017; Hamari, 2017; Hassan et al., 2019; Vaghefi
and Tulu, 2019; Schmidt-Kraepelin et al., 2020) with
differences in the perception within the population
(Link et al., 2014). Thereby, the probability of creat-
ing a long-term engagement is enhanced while simul-
taneously the retention rate is intensified if users are
periodically introduced to new game elements within
the App over time (Link et al., 2014). Rarely if ever
taken into account in the matter of gamification is
the phenomenon flow (Csikszentmihalyi, 2014). The
Weigl, K., Schuster, S. and Riener, A.
Investigation of UX and Flow Experience in Sports Activities during the Covid-19 Pandemic: A Comparative Analysis of Cycling Apps.
DOI: 10.5220/0010688200003059
In Proceedings of the 9th International Conference on Sport Sciences Research and Technology Support (icSPORTS 2021), pages 61-68
ISBN: 978-989-758-539-5; ISSN: 2184-3201
Copyright
c
2021 by SCITEPRESS – Science and Technology Publications, Lda. All rights reserved
61

term is often used in everyday language to describe an
enjoyable moment or experience which is deeply in-
volving for the respective person. Flow is not cultural
nor situation bound, but can be experienced during
any activity - most commonly creative and physical
activities - while simultaneously often achieving peak
performances (Csikszentmihalyi, 2014) which further
motivate users and athletes and therefore increase re-
tention rates for mHealth Apps.
However, to the best of our knowledge, there ex-
ists no study which explores the effects of gamifica-
tion on flow experiences in cycling applications. By
identifying the connections between the use of game
elements in the cycling applications adidas Running
App by Runtastic (hereinafter referred to as Adidas
Runtastic), Komoot, and Strava and flow experiences,
mHealth applications can retain their users more long-
term oriented, which has advantages for both sides:
users improving their health and health behavior and
creators increasing their business.
1.1 The Present Study
Consequently, we carried out a quasi-experimental
outdoor cycling and questionnaire study and inves-
tigated the following research questions (RQs) and
hypotheses (Hs).
RQ1 (User Experience): How is the influence of dif-
ferent gamified menus on the user experience of the
cycling Apps Adidas Runtastic, Komoot, and Strava?
• H
1
: Although Strava is especially developed for
and used in the cycling community, we suppose
that the user experience of Adidas Runtastic and
Komoot is perceived and rated roughly the same
as Strava (Note: the three Apps can also be used
in other sports activities, for example, in running).
RQ2 (Flow Experience): How is the influence of
gamified menus on the flow experience when using
the Apps Adidas Runtastic, Komoot, and Strava?
• H
2
: We expect that different gamified menus of
the Apps Adidas Runtastic, Komoot, and Strava
do not affect the flow experience (which is related
to intrinsic motivation).
2 METHOD
2.1 Participants
In total, 34 subjects participated in the study with
20 women aged 19 to 57 (M = 32.50, SD = 13.27)
and 14 men aged 19 to 56 (M = 39.50, SD = 13.31).
Fourteen participants were married, another 14 were
singles, and 6 were in a relationship. At the level
of education, 17 people had completed vocational-
occupational training (apprenticeship) or vocational-
school training, and 16 participants had a university
degree (one person did not specify). Furthermore, 14
of the participants stated that they were living in a city,
10 near a city, 8 in a small rural village, and 2 said
they live in the countryside. A driver’s licence was
held by 32 participants with a validity period from one
to 40 years. While public transport is regularly used
in leisure time by 11 subjects, all 34 stated that they
were using a bike for transport as well. Hereby, 2 par-
ticipants reported that they ride their bike ten times
per week, 1 seven times, 3 six times, 8 five times a
week, another 8 four times, 6 three times, 2 twice,
and 3 once per week. The participants were further
asked if they regularly go running (12/34) or nordic
walking (6/32). Fourteen people stated that they had
cycled as a hobby sport for at least one year and 7 had
also participated in competitions. Finally, 18 partici-
pants reported to know at least one of the three Apps
with Komoot being the best known (14), followed by
Adidas Runtastic (9), and Strava (8) and among them,
12 used them regularly and will continue to do so in
the future. The majority of participants had a German
citizenship (33). All participants were fluent in Ger-
man and consumed no alcohol or drugs. Participants
were recruited via e-mail, telephone, messages or per-
sonally based on the following inclusion criteria: (1)
can ride a bike, (2) ride a bike regularly, (3) are physi-
cally active, (4) are healthy (i.e., were not chronically
ill or physically impaired in the conduct of the study),
(5) own a smartphone, and (6) are willing to down-
load the Apps Adidas Runtastic, Komoot, and Strava
and test them during a bike ride.
2.2 Design and Materials
We conducted a cross-sectional quasi-experimental
outdoor cycling study and adopted a one factorial (3 x
1) within-subjects design with the three Apps Adidas
Runtastic, Komoot, and Strava as three conditions and
within-subjects factor. The three Apps were provided
in a counter-balanced way to all participants. Our de-
pendent variables were the six factors of the User Ex-
perience Questionnaire and the total score of the Flow
State Scale-2 Short, all directly provided after testing
each of the three Apps, respectively. Additionally, we
asked the participants to rank those three Apps.
icSPORTS 2021 - 9th International Conference on Sport Sciences Research and Technology Support
62

2.3 Questionnaires
In this section, we explain the two self-rating
scales, which we deployed on LimeSurvey, Version
3.12.1+180616, (Team and Schmitz, 2021). We col-
lected the data online directly after testing each App,
so the perception and assessment were still accurate.
Because of the counterbalanced allocation of each
participant to the three Apps, every subject was as-
signed a pseudonym which had to be entered at the
beginning when answering the online questionnaires.
Later the pseudonym was used for the connection of
the three data sets and deleted afterwards. Hence, af-
ter the deletion of the pseudonym the data set was
anonymously.
2.3.1 User Experience Questionnaire (UEQ)
The User Experience Questionnaire (UEQ) was de-
veloped by (Laugwitz et al., 2008). To study RQ1 (cf.
section 1.1), we applied the long version to compare
the user experience between the three Apps Adidas
Runtastic, Komoot, and Strava. The UEQ contains
26 items on a 7-point rating scale ranging from -3 to
+3 and each item is denoted by two words with po-
lar opposing meanings. Typical items are verbally an-
chored with, for example, ”annoying” vs. ”enjoyable”
or ”pleasant” vs. ”unpleasant”. The UEQ covers the
following six subscales: (1) attractiveness (6 items;
Cronbach’s α = .91, .86, .90 for the Apps Adidas
Runtastic, Komoot, and Strava, respectively; also in
the following parentheses), (2) perspicuity (4 items;
Cronbach’s α = .83, .77, .82), (3) efficiency (4 items;
Cronbach’s α = .79, .61, .69), (4) dependability (4
items; Cronbach’s α = .67, .80, .43), (5) stimulation
(4 items; Cronbach’s α = .90, .86, .79), and (6) nov-
elty (4 items; Cronbach’s α = .78, .84, .87). As stated
in the parentheses, we computed Cronbach’s α which
is considered as a measure for internal consistency,
whereas values greater than .7 are classified as ac-
ceptable (Nunnally, 1978). Note that Cronbach’s α is
sensitive to the sample size and the number of items
such that a larger sample size and more items usually
yield to a higher value (Taber, 2018). Hence, most
values in this study can be considered as acceptable
or at least as okay, given the rather small sample size
and mostly only 4 items per subscale. Additionally,
to perform consecutive statistical analyses, we also
kept the factor dependability for the App Strava for
practical reasons although Cronbach’s α was only .43.
However, the factors (2), (3), and (4) are attributed to
pragmatic quality, and the factors (5) and (6) to the
hedonic quality.
2.3.2 Flow State Scale-2 Short (FSS-2S)
To measure a potential flow experience (Csikszent-
mihalyi, 2014) and address research questions RQ2
(cf. section 1.1), the Flow State Scale-2 Short (FSS-
2S) was used with one question per factor as pro-
posed by (Jackson et al., 2008). The response for-
mat of the items was a 5-point Likert scale ranging
from 1 (strongly disagree) to 5 (strongly agree). The
factors (which correspond with the nine flow dimen-
sions) are as follows: (1) challenge-skill balance, (2)
action awareness merging, (3) clear goals, (4) unam-
biguous feedback, (5) concentration on task at hand,
(6) paradox of control, (7) loss of self-consciousness,
(8) transformation of time, and (9) autotelic experi-
ence. Example items are for (1) ”I feel I am compe-
tent enough to meet the high demands of the situa-
tion” or (2) ”I do things spontaneously and automat-
ically without having to think”. As suggested by the
original authors, we computed the total score (i.e., the
sum score) across all nine items and used this factor
for each App for further analyses. Note that based on
the 9 different dimensions each measuring a differ-
ent aspect of flow, in this case, Cronbach’s α can be
omitted. In contrast, Cronbach’s α was reasonable for
the UEQ, whereas each different factor is considered
separately with several items loading on the respec-
tive factor.
2.4 Apps
The Apps Adidas Runtastic (runtastic GmbH, 2021),
Komoot (komoot GmbH, 2021), and Strava (Strava
Inc., 2021) are available for download in the major
App stores like the Google Play Store or Apple’s
App Store and were used in the freemium version.
As mentioned in the beginning, mHealth applications
have seen an increase in user numbers since the begin-
ning of the Covid-19 pandemic, hence the three pop-
ular cycling applications were chosen for this study.
Adidas Runtastic is a fitness App focusing on
running and fitness in general. Adidas acquired the
app Runtastic and the eponymous existing company
in August of 2015 and re-branded them in August
2019 (Widmann, 2015). With more than 177 million
registered users and more than 330 million downloads
(Runtastic, 2021), Adidas Runtastic is one of the most
popular mHealth applications in the fitness category
(Airnow, 2021).
Komoot is an outdoor App, which advertises
mainly with its smart route planner, turn-by-turn
voice navigation, tips from other users and inspira-
tional content (Komoot, 2021) which can be used
during different types of sport. The figureheads are
Investigation of UX and Flow Experience in Sports Activities during the Covid-19 Pandemic: A Comparative Analysis of Cycling Apps
63

cycling and hiking. Komoot, launched in 2010 by
Markus Hellermann (Schnor, 2018), has more than 18
million active users worldwide (Komoot, 2021) and is
one of the most popular mHealth applications in the
fitness category, too (Airnow, 2021).
As described, Adidas Runtastic and Komoot are
two very popular mHealth Apps. The best known
application in this segment for cycling, however, is
Strava with 21.5 million uploads every week by
74 million users resulting in four billion activities
(Strava, 2021a) since its launch in 2009. It was
founded by Mark Gainey and Michael Horvath (Bai-
ley, 2018). Like Adidas Runtastic and Komoot, Strava
offers users to track different activities and monitor
one’s progress based on comprehensive data. Strava
describes itself as the social network for athletes
(Strava, 2021b), hence, all users are called athletes
despite obvious differences between each user regard-
ing physical shape, demographic factors and so on.
2.4.1 Common Features
The most obvious commonality of the three Apps
Adidas Runtastic, Komoot, and Strava is the track-
ing of different sports activities. The tracked data
can be analyzed in different display formats and be
shared with friends or one’s community. In all of
them, the corporate identity (CI) is easily recogniz-
able through a uniform appearance. This is expressed,
among other things, through colors, icons, texts, and
formulations. The Apps are also similar in the gami-
fication area since all use certain elements, which will
be discussed in detail later. Regarding information ar-
chitecture (IA) and navigation, all three applications
use a bottom navigation bar with five items as a main
navigation including a page for tracking an activity, a
profile site, as well as a feed or discover page. The
IA is the framework of an application structuring the
underlying organization. It can not be seen by the
user through the front-end UI design but has an in-
fluence on the UX. The IA’s tasks include identifying
and defining content and functionality as well as the
correlation between both (Cardello, 2014). A search
function is available in every application as well and it
functions as search feature for friends and other peo-
ple one wants to follow. Adidas Runtastic, Komoot,
and Strava all have extensive settings where users can
customize their experience. A community section is
present in all of them, too, albeit in different forms
which will be further described below.
2.4.2 Differences
Even though there are some similarities between Adi-
das Runtastic, Komoot, and Strava, there are also ma-
jor differences. First, the number of available sports:
Komoot offers its users 21, Strava 31, and Adidas
Runtastic 94 different types of sports. Here, Adi-
das Runtastic has potentially the largest target group.
However, the three focus not on all available sports
as special emphasis is placed on some sports: Strava
focuses mainly on cycling, running and swimming;
Komoot uses cycling, running, hiking, and walking
as figureheads; and Adidas Runtastic is mainly aimed
at runners and cyclists. In addition to the differ-
ent focuses on the target groups and sports, there
are also differences in the overall orientation of the
Apps. Strava and Adidas Runtastic focus their atten-
tion on tracking activities and analyzing the respec-
tive data, whereas Komoot rather advertises the nav-
igation feature as well as route creation. The former
however, is solely available with Komoot as Strava
and Adidas Runtastic do not offer a navigation fea-
ture. The similarities of Strava and Adidas Runtastic
and simultaneous differences with Komoot go even
further: both offer audio cues respectively a Voice
Coach to inform users during an activity about their
performance and data. Additionally, one can take
place in challenges and events hosted by the Apps or
third party providers. Such features are not available
for Komoot users. A very popular feature of Strava
are segments where users can compete against each
other and earn trophies. The ten fastest athletes are
displayed on a leaderboard and the leader receives
the KoM (King of the Mountain) respectively QoM
(Queen of the Mountain) for their performance (for
an in depth explanation see (Barratt, 2017)). Another
difference between Strava, Komoot, and Adidas Run-
tastic are goals. Users can set themselves clear goals
in the freemium version solely with Adidas Runtas-
tic; Strava offers this feature only in the paid subscrip-
tion version. Lastly, Strava and Komoot users can like
(give Kudos in Strava) and comment on posts by other
users and engage with each other.
2.5 Procedure
Prior to the beginning of the main phase of the study,
a pilot study with five participants was conducted.
Based on those findings, the procedure of the user
study was slightly optimized. Therefore, those data
have not been included in the evaluation of the main
study.
Before the beginning of the main phase, each partici-
pant received an introduction to the background of the
study and was invited to ask questions throughout the
entire study duration. Then everyone who wanted to
participate provided written informed consent. After
this introductory part, all participants filled the ques-
icSPORTS 2021 - 9th International Conference on Sport Sciences Research and Technology Support
64

tionnaire items of the demographic variables such as
age, gender, regular outdoor cycling (yes or no), du-
ration of the daily commute by car, public transport,
bicycle, etc. (cf. section 2.1). Upon completion of the
first questionnaire part, everyone received the contact
details of the examiner, in case of any questions.
Next, potential participants who suited the inclusion
criteria described in section 2.1, were contacted and
received standardized invitations to the App testing
phase of the user study. Then the three Apps Adi-
das Runtastic, Komoot, and Strava were downloaded
and each one was tested during a 20-minute bike ride
(in total one hour) with active tracking by each par-
ticipant. After testing the App, the respective online
questionnaire had to be filled in. Finally, all partic-
ipants had to take a screenshot of each bike ride on
the App showing the recorded route with duration and
send it to the examiner. This served as an assurance
that the Apps were tested and the results were not fal-
sified. As soon as the questionnaires were completely
filled in and the screenshots were sent, each partici-
pant received a final ”Thank You”-message.
The examiner was either present (especially for older
people) or could be reached by phone, email, or
video-call during the entire study duration which
ranged from 80 to 90 minutes. Because of the pan-
demic situation during the conduct of the study, it was
not tied to a specific location. Hence, each participant
could participate at any location within a two-week
time window for execution. Furthermore, the study
was conducted on a voluntary basis and without finan-
cial compensation for the participants. However, all
of them were invited to provide their email addresses
if they were interested in the main results of the study.
2.6 Supplementary Materials
We support the open science movement and
supply the data set (.sav and .csv) on OSF:
https://osf.io/bx2js/ .
2.7 Statistical Analyses
At first, we performed data management and in-
spected the data set for completeness and dupli-
cates, respectively, and removed incomplete or dupli-
cate data entries. Then, we reverse-coded all neg-
atively worded items and computed the respective
mean scores for the UEQ and the overall sum score
for the FSS-2S. Next, we set the significance level to
α = .05, and reported all results with p < α as sta-
tistically significant. At the beginning, we evaluated
the statistical prerequisites and checked the factors of
the UEQ and the FSS-2S for normality and variance
homogeneity in all three App conditions, respectively.
Normality was met for the FSS-2S and in 16 out of 18
cases for the 6 UEQ factors (x 3 Apps = 18). Because
skewness and kurtosis as well as the QQ-plots indi-
cated an acceptable distributional behavior of the data
for the only two non-normally distributed factors, we
conducted parametric statistical analyses and applied
a repeated measures ANOVA to compare the three
Apps with each other. We applied IBM
R
SPSS
R
Statistics, Version 25 (IBM Corp., 2017) for all statis-
tical data analyses.
3 RESULTS
3.1 User Experience Questionnaire
For the UEQ exist norms (cf. the colored legend
in Figure 1 with ”Bad”, ”Below Average”, ”Above
Average”, ”Good”, ”Excellent”) generated from a
data set with 18384 participants based on 401 studies
(Schrepp et al., 2014). All three Apps have common
results as all are ”above average” for the subscales at-
tractiveness, efficiency, and dependability (cf. Figure
1). For the subscales perspicuity and dependability
Adidas Runtastic and Strava are likewise ”above aver-
age”, but Komoot is rated below average. The results
of the subscale novelty reveal that Adidas Runtastic
is rated ”above average”, but Komoot and Strava are
classified ”below average”.
Besides this classification related to the norms,
we applied repeated measures ANOVA on the mean
scores separately for each of the six subscales of
the UEQ to compare the three Apps. However, we
identified no statistically significant difference be-
tween Adidas Runtastic, Komoot, and Strava in any
of the six comparisons (cf. Table 1). Given those
non-significant findings clearly indicating no substan-
tial differences between the three Apps, of course,
it did not yield any different results as we applied
Bonferroni-Holm correction (Holm, 1979) to control
for the alpha inflation because of multiple testing.
3.2 Flow State Scale-2 Short
We applied the repeated measures ANOVA on the
three total scores of FSS-2S of the three Apps. How-
ever, we identified no statistically significant differ-
ence between Adidas Runtastic (M = 36.32, SD =
3.72, min. = 29, max. = 40), Komoot (M = 36.15, SD
= 3.77, min. = 28, max. = 41), and Strava (M = 36.15,
SD = 3.45, min. = 30, max. = 39), F(2,66) = .04,
p = .958, η
2
p
= .001. We also supply the means and the
Investigation of UX and Flow Experience in Sports Activities during the Covid-19 Pandemic: A Comparative Analysis of Cycling Apps
65
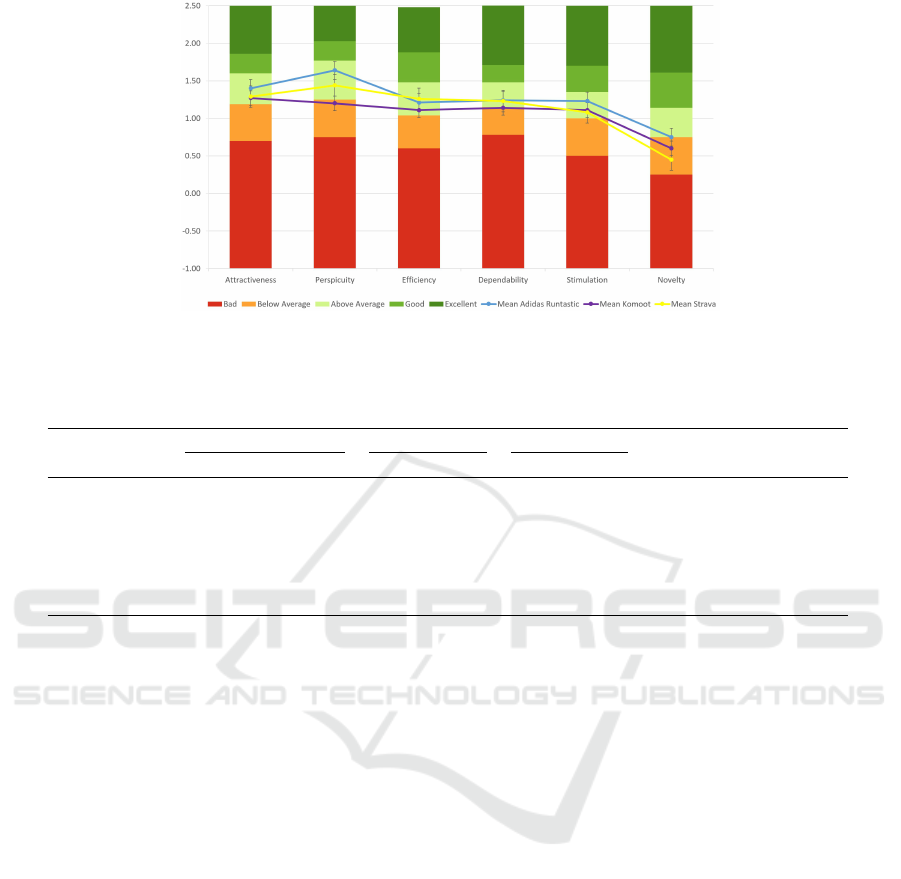
Figure 1: Means for the Apps Adidas Runtastic (blue), Komoot (green) and Strava (orange) of users in comparison with
external user experience norms of UEQ (cf. colored legend below). The colored norms are generated from a data set with
18384 participants based on 401 studies (Schrepp et al., 2014).
Table 1: Descriptive Statistics of User Experience Questionnaire (UEQ).
Adidas Runtastic Komoot Strava
Factor M SD M SD M SD F(df) p η
2
p
Attractiveness 1.40 0.83 1.27 0.98 1.29 0.84 0.38 (2,66) .683 .01
Perspicuity 1.64 1.00 1.20 1.25 1.44 1.03 2.48 (2,66) .091 .07
Efficiency 1.21 0.89 1.11 0.59 1.26 0.73 0.38 (2,66) .686 .01
Dependability 1.24 0.62 1.14 0.68 1.23 0.44 0.45 (2,66) .643 .01
Stimulation 1.23 1.18 1.11 1.23 1.08 0.99 0.44 (2,66) .644 .01
Novelty 0.75 0.92 0.60 1.28 0.45 1.65 1.43 (2,66) .246 .04
standard deviations of the Apps across all nine dimen-
sions in Table 2. Due to the very clear non-significant
overall findings reported before (cf. also η
2
p
), we do
not report additional statistical tests at the level of
the nine dimensions, which, however, would have re-
sulted in nine non-significant findings as we have ob-
served in supplementary analyses (beyond the scope
of this results section). The reason why we supply
Table 2 is to highlight that the Apps only marginally
differed across those nine flow dimensions.
4 DISCUSSION
The purpose of this cycling App study was to investi-
gate the user as well as the flow experience related to
gamified menus during the use of the cycling applica-
tions Adidas Runtastic, Komoot, and Strava.
Our first objective was to investigate the influence
of different gamified menus on the user experience
of the cycling Apps Adidas Runtastic, Komoot, and
Strava (RQ1). We found no differences between the
ratings of the user experiences between the three Apps
when applied in outdoor cycling. Although Strava
was especially developed for and used in the cycling
community, the Apps Adidas Runtastic and Komoot
were perceived and rated almost equally. One reason
for no substantial differences could be that all three
Apps are developed and are constantly evaluated and
updated by professional programmers, experts, users,
and athletes at a very high level incorporating big data
analyses. Therefore, we could accept hypothesis H
1
.
Our second objective was to study the influence
of different menus on the flow experience of the
Apps Adidas Runtastic, Komoot, and Strava (RQ2).
Our findings indicate that slightly different gamified
menus and game elements applied do significantly af-
fect the likelihood and the reporting of experienced
flow. One reason could be that the Apps use differ-
ent numbers of game elements (e.g., Strava and Adi-
das use similar numbers and both more than Komoot).
Another, that the total score of the FSS-2S may not be
sensitive enough to measure potential flow differences
in contrast to the nine flow dimensions. However, if
the nine flow dimensions would have been measured
it would have been better to not apply the short form
of the FSS with nine items, but the long form with
36 items. Besides this, flow is very dependent on
the individual person and the nine flow components
and may only be influenced to a limited extent by ex-
ternal factors such as gamified menus. Nevertheless,
by incorporating various features like a Voice Coach
in Adidas Runtastic to give unambiguous feedback to
icSPORTS 2021 - 9th International Conference on Sport Sciences Research and Technology Support
66

Table 2: Descriptive Statistics of the Flow State Scale-2 Short (FSS-2S) for all nine Flow Dimensions for the Apps Adidas
Runtastic, Komoot, and Strava.
Adidas Runtastic Komoot Strava
Flow Dimension M SD M SD M SD
Challenge-Skill Balance 4.54 0.82 4.29 1.07 4.47 0.81
Action-Awareness Merging 4.37 0.73 4.37 0.73 4.31 0.75
Clear Goals 4.29 0.75 4.43 0.66 4.31 0.67
Unambiguous Feedback 4.06 0.77 4.09 0.78 4.17 0.74
Concentration on Task at Hand 3.91 0.78 3.83 1.01 3.94 0.75
Paradox of Control 4.06 0.77 4.09 0.70 3.94 0.83
Loss of Self-Consciousness 4.17 1.01 3.94 1.31 4.08 1.13
Transformation of Time 3.03 1.20 3.37 1.00 3.00 1.31
Autotelic Experience 4.00 0.84 3.94 0.87 3.92 0.73
experience the transformation of time or the positive
communities of each App to set optimized goals to in-
fluence the challenge-skill balance, they could make a
small contribution to increase the probability of a flow
experience. The impact of the described functions can
not be confirmed entirely by the collected data as Adi-
das Runtastic and Strava incorporated most features
related to flow components though results for the sub-
scales are very similar for the three Apps. Hence, we
could retain hypothesis H
2
.
4.1 Limitations and Future Work
Although we observed no significant differences be-
tween those three Apps, this null result can be pos-
itively interpreted. It may be possible that there ex-
ists no substantial difference, what would imply that
those three Apps offer roughly the same good fea-
tures and menus. However, it has to be noted that
the sample size of 34 subjects is rather small. Al-
though the statistical power is usually greater for a
within-subjects design, as in our case (compared to a
between-subjects design), it would be interesting to
re-conduct this study with a larger sample size. Fi-
nally, it can be assumed that the participants (most
likely) did not experience flow but were closer to one
than being away from it. In this regard, the study de-
sign could be slightly adjusted (what would require
more organizational effort) and the Apps could be
tested more often (e.g., 2 or 3 times) and for longer
sessions (e.g., 30 minutes per session).
5 CONCLUSION
In this study, we evaluated the impact of gamification
on user experience specifically for the cycling apps
Adidas Runtastic, Komoot, and Strava, particularly
regarding the aspect “flow”. To the best of our knowl-
edge, this is the first cycling study that has focused on
user and flow experience when using gamified menus
in the context of cycling applications. Hence, our re-
sults provide an important link to begin to fill this re-
search gap. In particular, it is noticeable that there are
no significant differences between the Apps regarding
user as well as flow experience, although they apply
diverse game elements, incorporate distinct features,
and are ranked differently by participants. Neverthe-
less, in future studies, it will be necessary to address
these research questions again with a greater sam-
ple size and in relation with other personality traits.
Thereby, it could be highly interesting to also focus on
different levels of fitness of participants and long-term
effects of gamification on flow experiences. However,
we contribute to the growing trend of using gamified
menus in Apps - especially mHealth Apps - to get the
most benefit for all involved. In the following, we
sum up the highlights of our study:
1. The user experience of gamified menus of the
three cycling Apps Adidas Runtastic, Komoot,
and Strava is perceived and rated almost equally
indicating no significant difference.
2. The flow experience is not influenced by different
gamified menus of the three cycling Apps Adidas
Runtastic, Komoot, and Strava. Hence, it is per-
ceived and reported almost equally highlighting
no significant difference.
3. A slightly different number of applied game ele-
ments has most likely no effect on user and flow
experience.
REFERENCES
Airnow (2021). Ranking der beliebtesten Gesundheits- und
Fitness-Apps im Google Play Store nach der Anzahl
der Downloads in Deutschland im Mai 2021 (in 1.000)
[Graph]. Statista.
Investigation of UX and Flow Experience in Sports Activities during the Covid-19 Pandemic: A Comparative Analysis of Cycling Apps
67

Appfigures, & VentureBeat (2021). Number of apps avail-
able in leading app stores as of 4th quarter 2020. Last
accessed March 7, 2021.
Bailey, M. (2018). Q&A: Strava founder Mark Gainey. Last
accessed April 15, 2021.
Barratt, P. (2017). Healthy competition: A qualitative study
investigating persuasive technologies and the gamifi-
cation of cycling. Health & place, 46:328–336.
Business 2 Community (2019). Percentage of mobile apps
that have been used only once from 2010 to 2019
[graph]. Last accessed April 27, 2021.
Cardello, J. (2014). The difference between information
architecture (ia) and navigation. Last accessed April
13, 2021.
Chou, Y.-k. (2019). Actionable gamification: Beyond
points, badges, and leaderboards. Packt Publishing
Ltd.
Csikszentmihalyi, M. (2014). Applications of flow in human
development and education. Springer.
Dallinga, J., Janssen, M., Van Der Werf, J., Walravens,
R., Vos, S., and Deutekom, M. (2018). Analysis of
the features important for the effectiveness of physi-
cal activity–related apps for recreational sports: Ex-
pert panel approach. JMIR mHealth and uHealth,
6(6):e143.
Deterding, S., Dixon, D., Khaled, R., and Nacke, L. (2011).
From game design elements to gamefulness: defin-
ing” gamification”. In Proceedings of the 15th inter-
national academic MindTrek conference: Envisioning
future media environments, pages 9–15.
Ferrara, J. (2012). Playful design: Creating game experi-
ences in everyday interfaces. Rosenfeld Media.
Hamari, J. (2017). Do badges increase user activity? a field
experiment on the effects of gamification. Computers
in human behavior, 71:469–478.
Hamari, J. and Koivisto, J. (2013). Social motivations to
use gamification: an empirical study of gamifying ex-
ercise. ECIS 2013.
Hassan, L., Dias, A., and Hamari, J. (2019). How motiva-
tional feedback increases user’s benefits and contin-
ued use: A study on gamification, quantified-self and
social networking. International Journal of Informa-
tion Management, 46:151–162.
Holm, S. (1979). A Simple Sequentially Rejective Multiple
Test Procedure. Scandinavian Journal of Statistics,
6(2):65–70. Publisher: [Board of the Foundation of
the Scandinavian Journal of Statistics, Wiley].
IBM Corp. (Released 2017). IBM SPSS Statistics for Win-
dows, Version 25.0. Armonk, NY: IBM Corp.
Jackson, S. A., Martin, A. J., and Eklund, R. C. (2008).
Long and short measures of flow: The construct va-
lidity of the fss-2, dfs-2, and new brief counterparts.
Journal of Sport and Exercise Psychology, 30(5):561–
587.
Komoot (2021). About komoot - learn what we are all
about. Last accessed June 25, 2021.
komoot GmbH (2021). Komoot. Version 10.21.15.
Laugwitz, B., Held, T., and Schrepp, M. (2008). Construc-
tion and evaluation of a user experience questionnaire.
In Symposium of the Austrian HCI and usability engi-
neering group, pages 63–76. Springer.
Link, M. W., Lai, J., and Bristol, K. (2014). Not so fun?
the challenges of applying gamification to smartphone
measurement. In International Conference of De-
sign, User Experience, and Usability, pages 319–327.
Springer.
Lister, C., West, J. H., Cannon, B., Sax, T., and Brodegard,
D. (2014). Just a fad? gamification in health and fit-
ness apps. JMIR serious games, 2(2):e9.
Nunnally, J. (1978). Psychometric theory (2nd edit.)
mcgraw-hill. Hillsdale, NJ, 416.
Olla, P. and Shimskey, C. (2015). mhealth taxonomy: a
literature survey of mobile health applications. Health
and Technology, 4(4):299–308.
Runtastic (2021). Facts & figures. Last accessed June 25,
2021.
runtastic GmbH (2021). adidas Running by Runtastic. Ver-
sion 11.18.
Schmidt-Kraepelin, M., Toussaint, P. A., Thiebes, S.,
Hamari, J., and Sunyaev, A. (2020). Archetypes
of gamification: Analysis of mhealth apps. JMIR
mHealth and uHealth, 8(10):e19280.
Schnor, P. (2018). Komoot-gr
¨
under: “man soll bei uns keine
neuen freunde kennenlernen”. Last accessed April 16,
2021.
Schrepp, M., Hinderks, A., and Thomaschewski, J. (2014).
Applying the user experience questionnaire (ueq) in
different evaluation scenarios. pages 383–392.
Sensor Tower (2020). Health and fitness app downloads
worldwide from 1st quarter 2019 to 2nd quarter 2020
(in millions). Last accessed March 8, 2021.
Strava (2021a). Inspire your athletes - sports are about more
than working out — they’re about community. Last
accessed April 15, 2021.
Strava (2021b). Strava milestones: 50 million athletes and 3
billion activity uploads. Last accessed April 15, 2021.
Strava Inc. (2021). Strava Training. Version 188.12.
Taber, K. S. (2018). The use of cronbach’s alpha when
developing and reporting research instruments in sci-
ence education. Research in Science Education,
48(6):1273–1296.
Team, L. P. and Schmitz, C. (2021). LimeSurvey: An Open
Source survey tool.
Vaghefi, I. and Tulu, B. (2019). The continued use of mobile
health apps: insights from a longitudinal study. JMIR
mHealth and uHealth, 7(8):e12983.
Widmann, J. (2015). Facts & figures. Last accessed March
7, 2021.
icSPORTS 2021 - 9th International Conference on Sport Sciences Research and Technology Support
68
