
A Mixed Model for Identifying Fake News in Tweets from the 2020 U.S.
Presidential Election
V
´
ıtor Bernardes
1 a
and
´
Alvaro Figueira
2 b
1
Faculty of Sciences, University of Porto, Rua do Campo Alegre, Porto, Portugal
2
CRACS / INESCTEC, University of Porto, Porto, Portugal
Keywords:
Fake News, Social Media, Machine Learning, NLP.
Abstract:
The recent proliferation of so called “fake news” content, assisted by the widespread use of social media plat-
forms and with serious real-world impacts, makes it imperative to find ways to mitigate this problem. In this
paper we propose a machine learning-based approach to tackle it by automatically identifying tweets asso-
ciated with questionable content, using newly-collected data from Twitter about the 2020 U.S. presidential
election. To create a sizable annotated data set, we use an automatic labeling process based on the factual
reporting level of links contained in tweets, as classified by human experts. We derive relevant features from
that data and investigate the specific contribution of features derived from named entity and emotion recogni-
tion techniques, including a novel approach using sequences of prevalent emotions. We conclude the paper by
evaluating and comparing the performance of several machine learning models on different test sets, and show
they are applicable to addressing the issue of fake news dissemination.
1 INTRODUCTION
The issue of fake news is by no means recent, with
accounts of lies, propaganda and misinformation at
least as old as 3,000 years ago (Weir, 2009). Fake
news can be broadly defined as misleading informa-
tion presented as news. It has also been used to denote
any kind of misinformation, often published with the
goal of promoting a political or personal agenda, or
for financial gain through advertising revenues (Sam-
ple et al., 2019).
The recent surge in the use of the term “fake news”
has been attributed to former U.S. president Donald
Trump, who popularized the term during the 2016
election campaign, though, when he did so, he often
referred to negative press coverage of himself. Since
then, we have seen the proliferation of websites dedi-
cated to publishing false or misleading information,
which are also replicated by users or bots on sev-
eral different social media platforms. These platforms
themselves play a significant part in spreading these
articles due to their algorithms which are in many
cases optimized for maximizing user engagement.
Fake news have a number of defining attributes
a
https://orcid.org/0000-0002-5142-3818
b
https://orcid.org/0000-0002-0507-7504
that can be leveraged when trying to find solutions
to the problem of their dissemination. The first is, of
course, that they must present inaccurate information,
which can range from a small imprecision to a com-
plete fabrication. Another attribute of fake news con-
tent is its appeal to emotions, exploiting existing prej-
udices or biases in the reader to elicit a strong emo-
tional response (Sample et al., 2019). That can be ac-
complished in a number of ways, from using captivat-
ing pictures to employing linguistic features, such as
excessive use of adverbs. Fake news is also optimized
for sharing, and often spread in short bursts (Shu
et al., 2020) at a higher diffusion rate than real news
once they become viral (Guimar
˜
aes et al., 2021a).
The deluge of information conveyed on social net-
works makes it increasingly hard and in many cases
infeasible for an individual to verify sources and con-
firm content reliability, creating an opportunity to em-
ploy automated methods to assist in that task. Even
though a purely mechanical solution to this problem
is not likely to completely eliminate it, any tool that
can aid readers in distinguishing between legitimate
content and misinformation can help mitigate the is-
sue. To that end, this research has a number of related
contributions. One is creating an annotated data set of
fake news and legitimate content from Twitter, with
attributes for each tweet. We also implement differ-
Bernardes, V. and Figueira, Á.
A Mixed Model for Identifying Fake News in Tweets from the 2020 U.S. Presidential Election.
DOI: 10.5220/0010660500003058
In Proceedings of the 17th International Conference on Web Information Systems and Technologies (WEBIST 2021), pages 307-315
ISBN: 978-989-758-536-4; ISSN: 2184-3252
Copyright
c
2021 by SCITEPRESS – Science and Technology Publications, Lda. All rights reserved
307

ent machine learning models for automatically iden-
tifying tweets associated with fake content, and com-
pare and discuss their results. Finally, we investigate
the enhancement provided by features derived from
named entities and emotion recognition in the auto-
matic identification of fake news, and demonstrate
their applicability to help address that issue.
For the sake of brevity and consistency, we use
the term “fake tweets” to denote tweets that are as-
sociated with misleading or unreliable content, while
the term “non-fake tweets” denotes tweets associated
with reliable content.
2 THE DATA
Since the U.S. elections are an event with global im-
plications, we expected there would be many exam-
ples of fake news dissemination around it, as was the
case with the 2016 presidential election. Furthermore,
the volume of fake news posts tends to increase during
elections (Guimar
˜
aes et al., 2021a). For that reason,
we opted to use the 2020 U.S. presidential elections as
a case study, specifically with data posted on Twitter.
2.1 Data Collection
The data were collected in two different phases and
approaches. First, we used keywords and select ac-
counts (from the main candidates and their parties)
to collect data over a period of around three months,
from late September to late December in 2020, which
amounted to 21,675,705 unique tweets. That ap-
proach allowed us to gather data during the campaign,
through the voting period, and after the results were
certified. In order to test the generalization of our re-
sults, we also collected tweets during May 2021. For
the second collection we did not use keywords, col-
lecting instead tweets from four reputable U.S. and
U.K. news sources and from three accounts known for
publishing fake news content. This was done to verify
how well our solution was able to generalize to tweets
gathered in another context, and with potentially dif-
ferent content. The two reputable U.S. sources se-
lected were The New York Times and the Washing-
ton Post
1
, the two most frequent sources on the 2020
data set. No U.K. news outlets figured among the
most frequent sources. The Financial Times and The
Economist were chosen due to their factual reputation
and focus on economic and business issues, enabling
1
Since the initial data collection and labeling, the Wash-
ington Post’s factual reporting level from MBFC was re-
duced from “high” to “mostly factual” due to 2 recent failed
fact-checks.
us to verify model applicability beyond its original
context. The questionable outlets picked were the
three most frequent sources of fake news from the
2020 data set, namely The Gateway Pundit (by it-
self accounting for 48% of all fake news shared in
that data set), The Daily Mail (U.K.), and National
File. The Gateway Pundit is a popular website known
for publishing false information and conspiracy theo-
ries. It features in lists of fake news websites, such
as OpenSources
2
and PolitiFact
3
, and its founder’s
account was suspended by Twitter on February 6,
2021 due to posting misinformation about the 2020
U.S. presidential election. The Daily Mail is an es-
tablished British tabloid, with the highest circulation
among daily newspapers in the United Kingdom. It
has been criticized for publishing sensationalist and
inaccurate information, and has been banned as an un-
reliable source by Wikipedia. National File is a web-
site founded in 2019 that reports conspiracy and pseu-
doscience stories
4
. Its collaborators have been associ-
ated with several known fake news websites, such as
Breitbart, InfoWars, and The Gateway Pundit.
2.2 Data Preparation
Since this research involved performing several nat-
ural language processing (NLP) tasks to identify lin-
guistics attributes on tweet content, we selected only
tweets written in English. We also filtered for a min-
imum length of 100 characters or 20 words, values
close to the median values from the initial collection.
After applying these conditions, the data set was re-
duced from 21,675,705 to 13,060,234 tweets.
We also performed sentiment analysis on
the tweets using three different Python libraries:
TextBlob (Loria, 2018), VADER (Hutto and Gilbert,
2014), and Stanza (Qi et al., 2020). TextBlob is an
NLP library that provides a simple API for ease of
use, VADER is a sentiment analysis tool specifically
attuned to sentiments from social media posts, and
stanza is an NLP library maintained by the Stanford
NLP Group, with state-of-the-art accuracy on several
NLP tasks and trained on data sets including Twitter
posts for sentiment analysis.
One of the most elementary tasks in sentiment
analysis is classifying the polarity of a given piece of
text. Polarity is a measure that represents the senti-
ment of a piece of text, and ranges from negative, to
neutral, to positive. TextBlob and VADER provide a
compound score, from -1 to 1, indicating how nega-
2
https://github.com/OpenSourcesGroup/opensources
3
https://infogram.com/politifacts-fake-news-almanac-
1gew2vjdxl912nj
4
https://mediabiasfactcheck.com/national-file
WEBIST 2021 - 17th International Conference on Web Information Systems and Technologies
308

tive or how positive the input text is. In order to stan-
dardize the classification of positive, neutral, and neg-
ative text, we used typical threshold values (Hutto and
Gilbert, 2014): a polarity greater than or equal to 0.05
indicates positive text and a polarity less than or equal
to -0.05 indicates negative text, while values between
-0.05 and 0.05 indicate neutral text.
The result of the sentiment analysis was uneven,
with only 24.9% of tweets classified the same by all
libraries. Thus, to ensure consistency and to pro-
vide security that sentiment-based features would re-
flect the actual meaning contained in tweets, the 2020
data set was filtered to tweets where the same polarity
category was identified by all three libraries, leaving
3,252,751 tweets in the data set.
2.3 Data Labeling
One of the major challenges faced when dealing with
the fake news problem is obtaining a sizable anno-
tated data set. Some annotated data sets have been
published, for different platforms, but not many use
data from Twitter. They are undoubtedly useful tools
but many are limited in a number of ways. The
PHEME rumor data set (Zubiaga et al., 2016) con-
tains Twitter data annotated by journalists, however it
is relatively small (4,842 tweets in total) and focused
on rumors, not fake news. CREDBANK (Mitra and
Gilbert, 2015) is a collection of around 60 million
tweets from October 2014 to February 2015, manu-
ally annotated via Amazon Mechanical Turk. Those
tweets were grouped into events, which were then an-
notated with the aim of assessing general event cred-
ibility, not fine-grained tweets associated with fake
news content. FakeNewsNet (Shu et al., 2020) was
created in 2018 as an attempt to consolidate fake news
content, and the social context and spatiotemporal in-
formation of users sharing this content. It uses an au-
tomatic process for extracting fake news stories based
on rankings by fact-checking websites PolitiFact and
GossipCop, and obtaining the Twitter posts associated
with these stories. However, due to tweet decay, as of
November 2019, only 33% of news stories from Gos-
sipCop still had related tweet data available
5
.
The “data set decay problem”, described above,
is a common challenge to be faced in this field of
study. Tweets are removed over time, either by their
own authors or, more recently, by Twitter in its efforts
to counter the spread of fake news and misuse of its
platform
6
. Since Twitter terms of service restrict the
5
https://github.com/KaiDMML/FakeNewsNet/issues/37
6
https://help.twitter.com/en/rules-and-
policies/platform-manipulation
redistribution of tweet content to third parties
7
, and
only allow distributing data sets composed of iden-
tifier codes, these data sets have to be “hydrated” to
provide the complete data, which makes it important
to work with recently collected data in order to access
as much of it as possible. Even in our 2020 data set,
by the end of December (approximately three months
after the beginning of the data collection), approxi-
mately 19% of the tweets had already been deleted or
came from subsequently suspended accounts.
Collecting data ourselves provided more flexibil-
ity in how that data were obtained, enabling keyword-
based collection or account-based collection in re-
sponse to different needs, as well as changing the col-
lection context as necessary.
Manually annotating tweets for the reliability of
their contents is a massive undertaking with substan-
tial effort and, in many cases, expert knowledge re-
quired in order to create a sizable data set. There-
fore, we adopted a common approach to overcome
these scale challenges, by leveraging a curated list
of websites classified according to the their trustwor-
thiness to label tweets, as done in previous research
(Bovet and Makse, 2019; Guimar
˜
aes et al., 2021b;
Guess et al., 2019). Our systematic labeling pro-
cess is described in the following steps. First, only
tweets that contained links were selected. Then, the
domains those links pointed to were compared against
their level of factual reporting as determined by Me-
dia Bias Fact Check (MBFC) (Zandt, 2021). MBFC is
an independent fact-checking organization that classi-
fies news outlets in one of 6 levels of factual reporting,
ranging from “very low” to “very high”. Our criterion
was to consider tweets with links to websites classi-
fied as “very low” or “low” to be associated with ques-
tionable content, while we considered tweets with
links to websites classified as “high” or “very high”
to be associated with reliable content. This approach
allowed us to obtain a data set with 150,677 labeled
tweets, described in table 1. The imbalance seen in
the classes winds up reflecting the actual imbalance
of these types of posts in the real world. Approxi-
mately 5% of tweets with links were associated with
questionable content, a proportion similar to the 2016
election (Grinberg et al., 2019).
Table 1: Number of labeled tweets.
Link domain Total Excluding retweets
Questionable 7,057 3,613
Reliable 143,620 37,702
7
https://developer.twitter.com/en/developer-
terms/agreement-and-policy
A Mixed Model for Identifying Fake News in Tweets from the 2020 U.S. Presidential Election
309

The evolution of the data set size with the applica-
tion of the processing steps is shown in figure 1.
Figure 1: Changes in data set size (in thousands of tweets).
For the data collected during May 2021, such pro-
cessing was not necessary, as we chose tweets only
from known reliable or questionable sources.
2.4 Identification of Features
Once the data were gathered, processed, and labeled,
we went through the process of deriving features to
be used in our classification model. Since one of
our stated goals is to investigate the contribution of
named entities and emotion recognition to the identifi-
cation of fake news, the features will be split into two
groups: a baseline set of features, and an “extended”
set, containing all features present on the baseline set
plus features based on named entities and emotions.
The baseline features can be further divided into
three main groups: metadata from the author pro-
file, metadata from the tweet itself, and linguistic at-
tributes derived from the tweet content. These fea-
tures are described in detail in table 2.
2.4.1 Named Entity Recognition
Before trying to distinguish what constitutes real and
fabricated information, which is composed of facts,
one question must be answered first: What is a fact?
One simple answer is that a fact is something that oc-
curs at a given time, somewhere, and with or to some-
thing or someone (Figueira and Oliveira, 2017). In
other words, a fact should answer the questions of
“who,” “where,” and “when”. These answers can be
associated with named entities in the text, which are,
simply put, real-world objects that can be indicated
by a proper name. They are classified into different
categories, such as person, organization, or location,
and therefore can help provide the aforementioned an-
swers that characterize a fact.
There are automated ways of extracting named en-
tities from the text. We used two Python libraries for
that: spaCy (Honnibal et al., 2020), a Python NLP li-
brary built for speed, with high accuracy on named
entity recognition (NER) tasks, and models pre-
trained on text written for the web (blogs, news, and
comments). The other library was stanza (Qi et al.,
2020), described in section 2.2, with models pre-
trained on the comprehensive OntoNotes (Weischedel
et al., 2013) data set. These libraries provided similar
results, with the major difference being on classifying
mentions to Donald Trump. While spaCy had Trump
recognized as a person almost as often as it recog-
nized him as an organization, stanza was more consis-
tent, correctly identifying him as a person 94% of the
time. Regarding the remaining types of entities, both
libraries identified a similar number of occurrences.
For creating features, the results from both libraries
were compared and the entities recognized by stanza
were chosen, since they provided more concise and
accurate entities on the evaluated samples.
After the entities were extracted from the text,
they were grouped into five categories: who, where,
when, quantity, and other. This helped indicate
whether the tweets contained the information that
characterizes a fact, as discussed above. This group-
ing also helped reduce feature dimensionality by com-
bining the original 18 entity types (Weischedel et al.,
2013) into 5 different categories (table 3).
Based on that information, a number of features
were selected for the classification model. These in-
cluded the number of mentions of each entity cate-
gory in each tweet. In addition, upon observing that
tweets associated with fake news content potentially
made repeated mentions to the same entity per tweet,
the entity entropy was also computed to quantify the
variability of the entity set contained in each tweet.
We used the Shannon entropy (Shannon, 1948) with
a logarithm base of 2. Also, between the two most
common types of entities (person and organization,
respectively), it was observed that fake tweets tend to
favor mentions of person entities in contrast with non-
fake tweets. This observation led to a feature com-
puting the difference between the number of person
versus organization mentions.
2.4.2 Emotion Recognition
We also investigated the application of emotion
recognition to fake news identification. Our goal was
twofold: first, to investigate if any emotions were
more prevalent on tweets associated with fake news
than with reliable content, and also to investigate if
there were any sequences of emotions typical of one
of those classes.
To compute the emotions, we used the NRCLex
8
Python library. The library makes use of the National
Research Council Canada (NRC) word-emotion as-
sociation lexicon (Mohammad and Turney, 2013),
which contains associations of words with eight emo-
8
https://github.com/metalcorebear/NRCLex
WEBIST 2021 - 17th International Conference on Web Information Systems and Technologies
310
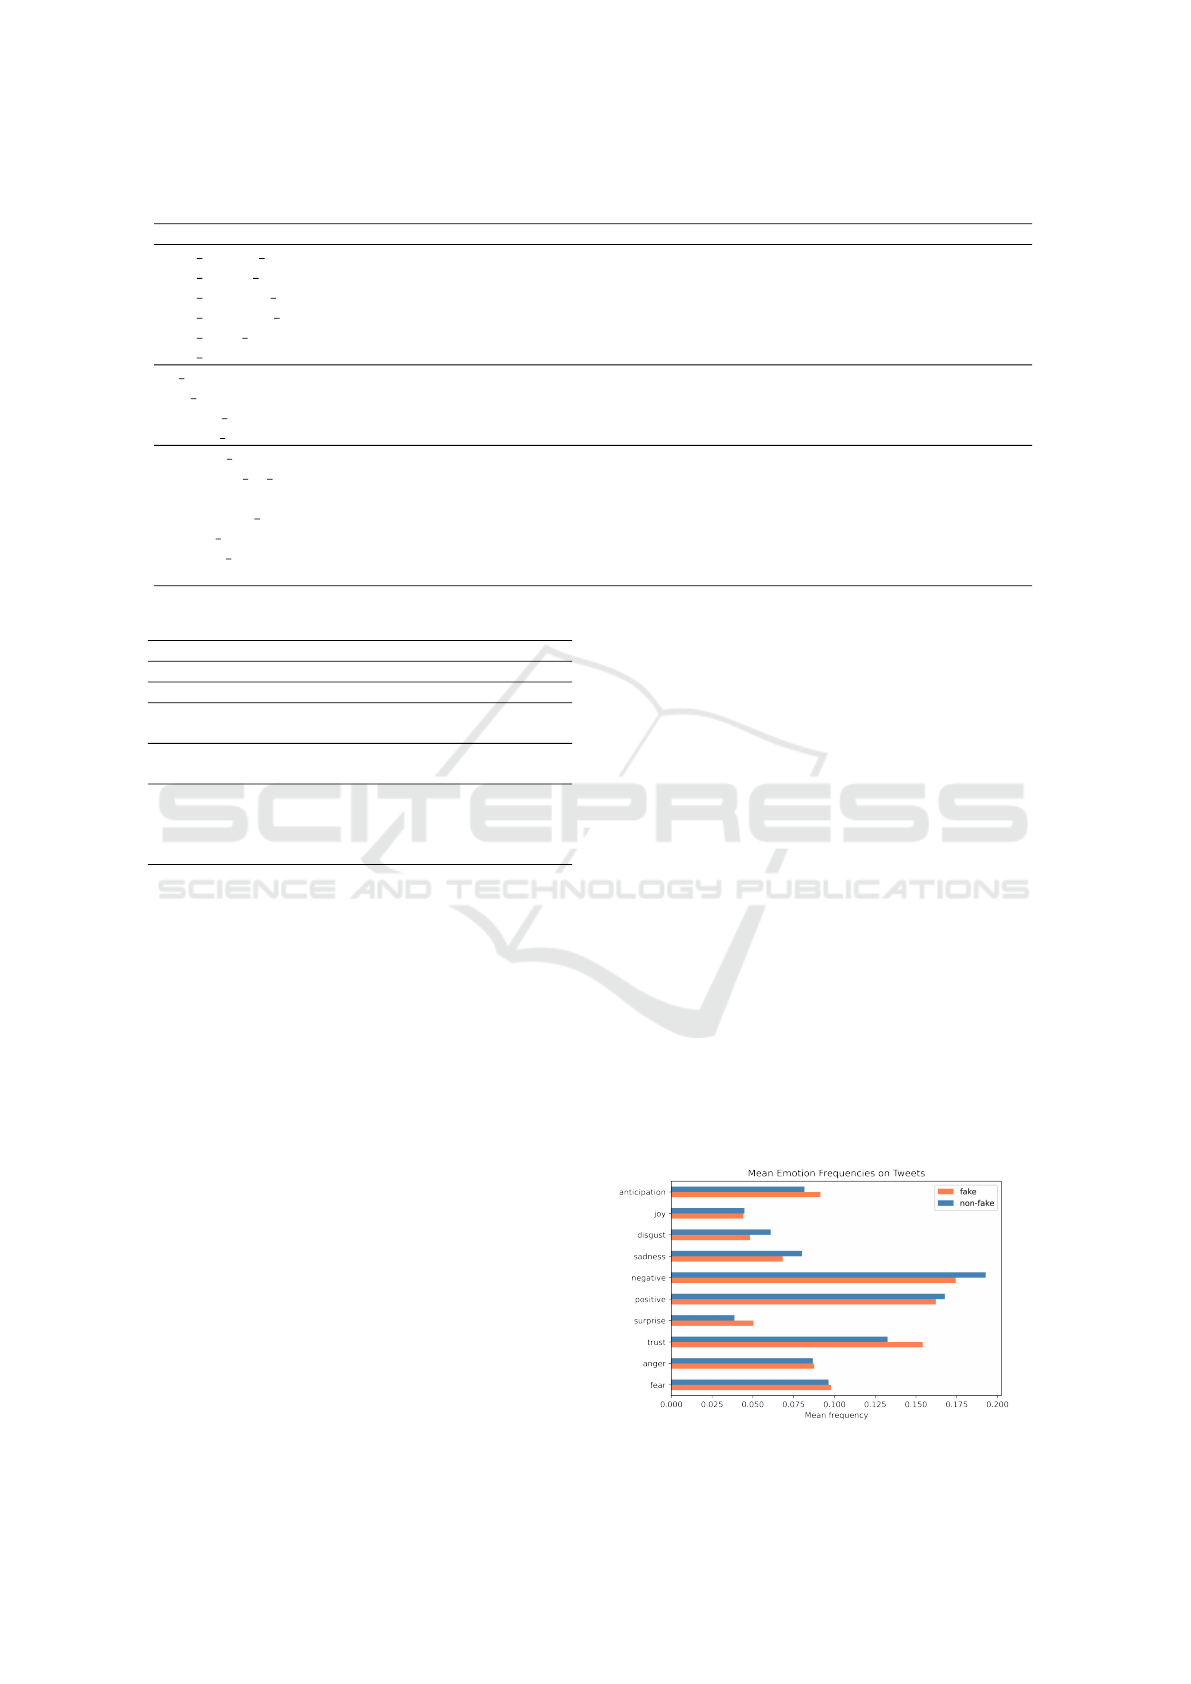
Table 2: Baseline features for each tweet.
Feature Description Feat. group
user statuses count Number of posts by tweet author.
User profile
user friends count Number of users tweet author follows.
user followers count Number of users followed by tweet author.
user favourites count Number of tweets marked as favorite by tweet author.
user listed count Number of public lists that contain tweet author.
user verified Flag indicating author’s account is verified by Twitter.
is RT Indicates if tweet is a retweet.
Tweet
metadata
has media Indicates if tweet contains media (image or video).
favorite count Number of times tweet was marked as favorite.
retweet count Number of times tweet was retweeted.
contains profanity Flags profanity/offensive content (as predicted by the profanity-check library).
Derived
from text
content
proportion all caps Proportion of words with all capital letters, excluding usernames, hashtags
and entities recognized by NER (e.g. acronyms).
exclamation count Number of exclamation points contained in tweet text.
adverb proportion Proportion of adverbs to words in tweet, excluding usernames and hashtags.
mention proportion Proportion of username mentions to words in tweet, excluding links.
polarity Polarity computed by the VADER library.
Table 3: Description of entity types and groups.
Entity group Entity type
Who ORGANIZATION, PERSON
When DATE, TIME
Where EVENT, GPE (Geopolitical entity),
LOCATION
Quantity CARDINAL, ORDINAL, PERCENT,
QUANTITY
Other FACILITY, LANGUAGE, LAW,
MONEY, NORP (Nationalities or reli-
gious or political groups), PRODUCT,
WORK OF ART
tions (anger, anticipation, disgust, fear, joy, sadness,
surprise, and trust) and two sentiments (negative and
positive). This lexicon was manually annotated by
crowdsourcing. On top of the 10,000 words in the
NRC lexicon, the NRCLex library uses NLTK Word-
Net synonyms to reach a total of 27,000 words.
Before computing the emotions, the text in each
tweet was pre-processed by being converted to lower
case, lemmatized using spaCy, had its links removed,
and hashtags converted to words by removing the
leading “#” character. A final step of pre-processing,
needed in this specific case study, was to remove
the word “Trump”. Due to the context of our case
study and data collection process, that word, refer-
ring to Donald Trump, is very common in the data
set. That proper noun is neutral and indicates no emo-
tion, however it is mistakenly recognized as the verb
“to trump” by the NRCLex library, resulting in a mis-
leading prevalence of the “surprise” affect associated
with that word in the emotion lexicon.
The computed emotions were used as the basis for
a number of features. Each word represents a num-
ber of emotions. For each emotion, its proportion
among all emotion indicators that were recognized
was computed. For example, let us suppose a sen-
tence contains two words with which emotions were
associated: “committed” (emotion trust), and “fore-
sight” (emotions trust and anticipation). There were
3 emotion indicators recognized in total, with a pro-
portion of 2/3 of trust and 1/3 of anticipation. These
would be the emotion proportion feature values for
this hypothetical sentence (with the proportion of the
remaining emotions set to zero). Differences were ob-
served between the mean proportion of emotions for
fake tweets and reliable tweets (figure 2), therefore
that proportion was used as a feature.
In addition, the raw emotion count was also used,
which means how many times in total any emotion
was recognized in the text. For example, a tweet with
3 words indicating fear and 2 words indicating anger
has a raw emotion count of 5. Since words can con-
vey more than one emotion at once, this value not only
represents how emotionally charged a tweet is, but it
also helps capture the intensity of emotions. When
comparing the distribution of raw emotion counts of
fake and non-fake tweets, tweets associated with re-
liable content surprisingly displayed a larger median
Figure 2: Mean emotion proportions.
A Mixed Model for Identifying Fake News in Tweets from the 2020 U.S. Presidential Election
311

value both of raw emotion counts and of the num-
ber of emotion-carrying words. This is unexpected as
fake news are often designed to elicit a strong emo-
tional response in the reader, resorting to several lin-
guistic resources to accomplish that goal.
2.4.3 Emotion n-Grams
The influence of the sequence of prevalent emotions
in a tweet was also investigated. For each sentence the
most frequent emotion was computed, resulting in a
sequence of prevailing emotions in a tweet. Then, se-
quences analogous to n-grams were extracted, where
each prevalent emotion represents one item in the se-
quence. Due to the short length of tweets, these se-
quences were limited to bigrams and trigrams of emo-
tions. The sequences represent the flow of emotions
through a piece of text, more precisely between one
sentence and the next in the case of bigrams. In case
of ties, where more than one emotion was prevalent
in a sentence, these were combined in a “composite”
emotion. For example, in case a sentence contained
the emotions fear and sadness with equal frequency,
these were combined into fear sadness. These com-
posite emotions were limited to a maximum of three
single emotions. In case more than three emotions
were the most frequent in a sentence, we considered
it was not possible to systematically determine the ac-
tual prevalent emotion in that sentence.
The n-grams were identified as tuples of emotions.
To illustrate, let us suppose a given tweet is composed
of three sentences. The first sentence has a prevalent
emotion of surprise, the second sentence has a preva-
lent emotion of anger, and the third, fear. In that
case, the tweet contains two corresponding emotion
bigrams, identified as (surprise, anger) and (anger,
fear). With the goal of identifying which n-grams,
if any, are typical of fake or non-fake tweets, the 20
most frequent n-grams were computed for each of
those classes in the training set (described below in
section 3.1). Out of the top bigrams for each class, in
many cases there was no overlap in the most frequent
n-grams in fake and non-fake tweets. These were con-
sidered typical of the respective class. In case the
frequent n-grams for fake and non-fake tweets over-
lapped, n-grams were considered typical if they were
at least 50% more frequent in one of the classes.
Due to the short length in tweets, usually trigrams
were infrequent and thus deemed not to be represen-
tative, so most of the analysis focused on bigrams.
This process resulted in two sets: bigrams consid-
ered typical of fake tweets and, conversely, bigrams
typical of non-fake tweets. The fake bigrams set in-
cluded 6 bigrams, while the non-fake set included 13
bigrams. For each tweet, we counted how many of its
bigrams belonged to the fake and non-fake bigrams
sets, and these two were used as extended features.
3 CLASSIFICATION MODEL
3.1 Samples
Due to the nature of the fake news problem, an imbal-
anced volume of reliable versus questionable content
is to be expected. In the keyword-based data set col-
lected from September to December 2020, the pro-
portion of fake tweets was approximately 5%. This
is common to many real-world data sets and consti-
tutes a problem to many machine learning algorithms
when attempting to learn a concept from an underrep-
resented class (Lema
ˆ
ıtre et al., 2017).
In order to mitigate that problem, a balanced ran-
dom sample S1 was taken from the initial labeled data
set. It is composed of 6,000 tweets, with an equal
amount from each class, and was further split into
training and test sets with an 80%-20% division.
In order to avoid any data leakage (Kaufman et al.,
2012), which might lead to overestimating perfor-
mance on new data in a production environment, only
data from the training set was used when computing
summaries and deriving features. Also, all retweets
(which contain the same text content) were removed
from the data set before extracting the sample and
splitting the between the training and test sets. If
they had been kept, the features set would contain
repeated values for several instances of tweets on
content-derived features. Therefore, the model would
be trained on instances with the same feature values
as some values on the test set, again overestimating
its performance on data it has not seen before. Figure
3 presents the data sampling process.
Figure 3: Obtaining training and test sets from S1.
In addition to the test set obtained from S1, a few
other sets were used for testing purposes. These were
derived from the May 2021 data set, and their primary
goal was to assess how well the classification model
could generalize its results to data temporally spaced
from the data the model was trained on. These ad-
ditional test sets are described in table 4. They were
also created maintaining class balance.
WEBIST 2021 - 17th International Conference on Web Information Systems and Technologies
312

Table 4: Additional test sets.
Set Description
T 1 400 tweets from 2021.
T 2 300 retweets from 2020 removed during training.
T 3 150 tweets from 2020, 150 tweets from 2021.
3.2 Methodology
Five different algorithms were selected for evaluation,
which included Naive Bayes, Decision Trees, Ran-
dom Forest, Support Vector Machines, and AdaBoost.
Also, we tested all models on two different feature
sets: baseline and extended (cf. section 2.4).
First, the S1 sample was split into training and test
sets with the proportions of 0.8 and 0.2, respectively.
Then the features from both sets were standardized by
removing the mean and scaling to unit variance (based
on the training set). The next step was running 5-fold
cross-validation on the training set for hyperparam-
eter tuning. Using the hyperparameter values which
provided the best results on the validation set, we re-
trained the models on the whole training set. They
were then evaluated on the test set for an estimate of
their performance on new data. Finally, we also tested
the models on the T 1, T 2, and T 3 sets (table 4).
4 RESULTS
The main metrics used to evaluate the models’ per-
formances were the F-measure, the precision, and the
recall. The metrics obtained from running the tuned
models against the test sets are presented on table 5.
We also compared the ROC curves of all models and
the respective AUC values (figure 4).
The algorithm with the best general performance
was the Random Forest. Even though the F-measure
was similar for the baseline and extended feature sets,
the information from the extended set enabled a 4%
increase in the precision, which was the highest for
S1. The most balanced result in terms of precision and
recall was provided by AdaBoost, which also saw an
increase in performance by using extended features.
Figure 4: ROC curves of tested models on S1.
The best overall results from the Random Forest is
also reflected in its AUC value (figure 4). Also, while
the simplest models (Naive Bayes and Decision Tree)
saw a decrease in the AUC with the extended features,
the AUC for the three models which provided the best
results increased with those features.
We also analyzed the F-measures on learning
curves based on the training set, which showed that
AdaBoost was quick to arrive at a performance close
to its final results, maintaining a similar F-measure
value after 2,000 samples. Other algorithms, though,
showed signs an overall ascending F-measure in the
validation sets, meaning they would likely benefit
from having more data available for training.
Regarding test sets T 1, T 2, and T 3, the results
particularly for the T 1 set are noteworthy, with an
improvement in all models in comparison to S1, es-
pecially for AdaBoost and Naive Bayes. This indi-
cates the models generalized well their performance
to other criteria of identifying fake news content. Per-
formance on T 2 was slightly inferior to that on S1,
which is somewhat unexpected as both are balanced
subsets from the 2020 data set. The results from the
T 3 set were as expected, intermediate values in accor-
dance with the results from the two previous sets.
One limitation we dealt with is that it was not pos-
sible to use links in tweets, i.e. the news source, as
basis for any features. The reputation of a source has
been considered by human evaluators as the most im-
portant factor in assessing tweet credibility (Ito et al.,
2015). In fact it is such a strong indicator that it
formed the basis for our automatic labeling process.
On the other hand, the features derived from tweets la-
beled based on links generalized well to tweets with-
out regards to the presence of links, and also with
other contents not related to the U.S. election.
5 DISCUSSION
With the goal of further comparing the baseline and
extended sets, we assessed the relative contribution
of each individual feature by considering the mean
decrease in impurity (MDI) to estimate their impor-
tance in three of the tested algorithms: Decision Tree,
Random Forest, and AdaBoost. The feature with the
most consistently large contribution was the propor-
tion of words in all capital letters, by itself responsi-
ble for 37% of the MDI in the baseline Decision Tree,
for example. Next, some features derived from the
user profile ranked with high importance, including a
user’s number of posts and the number of people they
follow. Along with other features based on linguistic
qualities and the tweet content, such as sentiment po-
A Mixed Model for Identifying Fake News in Tweets from the 2020 U.S. Presidential Election
313

Table 5: Metrics obtained for each test set.
Naive Bayes Decision Tree Random Forest SVM AdaBoost
base. ext. base. ext. base. ext. base. ext. base. ext.
S1
f1 0.68 0.68 0.68 0.66 0.73 0.74 0.69 0.72 0.72 0.73
precision 0.54 0.57 0.76 0.68 0.79 0.83 0.75 0.75 0.74 0.75
recall 0.91 0.85 0.62 0.64 0.68 0.68 0.64 0.69 0.69 0.72
T 1
f1 0.94 0.91 0.77 0.78 0.89 0.86 0.85 0.75 0.91 0.91
precision 0.99 0.99 0.81 0.79 1.00 0.99 0.96 0.73 0.99 0.98
recall 0.90 0.83 0.73 0.77 0.80 0.76 0.76 0.77 0.85 0.85
T 2
f1 0.67 0.64 0.62 0.60 0.71 0.73 0.59 0.63 0.71 0.65
precision 0.51 0.51 0.72 0.67 0.70 0.76 0.60 0.52 0.62 0.53
recall 0.95 0.88 0.55 0.55 0.72 0.69 0.58 0.78 0.82 0.83
T 3
f1 0.79 0.79 0.69 0.67 0.76 0.80 0.67 0.69 0.79 0.79
precision 0.68 0.69 0.74 0.69 0.79 0.86 0.74 0.60 0.77 0.71
recall 0.93 0.91 0.64 0.65 0.74 0.75 0.62 0.80 0.82 0.88
larity, proportion of adverbs, and number of username
mentions, these accounted for 86% of the MDI in the
baseline Random Forest, for example.
When considering the extended set of features, we
observed the baseline features described above were
still the major contributors in MDI. The baseline Ran-
dom Forest had the same top 7 features ranked for im-
portance as the model with extended features. How-
ever, with extended features they accounted of 45% of
the MDI, instead of 86%. A major part of the remain-
ing contribution was provided by features based on
emotion recognition, most notably emotion frequen-
cies. Collectively, their highest contribution among
the three models was a 34% MDI with Random For-
est. Among entity-based features, entropy had the sin-
gle highest contribution in the three models.
Therefore, while the top baseline features still
ranked higher on the extended models, the contribu-
tion of the extended features was evident when assess-
ing their importance, supporting the results discussed
on section 4. It is also interesting to note that roughly
the same features, both on the baseline and extended
sets, ranked similarly on different algorithms, attest-
ing to the validity of their general importance.
There are several promising possibilities for ex-
tending this work. One option we plan to explore
is narrowing down the emotions recognized for each
word. Since the NRC lexicon usually identifies sev-
eral emotions per word, when computing emotion fre-
quencies in a sentence, these emotions often overlap,
potentially diluting some of the information. Being
able to precisely identify a single prevalent emotion
in a word would likely lead to a clearer representation
of the overall prevalent emotions in a sentence. One
possible approach to tackle this problem is leverag-
ing the context each word appears in. For example,
if a word that conveys the emotions of fear and sad-
ness appears between two segments with the prevail-
ing emotion fear, that word could be deemed to ex-
press the fear as well, helping to filter out extraneous
emotions and provide a more precise identification.
One additional possibility for enhancing the emo-
tion recognition precision is leveraging the context
specific to the investigated data. In the 2020 data
set, the most frequent emotion is trust. Upon ana-
lyzing the words associated with that emotion, most
were recognized to relate to the election or to official
authorities. As our main data set relates to the U.S.
elections, that behavior is to be expected, and dimin-
ishes the level of information conveyed by identifying
the emotion trust, analogous to stop words in NLP.
6 CONCLUSIONS
Since the popularization of the term “fake news” by
former U.S. president Donald Trump in 2016, the
problem of their proliferation has been nothing but
amplified, going so far as to potentially affect elec-
tion outcomes, influence economic decisions, neg-
atively impact public health and the public debate,
mine trust in news organizations, and ultimately skew
people’s perceptions about the world. This is a se-
rious collective problem which requires a multidis-
ciplinary approach to its mitigation, from reeducat-
ing readers about news consumption to technologi-
cal solutions that help reduce the reach of misinfor-
mation. As the widespread use of social media has
contributed to the dissemination of fake news in ever-
increasing volumes, any tool that helps identify these
items, hopefully automatically, is an important asset
in the arsenal against fake news.
To that end, in this paper we propose a machine
learning-based model to automatically identify posts
associated with fake news on Twitter. We provide an
overview of the data sets created for evaluating the
automatic identification of fake news, using the 2020
U.S. presidential election as the main context, and
also describe the data processing and the automated
WEBIST 2021 - 17th International Conference on Web Information Systems and Technologies
314

labeling approach used. We present and compare the
results of applying different machine learning mod-
els to that data, further comparing two different sets
of features. We demonstrate the satisfactory perfor-
mance of many models, notably based on Random
Forest and AdaBoost, on different test sets, generated
with different approaches. This shows the model is
capable of generalizing to other contexts of identify-
ing fake news. In the mainly keyword-based S1 data
set, our models achieved a best F-measure of 0.74. In
other test sets, results were as high as 0.94.
We investigated and showed the contribution of
employing features derived from named entities and
emotion recognition in enhancing the automatic iden-
tification of fake news. In the three algorithms which
consistently provided the best overall results, these
features helped improve the F-measure in three of the
four test sets used. We believe such a model is an im-
portant tool with several possibles uses, from alerting
end users about potentially unreliable content to as-
sisting organizations in automatically filtering ques-
tionable content for screening, and can contribute to
the mitigation of this problem that affects us all.
ACKNOWLEDGEMENTS
This work is financed by National Funds through
the Portuguese funding agency, FCT – Fundac¸
˜
ao
para a Ci
ˆ
encia e a Tecnologia, within project
UIDB/50014/2020.
REFERENCES
Bovet, A. and Makse, H. A. (2019). Influence of fake news
in twitter during the 2016 us presidential election. Na-
ture communications, 10(1):1–14.
Figueira,
´
A. and Oliveira, L. (2017). The current state of
fake news: challenges and opportunities. Procedia
Computer Science, 121:817–825.
Grinberg, N., Joseph, K., Friedland, L., Swire-Thompson,
B., and Lazer, D. (2019). Fake news on twitter
during the 2016 us presidential election. Science,
363(6425):374–378.
Guess, A., Nagler, J., and Tucker, J. (2019). Less than you
think: Prevalence and predictors of fake news dissemi-
nation on facebook. Science advances, 5(1):eaau4586.
Guimar
˜
aes, N., Figueira,
´
A., and Torgo, L. (2021a). An or-
ganized review of key factors for fake news detection.
arXiv preprint arXiv:2102.13433.
Guimar
˜
aes, N., Figueira,
´
A., and Torgo, L. (2021b). To-
wards a pragmatic detection of unreliable accounts on
social networks. Online Social Networks and Media,
24:100152.
Honnibal, M., Montani, I., Van Landeghem, S., and Boyd,
A. (2020). spaCy: Industrial-strength Natural Lan-
guage Processing in Python.
Hutto, C. and Gilbert, E. (2014). Vader: A parsimonious
rule-based model for sentiment analysis of social me-
dia text. In Proceedings of the International AAAI
Conference on Web and Social Media, volume 8.
Ito, J., Song, J., Toda, H., Koike, Y., and Oyama, S. (2015).
Assessment of tweet credibility with lda features. In
Proceedings of the 24th International Conference on
World Wide Web, pages 953–958.
Kaufman, S., Rosset, S., Perlich, C., and Stitelman, O.
(2012). Leakage in data mining: Formulation, detec-
tion, and avoidance. ACM Transactions on Knowledge
Discovery from Data (TKDD), 6(4):1–21.
Lema
ˆ
ıtre, G., Nogueira, F., and Aridas, C. K. (2017).
Imbalanced-learn: A python toolbox to tackle the
curse of imbalanced datasets in machine learning. The
Journal of Machine Learning Research, 18(1):559–
563.
Loria, S. (2018). textblob documentation. Release 0.15, 2.
Mitra, T. and Gilbert, E. (2015). Credbank: A large-scale
social media corpus with associated credibility an-
notations. In Proceedings of the International AAAI
Conference on Web and Social Media, volume 9.
Mohammad, S. M. and Turney, P. D. (2013). Crowdsourc-
ing a word–emotion association lexicon. Computa-
tional intelligence, 29(3):436–465.
Qi, P., Zhang, Y., Zhang, Y., Bolton, J., and Manning, C. D.
(2020). Stanza: A Python natural language processing
toolkit for many human languages. In Proceedings of
the 58th Annual Meeting of the Association for Com-
putational Linguistics: System Demonstrations.
Sample, C., Justice, C., and Darraj, E. (2019). A model
for evaluating fake news. The Cyber Defense Review,
pages 171–192.
Shannon, C. E. (1948). A mathematical theory of communi-
cation. The Bell system technical journal, 27(3):379–
423.
Shu, K., Mahudeswaran, D., Wang, S., Lee, D., and Liu,
H. (2020). Fakenewsnet: A data repository with news
content, social context, and spatiotemporal informa-
tion for studying fake news on social media. Big Data,
8(3):171–188.
Weir, W. (2009). History’s Greatest Lies: The Startling
Truths Behind World Events Our History Books Got
Wrong. Fair Winds Press.
Weischedel, R., Palmer, M., Marcus, M., Hovy, E., Prad-
han, S., Ramshaw, L., Xue, N., Taylor, A., Kaufman,
J., Franchini, M., et al. (2013). Ontonotes release 5.0
ldc2013t19. Linguistic Data Consortium, Philadel-
phia, PA, 23.
Zandt, D. V. (2021). Media Bias/Fact Check
Methodology. Accessed June, 2021 from
https://mediabiasfactcheck.com/methodology/.
Zubiaga, A., Liakata, M., Procter, R., Wong Sak Hoi, G.,
and Tolmie, P. (2016). Analysing how people orient
to and spread rumours in social media by looking at
conversational threads. PloS one, 11(3):e0150989.
A Mixed Model for Identifying Fake News in Tweets from the 2020 U.S. Presidential Election
315
