
Passing to Win: Using Characteristics of Passing Information
for Match Winner Prediction
Taihu Li
1,2 a
, Jeewoo Yoon
1,2 b
, Daejin Choi
3,∗ c
and Jinyoung Han
1,2,∗ d
1
Department of Applied Artificial Intelligence, Sungkyunkwan University, Seoul, Korea
2
RaonData, Seoul, Korea
3
Department of Computer Science & Engineering, Incheon National University, Incheon, Korea
Keywords:
Machine Learning, Football, Pass Map, Match Winner Prediction.
Abstract:
Predictingthe football match results has received great attention both in sports industry and academic fields.
Many researchers have studied on predicting the match outcome using the simple features such as the number
of shots and passes. However, little attention has been paid to using pass interaction features, which can
represent how players in a match interact to each other. To this end, we propose a win-lose prediction model
that predicts a match result using the pass interaction and other features, achieving high accuracy of 79.5%. By
conducting an ablation study, we find that the proposed interaction features play an important role in accurately
predicting match results. We believe our work can provide important insights both for industry and academic
researchers who want to understand the characteristics of winning teams.
1 INTRODUCTION
Recent advances in computing technology have
driven researchers to analyze diverse information of
football matches. Researchers can access not only
general match statistics such as match winner, num-
ber of shoots in a match, or total number of passes in
a match, but also in-game statistics of individual play-
ers (e.g., total running distances) and even interac-
tions among the players such as passing data between
two players (Linke et al., 2020; Pons et al., 2019).
Such comprehensive information can enable conduct-
ing an in-depth analysis on winning matches or in-
dividual playing performance (Johansen et al., 2013;
Bastida Castillo et al., 2018).
The abundant and comprehensive match data
has spurred researchers in industry and academia
to investigate match winners (Harrop and Nevill,
2014; Clemente et al., 2015) or winning strate-
gies (Georgievski et al., 2019), which has provided
valuable insights into understanding the key factors
to win a match. Harrop et. al revealed that increas-
a
https://orcid.org/0000-0002-2118-721X
b
https://orcid.org/0000-0002-9067-8653
c
https://orcid.org/0000-0001-5070-360X
d
https://orcid.org/0000-0002-8911-2791
∗
Corresponding Author
ing success rates of passes and shots and decreasing
the number of passes and dribbles are important to
win a match (Harrop and Nevill, 2014). Clemente et.
al built a players’ network and showed that the net-
works of winning teams tend to be dense (Clemente
et al., 2015). Georgievski et. al suggested that
the current rank of the team in a league need to
consider the degree of offensiveness/defensiveness of
teams (Georgievski et al., 2019).
In recent years, there have been much efforts on
predicting the match results or match winners, us-
ing simple statistical information of matches. For
example, Razali et. al proposed a machine learn-
ing model based on Bayesian Networks, which uses
match statistics like number of shots (Razali et al.,
2017). Pettersson et. al used a Long Short-term Mem-
ory (LSTM) model with the history of the match re-
sults of two teams to predict the match winner (Pet-
tersson and Nyquist, 2017). Hassan et. al proposed
an Artificial Neural Network (ANN) to predict the
match results using the data collected from TRACAB
that utilizes a beam-forming sensor & receiver equip-
ments (Hassan et al., 2020). However, although these
studies have provided valuable insights into under-
standing statistical features in predicting match win-
ners, little research has paid attention to model and
analyze how interactions among players through pass-
ing in a match can be used to predict match winners.
54
Li, T., Yoon, J., Choi, D. and Han, J.
Passing to Win: Using Characteristics of Passing Information for Match Winner Prediction.
DOI: 10.5220/0010659000003059
In Proceedings of the 9th International Conference on Sport Sciences Research and Technology Support (icSPORTS 2021), pages 54-60
ISBN: 978-989-758-539-5; ISSN: 2184-3201
Copyright
c
2021 by SCITEPRESS – Science and Technology Publications, Lda. All rights reserved
In this paper, we propose a machine learning-
based prediction model for match winners, which
adopts both statistical match traits as well as interac-
tion patterns of two teams in a match. To this end, we
collected the match results and their associated data
including team statistics (e.g., possession rate), play-
ers’ individual statistics (e.g., number of ball steals),
and the pass matrices whose element is the pass-
ing counts between two players, from CHAMPION
DAtA
1
that logs all the football matches in Chinese
Super League and A League. Using the collected
dataset, we model the passing interaction as a directed
graph, called a pass map. Based on both the charac-
teristics of the pass maps (e.g., betweenness central-
ity in a graph) and the statistical information of two
teams in a match, the proposed model can predict the
match winner with 79.5% accuracy.
2 METHODS
We describe our methodology for developing a ma-
chine learning-based model to predict match win-
ners. In particular, we first describe the data col-
lection method, e.g., crawling the match results with
comprehensive in-game statistics and passing infor-
mation. After modeling the passing patterns of each
team in a match as a pass map, we extract two feature
sets: (i) statistical features including in-game traits,
and (ii) interaction features with the characteristics
of the passing patterns. We then describe the pro-
posed machine learning-based model that can predict
the match result using the extracted features.
2.1 Data Collection
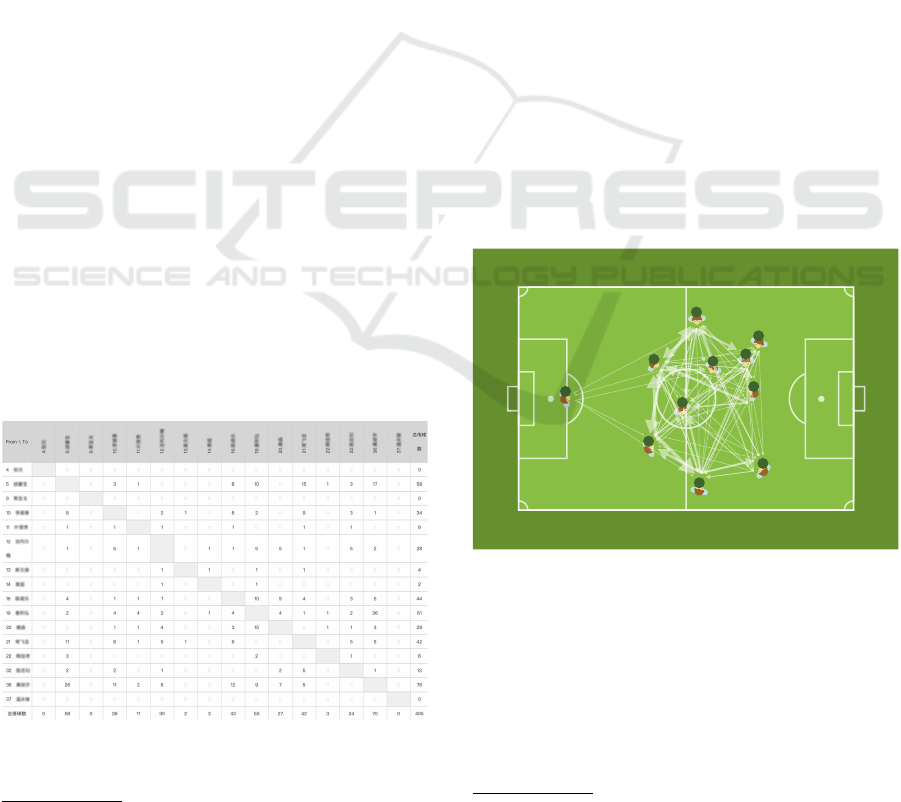
Figure 1: A screenshot of a pass matrix available on
CHAMPION DATA. Note that we anonymized the players’
names.
1
http://data.champdas.com/
We build the dataset to detect which team will win
the match by collecting the match information from
CHAMPION DATA, which provides the results of
the football matches in Chinese Super League and A
League with diverse match-relevant information in-
cluding statistical in-game traits both form the per-
spectives of teams and players, and the pass matrices
that represent how frequent players pass to each other.
An example of a pass matrix is illustrated in Figure 1.
That is, each row and column in a pass matrix M rep-
resents a player, and the element of the matrix at i-th
row and j-th column (i.e,, M
i j
) indicates the number
of passes from player i to player j. Note that two pass
matrices for each team are provided for a match. To
collect the match-related information from CHAM-
PION DATA, we developed a web crawler that fetches
the web pages including the match results with de-
tailed in-game information. Using the crawler, we
collected 2,682 match data from 75 teams. After fil-
tering the tie match data, we finally gathered the 1,999
match results, 3,998 pass matrices, and statistical in-
formation of individual players and teams. Among
them, we use 80% as the training set of our model
ans use the remaining 20% for testing. Table 1 sum-
marizes in-game statistical information of individual
players and teams, respectively.
2.2 Pass Map Construction
27
14
6
25
33
8
7
28
5
39
17
Figure 2: An illustration of an example of a pass map of a
team in a match.
The passing information among team players has
been considered as an important factor to infer team’s
characteristics or even success in a match. Inspired by
this, we construct a pass map by using NetworkX
2
to characterize the passing patterns among the team
players in a match. That is, a pass map is defined as a
directed graph G = (V, E, W ), where V and E are the
2
https://networkx.org/
Passing to Win: Using Characteristics of Passing Information for Match Winner Prediction
55
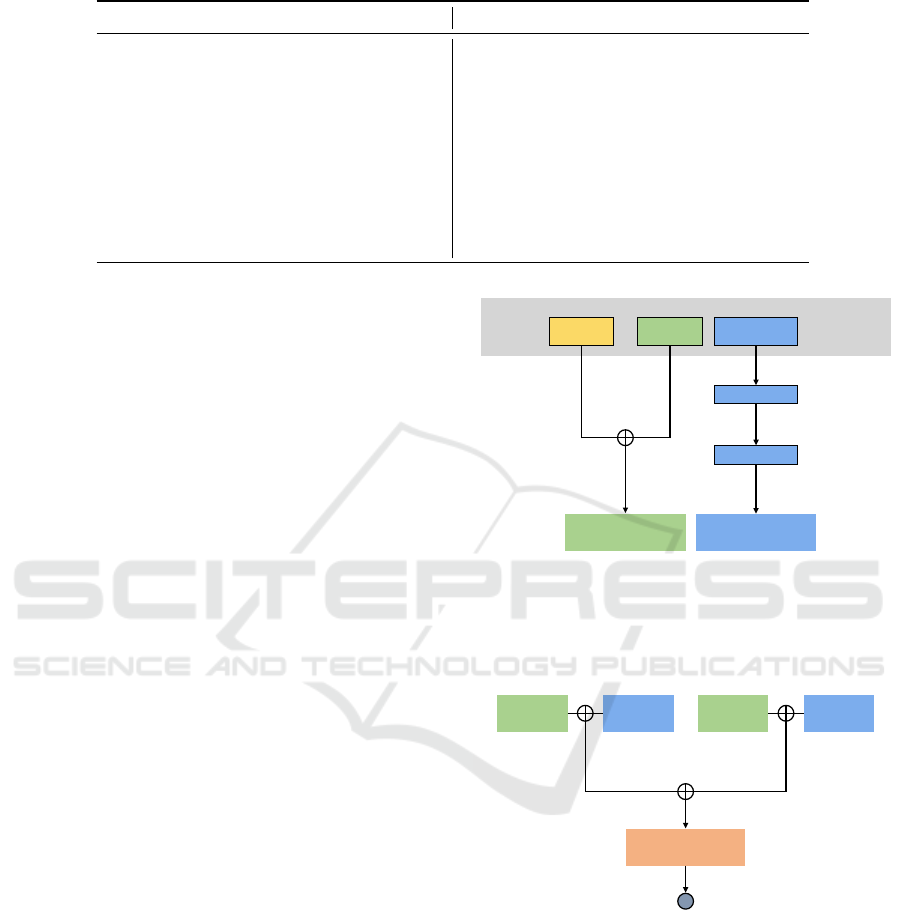
Table 1: The collected in-game statistical information of individual players and teams.
Team Stats. Player Stats.
# of shots, # of shots on target,
# of penalty kicks, # of free kicks,
# of front court free kicks, # of corner kicks
Possession rate, # of total passes,
Pass success rate, Dominance rate
# of key passes, # of cross passes,
# of break through, # of fouls obtained,
# of steals, # of intercepts, # of catches,
# of offside violations, # of clearance kicks,
# of pass blocks, # of shoot blocks,
# of yellow cards, # of red cards,
# of short passes, # of long passes,
Short pass rate (%), Long pass rate (%),
Direct pass rate (%), Cross pass rate (%),
Diagonal pass rate (%), Back pass rate (%)
sets of players (of a team) and passes among the play-
ers, respectively. Note that an edge e
i j
from node i and
node j exists when player i passes the ball to player j.
The weight of e
i j
is computed as the number of passes
from node i to node j. An example of a pass map of a
team in a match is illustrated in Figure 2.
2.3 Feature Extraction
From the collected dataset and the constructed pass
maps, we extract the features that are used to detect
which team wins the match. In particular, for a given
team, we compute two feature sets of the features, sta-
tistical and interaction features, described as follows:
• Statistical Features: We use 10 team and 21
player features, described in Table 1, as the statis-
tical features in a match. To compute the features
of a team from the players’ statistics, we calculate
the average values of the individual statistics of 11
players in the starting lineup.
• Interaction Features: We use the characteris-
tics of the pass maps of two teams in a match as
the interaction features. We use the NetworkX to
compute the following node features: in-degree,
out-degree, degree centrality (Tang et al., 2013),
closeness centrality (Bavelas, 1950), and betwee-
ness centrality (Freeman, 1977), each of which is
summarized in Table 2. Since the features are
computed from individual player’s perspective,
we simply compute average values and standard
deviations of each feature to generate a interac-
tion feature set of a team.
To compute the features of a match, we simply
concatenate two feature sets of each team (home and
away), which finally results in 92 statistical and 20 in-
teraction features for each match. See Table 3 in Ap-
pendix for all the listed features. The whole process
of feature extraction is illustrated in Figure 3.
Collected Dataset
Pass Matrices
Player Stats
Team Stats
Average,
Standard deviation
Statistical Features
Pass Map
Node Characterization
Interactional Features
Node Features
Average,
Standard deviation
Figure 3: An illustration of feature extraction process.
2.4 Match Winner Prediction Model
Statistical
Features
Interactional
Features
Statistical
Features
Interactional
Features
Home Team
Away Team
Win-Lose
Prediction Model
Win or Lose?
Figure 4: Overall architecture of the match winner predic-
tion model.
We define the prediction task that predicts which team
will win the match as a binary classification prob-
lem. That is, we first divide the given the constructed
dataset D = {(x
i
, y
i
)}
n
i=1
(x
i
∈ R
m
, y
i
∈ {1...c}) with n
matches, m match features (i.e., statistical and inter-
action features), and c match result classes (i.e., pos-
itive when home team wins the match, negative oth-
erwise) into two datasets D
tr
and D
test
, which repre-
sent the datasets for training and testing, respectively.
We then train our model using D
tr
and finally predict
icSPORTS 2021 - 9th International Conference on Sport Sciences Research and Technology Support
56
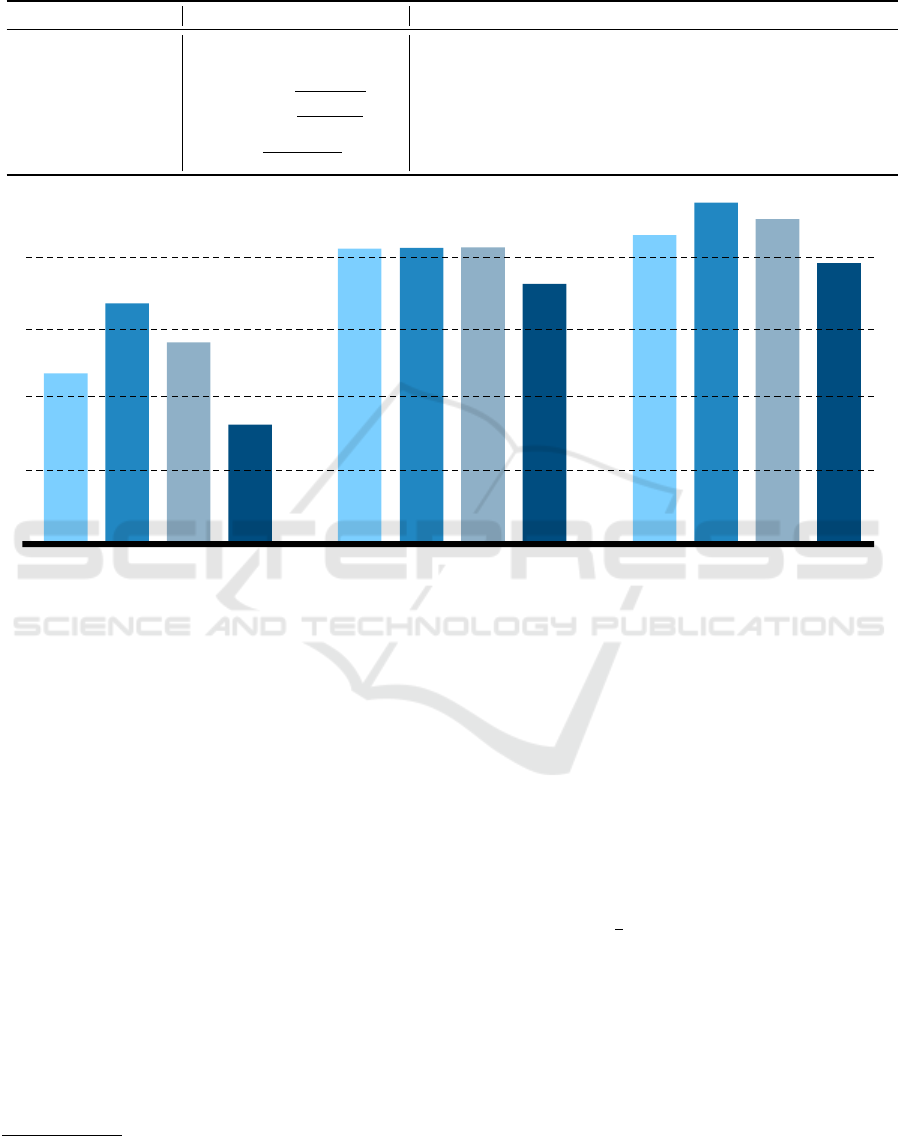
Table 2: Five interaction features with their definitions and descriptions. g is the number of nodes and i is the index of the
nodes. x
i j
represents the total number of direct connections between N
i
and other g − 1 nodes, dis(i, j) indicates the distance
from node i to node j, and sd( j, i, k) means the shortest path from j to k passes through i.
Characteristics Definition Description
In-degree – How many players pass the ball to the given player
Out-degree – How many passes are concentrated to the player
Degree centrality C
D
(N
i
) =
∑
g
j=1
x
i j
(i6= j)
g−1
How a given node plays a central role in connecting other nodes
Closeness centrality C
C
(N
i
) =
g−1
∑
g
j=1
dis(i, j)
How many a given player receives direct passes from other players
Betweenness centrality C
B
(N
i
) =
∑
g
j,k=1
sd( j,i,k)
∑
g
j,k=1
( j,k)
, ( j 6= k) How essential a given player is to connect small groups of the players
Precision Recall F1 Accuracy Precision Recall F1 Accuracy Precision Recall F1 Accuracy
0.625
0.728
0.673
0.558
0.765
0.8110.8120.812
0.795
0.838
0.848
0.828
INTER. ONLY STATS. ONLY STATS. + INTER.
Figure 5: Performance results of the match result prediction model. INTER. ONLY, STATS. ONLY, and STATS. + INTER.
denote interaction features only, statistical features only, and statistical + interaction features, respectively.
the match result class c based on the features (i.e.,
x
i
∈ R
m
) in D
test
.
To solve the classification problem, we first inves-
tigated popular machine-learning-based classifiers in-
cluding Support Vector Machines (Gunn et al., 1998),
Random Forest (Breiman, 2001), and eXtreme Gradi-
ent Boosting (XGBoost) (Chen and Guestrin, 2016).
After performance comparison, we select XGBoost as
the prediction model as it outperforms others. In the
experiment, we use the scikit-learn
3
and the XGBoost
python library
4
to conduct training and testing. The
formal definition of XGBoost is defined as follows:
ˆy
i
= φ(x
i
) =
K
∑
k=1
f
k
(x
i
) (1)
where ˆy
i
, f
k
, K, and f
k
(x
i
) are the predicted class for
the i-th match, k-th independent tree, the number of
trees, and the prediction score given by the k-th inde-
pendent tree on the match features extracted from the
3
https://scikit-learn.org/
4
https://xgboost.readthedocs.io/
i-th match, respectively. The objective function of the
model, L(φ), can be calculated as follows:
L(φ) =
∑
i
l(y
i
, ˆy
i
) +
∑
k
Ω( f
k
) (2)
where l and
∑
k
Ω( f
k
) are the loss function between
the predicted class ˆy
i
and the target class y
i
and the
regularization term that penalizes the complexity of
the model, respectively. Here, we use squared er-
ror as the loss function. As a regularized term, we
use Ω( f ) = γT +
1
2
λ||w||
2
, where λ and γ controls the
penalty for the number of leaves T and magnitude of
the leaf weights w, respectively.
3 RESULTS
In this section, we report the performance results of
the prediction model for match winners. We then ex-
plore what features play important roles in the predic-
tion.
Passing to Win: Using Characteristics of Passing Information for Match Winner Prediction
57
3.1 Model Performance
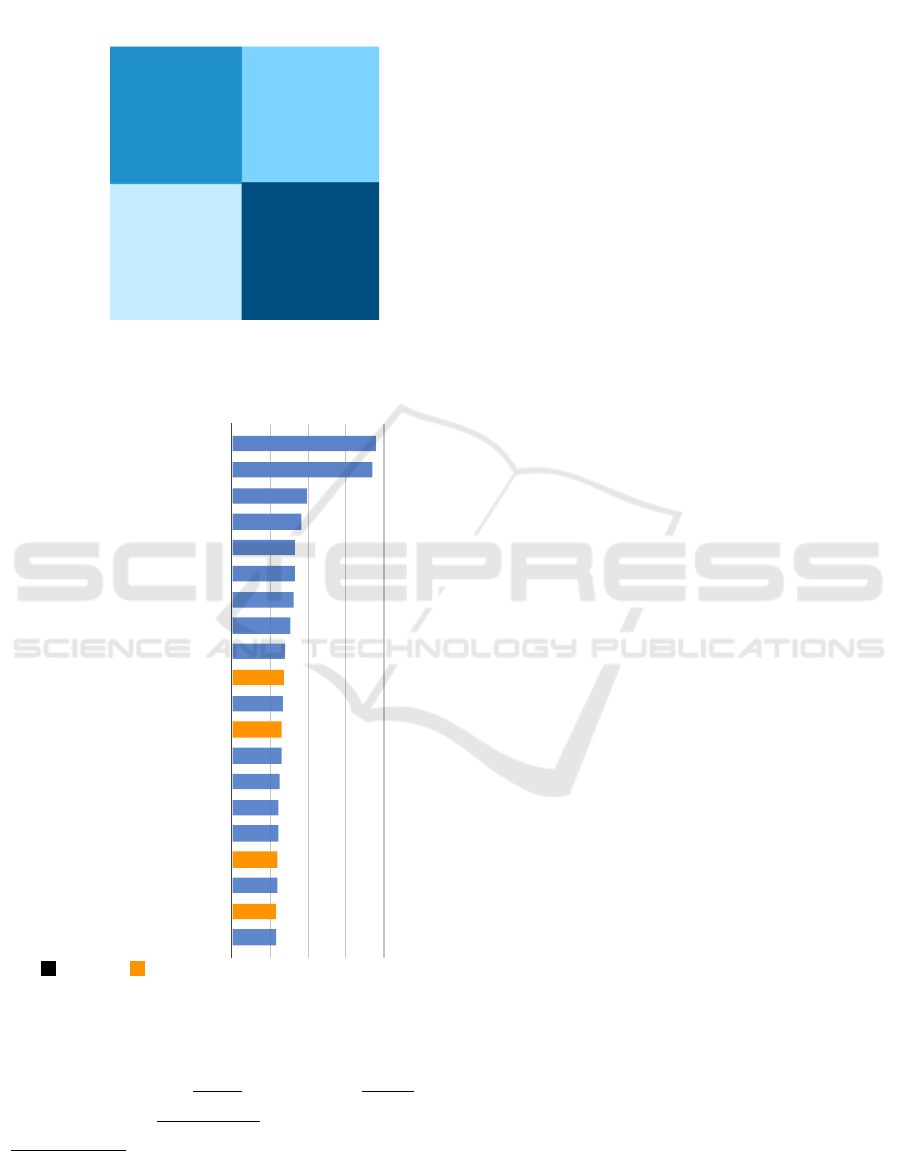
Home win / Away lose Away win / Home lose
Home win / Away loseAway win / Home lose
Predict
Acutal
106
38
44
212
Figure 6: Confusion matrix of the model trained with both
team and interaction features.
# of shots on target (Home)
# of shots on target (Away)
# of total passes (Home)
# of total passes (Away)
Avg. of diagonal pass rate (Home)
Std. of # of cross pass (Away)
Avg. of direct pass rate (Away)
Dominance rate (Home)
Pass success rate (Home)
Std. of # of long pass (Home)
Std. of # of cross pass (Home)
Std. of # of clearance kick (Away)
# of team shots (Home)
Std. of # of long pass (Away)
Avg. of cross pass rate (Away)
Std. of # of clearance kick (Home)
0
0
0
0
0
0
0
0
0
0
0
0
0
0
0
0
0
0
0
0
Std. of closeness centrality (Away)
0
30
60
90
120
35
35
36
36
37
37
38
39
39
40
41
42
46
49
50
50
55
59
111
113
Std. of out-degree (Away)
Std. of degree centrality (Home)
Std. of in-degree (Home)
Statistical
Interactional
Feature Importance
Figure 7: Top 20 Important Features.
Figures 5 and 6 show the prediction result of the
proposed model. Here, we report four performance
metrics: (i) Precision (
T P
T P+FP
), (ii) Recall (
T P
T P+FN
),
(iii) F1 score (2 ×
precision×recall
precision+recall
), and (iv) Accuracy
(
T P+T N
T P+T N+FP+FN
) where TP, FP, FN, and TN represent
the true positive, false positive, false negative, and
true negative, respectively. In addition, we evaluate
the proposed model with three different feature sets:
(i) interaction, (ii) statistical, and (iii) both (i.e., in-
teraction + statistical). Overall, the model using both
feature sets outperforms all the other models. The ac-
curacy of the model is 79.5% while the ones of the
models solely using interaction or statistical features
are 55.8% and 76.5%, respectively. When we look
at the confusion matrix in Figure 6 that indicates the
number of the classified instances, the total number
of the instances correctly classified (upper-left and
lower-right) is 318 while the one at the other locations
is 82, meaning that the proposed model can predict
the match winners with high accuracy. Furthermore,
the performance of the model using both interaction
and statistical features is higher than other models us-
ing a single feature set (i.e., either interaction or statis-
tical), implying that interaction and statistical features
are complementary to each other.
3.2 Feature Importance
We further investigate what features play significant
roles in predicting match winners by observing the
top 20 features in terms of the importance scores for
prediction calculated by the average gain across all
splits the feature is used in, as shown in Figure 7.
In general, the statistical features like the number of
shots, the number of total passes, and average diago-
nal pass rates or total passes are located at higher po-
sition, showing that statistical features are important
indicators in predicting match winners. Interestingly,
the standard deviations of closeness centrality, out-
degrees, degree centrality, and in-degrees are listed
in the top 20 features, which implies that whether all
the players in a match pass to each other with a similar
degree can be important predictors for match winners.
In other words, the passing interaction behavior in a
match is important for predicting match winners.
4 CONCLUDING DISCUSSION
In this paper, we proposed a machine learning model
that predicts the football match winners based on
the statistical and interaction features. We collected
the match results with their associated information
for 2,682 matches of Chinese Super League and A
League (2014-2020). By conducting an ablation
study, we revealed that the extracted interaction fea-
tures are complementary to statistical features.
There are a few limitations in our work. First, we
conducted experiments only on the football matches
in Chinese League, thus generalizing the methods and
the results in this paper to other leagues such as En-
icSPORTS 2021 - 9th International Conference on Sport Sciences Research and Technology Support
58

glish Premier League (EPL), Bundesliga, or LaLiga
should be cautiously considered. As a future work, we
plan to evaluate our proposed model to these leagues.
Second, we only considered eleven players in the
starting lineup, which has the rooms for improvement.
Despite the limitations, we believe our experimental
design and results can provide important insights for
both football industry and academic researchers who
want to lighten important characteristics of winning
teams.
ACKNOWLEDGEMENTS
This research was supported by the framework
of international cooperation program managed by
the National Research Foundation of Korea (NRF-
2020K2A9A2A11103842), and the MSIT(Ministry
of Science and ICT), Korea, under the ICT Creative
Consilience program (IITP-2021-2020-0-01821) su-
pervised by the IITP (Institute for Information &
communications Technology Planning & Evaluation).
REFERENCES
Bastida Castillo, A., G
´
omez Carmona, C. D., De la
Cruz S
´
anchez, E., and Pino Ortega, J. (2018). Ac-
curacy, intra-and inter-unit reliability, and comparison
between gps and uwb-based position-tracking systems
used for time–motion analyses in soccer. European
journal of sport science, 18(4):450–457.
Bavelas, A. (1950). Communication patterns in task-
oriented groups. The journal of the acoustical society
of America, 22(6):725–730.
Breiman, L. (2001). Random forests. Machine learning,
45(1):5–32.
Chen, T. and Guestrin, C. (2016). Xgboost: A scalable
tree boosting system. In Proceedings of the 22nd acm
sigkdd international conference on knowledge discov-
ery and data mining, pages 785–794.
Clemente, F. M., Martins, F. M. L., Kalamaras, D., Wong,
P. D., and Mendes, R. S. (2015). General network
analysis of national soccer teams in fifa world cup
2014. International Journal of Performance Analysis
in Sport, 15(1):80–96.
Freeman, L. C. (1977). A set of measures of centrality based
on betweenness. Sociometry, pages 35–41.
Georgievski, B., Labadze, L., and Aboelsoud, M. E. (2019).
Comparative advantage as a success factor in football
clubs: Evidence from the english premier league (epl).
Journal of Human Sport and Exercise.
Gunn, S. R. et al. (1998). Support vector machines for
classification and regression. ISIS technical report,
14(1):5–16.
Harrop, K. and Nevill, A. (2014). Performance indicators
that predict success in an english professional league
one soccer team. International Journal of Perfor-
mance Analysis in Sport, 14(3):907–920.
Hassan, A., Akl, A.-R., Hassan, I., and Sunderland, C.
(2020). Predicting wins, losses and attributes’ sen-
sitivities in the soccer world cup 2018 using neural
network analysis. Sensors, 20(11):3213.
Johansen, H. D., Pettersen, S. A., Halvorsen, P., and Jo-
hansen, D. (2013). Combining video and player
telemetry for evidence-based decisions in soccer. In
icSPORTS, pages 197–205.
Linke, D., Link, D., and Lames, M. (2020). Football-
specific validity of tracab’s optical video tracking sys-
tems. PloS one, 15(3):e0230179.
Pettersson, D. and Nyquist, R. (2017). Football match pre-
diction using deep learning. Psychology of Sport and
Exercise, 15(5):538–547.
Pons, E., Garc
´
ıa-Calvo, T., Resta, R., Blanco, H., L
´
opez del
Campo, R., D
´
ıaz Garc
´
ıa, J., and Pulido, J. J. (2019). A
comparison of a gps device and a multi-camera video
technology during official soccer matches: Agreement
between systems. PloS one, 14(8):e0220729.
Razali, N., Mustapha, A., Yatim, F. A., and Ab Aziz,
R. (2017). Predicting football matches results using
bayesian networks for english premier league (epl).
In Iop conference series: Materials science and en-
gineering, volume 226, page 012099. IOP Publishing.
Tang, X., Wang, J., Zhong, J., and Pan, Y. (2013). Pre-
dicting essential proteins based on weighted degree
centrality. IEEE/ACM Transactions on Computational
Biology and Bioinformatics, 11(2):407–418.
Passing to Win: Using Characteristics of Passing Information for Match Winner Prediction
59

APPENDIX
Table 3: A list of match features used for training the match winner prediction model.
index feature index feature
1 # of total penalty (Home) 57 Avg. of in-degree (Home)
2 # of total shots (Home) 58 Std. of in-degree (Home)
3 # of total shots on target (Home) 59 Avg. of out-degree (Home)
4 Possession rate (Home) 60 Std. of out-degree (Home)
5 # of total passes (Home) 61 Avg. of degree centrality (Home)
6 Pass success rate (Home) 62 Std. of degree centrality (Home)
7 Dominance rate (Home) 63 Avg. of closeness centrality (Home)
8 # of total free kick (Home) 64 Std. of closeness centrality (Home)
9 # of total frontcourt free kick (Home) 65 Avg. of betweenness centrality (Home)
10 # of total corner kick (Home) 66 Std. of betweenness centrality (Home)
11 # of total penalty (Away) 67 Avg. of # of catches (Away)
12 # of total shots (Away) 68 Avg. of # of key pass (Away)
13 # of total shots on target (Away) 69 Avg. of # of cross pass (Away)
14 Possession rate (Away) 70 Avg. of # of break through (Away)
15 # of total passes (Away) 71 Avg. of # of be fouled (Away)
16 Pass success rate (Away) 72 Avg. of # of offside (Away)
17 Dominance rate (Away) 73 Avg. of # of steal (Away)
18 # of total free kick (Away) 74 Avg. of # of intercept (Away)
19 # of total frontcourt free kick (Away) 75 Avg. of # of clearance kick (Away)
20 # of total corner kick (Away) 76 Avg. of # of block pass (Away)
21 Avg. of # of catches (Home) 77 Avg. of # of block shot (Away)
22 Avg. of # of key pass (Home) 78 Avg. of # of yellow card (Away)
23 Avg. of # of cross pass (Home) 79 Avg. of # of red card (Away)
24 Avg. of # of break through (Home) 80 Avg. of # of short pass (Away)
25 Avg. of # of be fouled (Home) 81 Avg. of # of long pass (Away)
26 Avg. of # of offside (Home) 82 Std. of # of catches (Away)
27 Avg. of # of steal (Home) 83 Std. of # of key pass (Away)
28 Avg. of # of intercept (Home) 84 Std. of # of cross pass (Away)
29 Avg. of # of clearance kick (Home) 85 Std. of # of break through (Away)
30 Avg. of # of block pass (Home) 86 Std. of # of be fouled (Away)
31 Avg. of # of block shot (Home) 87 Std. of # of offside (Away)
32 Avg. of # of yellow (Home) 88 Std. of # of steal (Away)
33 Avg. of # of red (Home) 89 Std. of # of intercept (Away)
34 Avg. of # of short pass (Home) 90 Std. of # of clearance kick (Away)
35 Avg. of # of long pass (Home) 91 Std. of # of block pass (Away)
36 Std. of # of catches (Home) 92 Std. of # of block shot (Away)
37 Std. of # of key pass (Home) 93 Std. of # of yellow (Away)
38 Std. of # of cross pass (Home) 94 Std. of # of red (Away)
39 Std. of # of break through (Home) 95 Std. of # of short pass (Away)
40 Std. of # of be fouled (Home) 96 Std. of # of long pass (Away)
41 Std. of # of offside (Home) 97 Avg. of short pass rate (Away)
42 Std. of # of steal (Home) 98 Avg. of long pass rate (Away)
43 Std. of # of intercept (Home) 99 Avg. of direct pass rate (Away)
44 Std. of # of clearance kick (Home) 100 Avg. of cross pass rate (Away)
45 Std. of # of block pass (Home) 101 Avg. of diagonal pass rate (Away)
46 Std. of # of block shot (Home) 102 Avg. of back pass rate (Away)
47 Std. of # of yellow (Home) 103 Avg. of in-degree (Away)
48 Std. of # of red (Home) 104 Std. of in-degree (Away)
49 Std. of # of short pass (Home) 105 Avg. of out-degree (Away)
50 Std. of # of long pass (Home) 106 Std. of out-degree (Away)
51 Avg. of short pass rate (Home) 107 Avg. of degree centrality (Away)
52 Avg. of long pass rate (Home) 108 Std. of degree centrality (Away)
53 Avg. of direct pass rate (Home) 109 Avg. of closeness centrality (Away)
54 Avg. of cross pass rate (Home) 110 Std. of closeness centrality (Away)
55 Avg. of diagonal pass rate (Home) 111 Avg. of betweenness centrality (Away)
56 Avg. of back pass rate (Home) 112 Std. of betweenness centrality (Away)
icSPORTS 2021 - 9th International Conference on Sport Sciences Research and Technology Support
60
