
Data-driven Support of Coaches in Professional Cycling using Race
Performance Prediction
∗
Aleksei Karetnikov
1 a
, Wim Nuijten
2,3
and Marwan Hassani
2 b
1
Software Competence Center Hagenberg GmbH (SCCH), Hagenberg, Austria
2
Process Analytics Group, TU Eindhoven, Eindhoven, The Netherlands
3
Jheronimus Academy of Data Science, ’s-Hertogenbosch, The Netherlands
Keywords:
Sports Analytics, Cyclist Performance, Data-driven Performance Prediction, Maximum Mean Power.
Abstract:
In individual sports, the judgment of which training activity will lead to the best performance is mostly based
on the expert knowledge of the coach. Recent advances in data collection and data science have opened up
new possibilities for performing a data-driven analysis to support the coach in improving the training programs
of the athletes. In this paper, we investigate several methods to do such analysis for professional cyclists.
We provide the coach with a framework to predict the Maximum Mean Powers (MMPs) of a cyclist in an
upcoming race based on the recently performed training sessions. This way the coach can experiment with
several planned alternatives to figure out the best way for preparing the athlete for a race. We conduct multiple
prediction models through an extensive analysis of a real dataset collected recently about the performance of
professional riders with varying physiologies and temporal performance peaks. We show that the application
of the hybrid model using XGBoost and CatBoost has clear advantages. Additionally, we show that the
accuracy of our general model can be further increased by filtering according to the mountain stages. We
have additionally validated the proposed framework using an openly available real dataset and the results
were consistent with those of the collected data. We offer an open source implementation of our proposed
framework.
1 INTRODUCTION
The prediction of the competitive performance of an
athlete based on the performed training sessions of
that athlete is at the heart of preparing athletes to
perform well in competitions (Jobson et al., 2009).
At present day, the judgement of what training activ-
ity will lead to the best sports performance is mostly
based on the expert knowledge of the coach of the ath-
lete. Recent developments in data collection and data
science have opened up the possibilities for doing a
data-driven analysis to support the coach in improv-
ing the training programs for optimizing the perfor-
mance of the athlete (Castronovo et al., 2013). In this
paper we investigate ways to do such analysis for pro-
a
https://orcid.org/0000-0002-2672-8548
b
https://orcid.org/0000-0002-4027-4351
∗
Most of the core project activities were done at TU
Eindhoven.
The research reported in this paper has been partly
funded by BMK, BMDW, and the State of Upper Austria
in the frame of the COMET Programme managed by FFG.
fessional cyclists, where we aim to provide the coach
with a method to predict the performance of the ath-
lete in an upcoming race based on recently performed
training sessions and planned training sessions in the
near future (Figure 1).
Currently, there are a few studies which are show-
ing surprisingly high accuracy (up to 95%) of the
instant parameter prediction (Hilmkil et al., 2018;
Kataoka and Gray, 2019). In a different study, an
analysis of the training sessions was performed in
400-metres hurdles races (Przednowek et al., 2014),
but its application in cycling should be examined.
Thus, to the best of our knowledge, there is no com-
plete framework that could be applied for the predic-
tion of an athlete’s performance for a long-term time
in cycling.
In this paper, we are using aggregated training ses-
sions and race data for building a prediction model
that could be used for a comparative analysis of dif-
ferent training sessions options. We found that the
application of the general hybrid model that is based
on XGBoost (Chen and Guestrin, 2016) and CatBoost
Karetnikov, A., Nuijten, W. and Hassani, M.
Data-driven Support of Coaches in Professional Cycling using Race Performance Prediction.
DOI: 10.5220/0010656300003059
In Proceedings of the 9th International Conference on Sport Sciences Research and Technology Support (icSPORTS 2021), pages 43-53
ISBN: 978-989-758-539-5; ISSN: 2184-3201
Copyright
c
2021 by SCITEPRESS – Science and Technology Publications, Lda. All r ights reserved
43

(Yandex, 2019) has undoubtedly advantages when
compared to the individual model. We found addi-
tionally that filtering the mountain stages gives an
additional growth of the prediction quality whereas
omitting of the time-trials is not positively affecting
the accuracy. By filtering the mountain stages, we
have reached an RMAE (Relative mean absolute er-
ror (Gepsoft, 2019)) of less than 4% in 88% of the
cases, the rest 12% can be predicted with an RMAE
of less than 6%.
The remainder of this paper is organized as fol-
lows. Section 2 proposes an overview of previous
studies in data analysis in sport and the related areas
with similar background and their shortcomings from
our perspective in the particular case. Section 3 de-
scribes the problem, general knowledge about perfor-
mance in cycling and an idea that combines the best
approaches of the previous studies and proposes new
opportunities for better prediction quality. Then, in
Section 4 an extensive evaluation of various predic-
tion techniques is described. These results were also
validated by application of the same approach on the
open cyclicng data 5. Finally, Section 6 presents a
conclusion and a discussion.
Figure 1: A visual representation of the application sce-
nario.
2 PREVIOUS STUDIES ON
PERFORMANCE PREDICTION
Currently, several studies targeting the performance
analysis using different prediction methods in sports
competitions exist. In (Rastegari, 2013) an overview
of different prediction methods in sport is given. In
general, it was found that some disciplines are bet-
ter predicted by the regression models whereas other
could be better described by neural networks and tree
models. For instance, the Lasso regression model has
the best performance in hurdles races (Przednowek
et al., 2014) whereas swimming (Maszczyk et al.,
2012) is better predicted by a neural network. Then,
in (Przednowek and Wiktorowicz, 2013) the authors
demonstrate that Linear models seem to be relatively
better for walking activities. Furthermore, in several
cases, the prediction quality can be improved by in-
cluding additional contextual parameters like air tem-
perature, meteo-conditions, additional metrics (Has-
sani and Seidl, 2011). In (Kataoka and Gray, 2019)
the authors are focused on the prediction of current
power measurements. Some of the parameters were
retrieved from public GPS data. This approach de-
pends on the real-time data availability and the guar-
anteed access to this data. Additionally, its accuracy is
relatively low (the lowest MAE is 60.13 Watts for re-
gression model and 63.97 Watts for XGBoost which
was chosen as the “best” model). The article does
not have any explanation about this value but accord-
ing to evaluation on the available dataset, it is be-
tween 12% and 20% of the average power. This re-
sult was tested only on one race. Additionally, in (Le-
ung and W. Joseph, 2014; Przednowek et al., 2014)
the authors demonstrate results of non-linear models
(indeed a decision tree) which have shown the best
performance among the classical models, but some of
the used variables are not applicable in cycling be-
cause they are applicable only for animals or using
well identified different types of exercises (walking or
running). Moreover, this paper is describing predic-
tion of repetitive fixed-length sprints, where cycling
distances are always different. Finally, the authors
of (Leung and W. Joseph, 2014) introduce a signifi-
cantly more precise model which was developed for
their special case. The prediction of the statistical re-
sults is a common problem for almost all the inter-
ested stakeholders. The professional cycling teams
are also interested in special performance measure-
ments such as heart rate, power, speed and other pa-
rameters that could be tracked by various sensors of
bike computers. These parameters can be predicted
with reasonable precision. For example, in (Hilmkil
et al., 2018) an LSTM model was used to predict the
heart-rate of another professional cycling team. The
results are given only in absolute units but its rough
estimation tells that prediction quality is about 90%.
Moreover, in (Cecchini et al., 2014) a Feed Forward
Neural Network was used to predict the muscle force
of a rider. The authors have reached an RMSE less
than 1%.
As such, all the available studies are showing ac-
ceptable prediction quality in the particular questions
and sport disciplines, but there is no available study
aiming at a more complex analysis of cycling compe-
titions as a whole. Probably, prediction models from
other sport disciplines could be re-used, but it was
not tested yet either. Furthermore, there are only a
few studies that were working particularly with pro-
fessional cycling. Recently, the vast majority of such
studies are oriented on the analysis of LLTH (Live
icSPORTS 2021 - 9th International Conference on Sport Sciences Research and Technology Support
44

Low Train High) approach and the comparison with
LHTL (Live High Train Low) (Burtscher et al., 2006;
Hamlin, 2013; Fulco et al., 2000; Garvican-Lewis
et al., 2015). It requires careful analysis of the avail-
able prediction techniques which could be used for
this kind of “what-if” analysis, the identification of
the main predictors and the verification of the model
on the real dataset.
We propose a general framework that can use dif-
ferent kind of prediction models (Yandex, 2019; Chen
and Guestrin, 2016) and we are able to test differ-
ent combinations of those and achieve an accuracy of
more than 90% by RMAE. Additionally, all the pos-
sible deviations in the input data and the prediction
model are detected because it was validated not only
by the theoretical knowledge, but also by the practical
experience of the professional team.
3 OVERVIEW OF THE
PROPOSED FRAMEWORK
3.1 Preliminaries
This paper is focused on the prediction of race perfor-
mance based on the measurements from the training
sessions. Some of the race parameters are known in
advance (like length and elevation) and could be used
in the final model. In general, this model is based on
historical data from previous combinations of races
and training sessions. Additionally, our research if
focused on use of the high altitude training (LLTH
approach). The main idea of this training method is
the reduced air density with altitude that has a posi-
tive influence on the air-resistance of the rider, but it
significantly reduces efficiency of the aerobic energy
system. This effect is useful not only as a real devel-
opment of muscles but also as a placebo (Burtscher
et al., 2006). We are using the Maximum Mean Pow-
ers (MMPs) as the performance metric. This way the
coach can test several planned alternatives to figure
out the best way to prepare the athlete for a compe-
tition. According to the requirements of the profes-
sional team, we are mostly focusing on the mountain
stages of the multi-days races of the Grand Tour. The
duration of the cycling season is almost 1 year and as
such it includes different periods of the performance
levels for each cyclist (Cintia et al., 2013). We focus
on predicting peak performances in crucial stages as
scheduled in one of the Grand tours. These are the
main seasonal targets of overall standings riders.
The most important variables that describe race
performance in this particular case are the measure-
Figure 2: A visual representation of TOP 3 MMP selection.
We calculate the moving average during the given time pe-
riod with temporal padding between the MMPs to avoid an
overlap. The highest MMP1 is shown in the middle. The
two other values MMP2 and MMP3 should have a mini-
mum distance between each other.
ments of Mean Maximal Power (MMP) of the athletes
for various time periods (5, 6, 15, 30 and 45 minutes).
These variables are the highest average power during
the given period according to (Xert, 2019). In other
words, it is a maximal moving average of the data
sample. Additionally, the N-largest MMP could be
also calculated. In that case, all the MMPs should be
carefully checked, so that they do not have any over-
lapping power measurements. This principle is repre-
sented in Figure 2. Where there are 3 equal intervals
that have a predefined minimal interval between each
other. The color intensity of this image shows the or-
der of the measurements sorted by its value. The chart
on the background is shown for better visual percep-
tion and it does not represent any real data. In this
paper, we are mostly focused on the prediction of the
first MMP, but the predictors are also based on the
first and the second MMP values from the training
sessions.
Since one of our focuses is the mountain stages,
we assume that the riders have competitive advan-
tages on these stages and thus, the maximum per-
formance. According to the domain expert, the flat
stages are mostly depending on the race situation
that is not predictable because of the unknown rivals’
strategy. Moreover, it can be influenced by the tacti-
cal decision of the coach. Thus, we need to predict the
mean possible values of the MMPs for these stages.
Another assumption of our research is that each
training camp day has its own effect (estimated by
its weight which is calculated as a linear distance be-
tween the connected days) on each of the race days
(see Figure 3). To make these weights more applica-
ble, they could be normalized. As a result, each of M
race days is predicted using N training camp days and
Data-driven Support of Coaches in Professional Cycling using Race Performance Prediction
45

according to the assumption, the closest days have the
highest effect on the result. Note that the sum of these
weights (normalized delays between the training ses-
sions and the race days) is equal to 1. It is impor-
tant that one training session can be related to multi-
ple races but each race has only one related training
session. In some special cases, the whole race could
be considered as a training session if it was a high
altitude race (Figure 3).
3.2 Model Description
The proposed model is based on performance data
from 3 pro-riders for all the years of their profes-
sional activity in the team. They were collected by
various sensors on bikes and then combined by a cy-
cling computer. In this setting Garmin hardware was
used. The input dataset includes 32 raw (from the
sensors) variables and 108 contextual and aggregated
attributes. Then, those were reduced to 48 variables
(Table 1). A more detailed explanation of the process
will be given in the next section. Our feature selec-
tion strategy was applied in a continuous consultation
with the domain experts, thus some of the training at-
tributes were manually ignored due to the conceptual
importance of race parameters for the planning of the
training sessions. The the model was trained again
and tested by different training camp settings. If the
model was not responsive to change of these parame-
ters, the selection of the predictors was repeated. Fi-
nally, we have identified a subset of 48 variables that
provides both reasonable prediction quality and the
required functionality.
Out research focuses on use of the aggregated race
data obtained from the cycling computers and its sen-
sors.
The overall pipeline of the developed framework
is shown in Figure 4. It includes extraction and pre-
processing of the raw data from the sensors. The lat-
ter stage performs aggregations of the cycling ses-
sions and a combination of the training-race pairs
that are used by the Machine Learning model. The
aggregation principle is shown in Figure 3. The
model uses 48 attributes that are automatically re-
trieved from the dataset to predict 5 depended vari-
ables: mmp5m (Mean Maximal Power over 5 min-
utes), mmp6m, mmp15m, mmp30m and mmp45m.
The selection of these depended variables was based
on the necessities of the professional team. The ex-
amined dataset is taken from one of the Grand Tour
events. Additional contextual data (year as a pro-
fessional, weight and other) are also available. We
are unable to reveal those or further details about the
dataset as we have signed a non-disclosure agreement
with the owner company. After a series of tests, a
race profile hypothesis was proposed. In detail, it was
suggested that different race types have a significant
effect on the scale of power measurements. Quick
time trials and races in mountains require higher en-
ergy consumption and, as a result, higher power out-
put. The races were divided into 4 groups: all the
races, only mountain stages, only time-trials and only
time-trials in mountains. The mountain stages were
defined as the races which have max altitude higher
than 1500 m and the time-trials were filtered by the
race name. Additionally, since these measurements
are available only for limited time periods, the whole
dataset is relatively small for such a prediction. Thus,
the second hypothesis states that the lack of data could
be compensated by an assumption of almost identical
parameters of professional riders. A similar assump-
tion was proven useful in swimming (Maszczyk et al.,
2012). To prove this idea in cycling, the model was
separately tested on the data from only one (individual
sample) and all the available (general sample) riders.
As a result, 8 different models were examined.
Moreover, the accuracy could be increased by fil-
tering the input dataset wrt the rider and/or the race
profile. Thus, in this work we are testing an individ-
ual model and additionally a general one. The general
model is trained on data from all the comparably sim-
ilar riders. Additionally, special models were tested
with the data filtered by mountains stages and time-
trials in various combinations.
It is clear that prediction of the power measure-
ments is principally a non-trivial task because it de-
pends not only on the previous performance of the
rider but also on all of his/her competitors because
of psychological factors. Since all the performance
measurements are always confidential for the teams,
it is impossible to retrieve their data. An indirect
data collection from open sources and various image-
capturing algorithms which use online translation of
the event would of course be possible.
3.3 Prediction Models
This paper estimates the most performative models
from previous studies: Linear Regression + model
with interactions, Lasso Regression (Przednowek
et al., 2014), LSTM (Hilmkil et al., 2018), Deci-
sion Tree (Rastegari, 2013), Random Forest Regres-
sion (Kataoka and Gray, 2019), XGBoost (Przed-
nowek et al., 2014). These models were examined
to find the best performing settings. So, the Linear,
non-linear and Lasso regressions were tested in En-
try, Stepwise and Forward modes (selection of the in-
dependent variables) (Efroymson, 1960). The vari-
icSPORTS 2021 - 9th International Conference on Sport Sciences Research and Technology Support
46
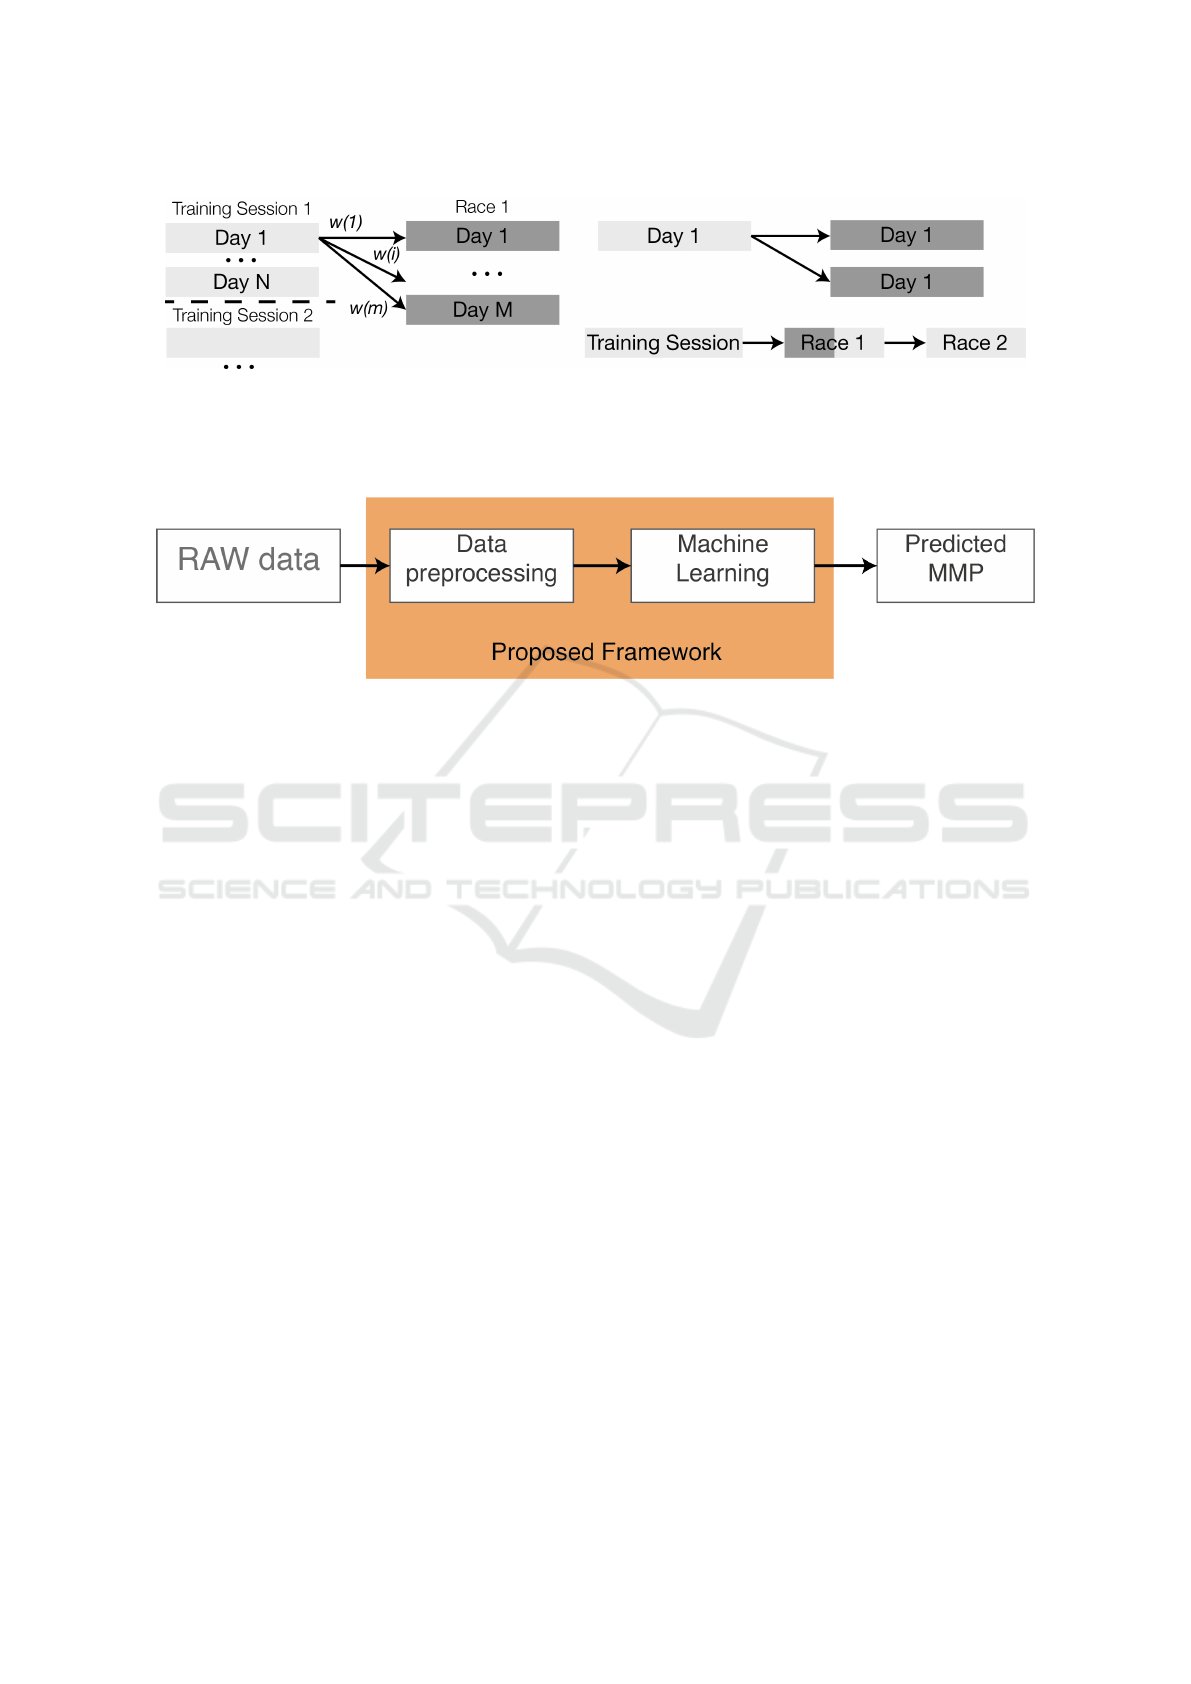
Figure 3: Visual representation of the training-race combinations (left) and possible sequences of training sessions and races
(right). Each day of the training session has a contribution to each day of the race. At the same time, if there is more than one
race after the training session in a predefined period, that race could be considered as a training session. In the figure, each of
the days 1 to N has an influence on each of the M race days with a particular weight. If there is more than one race the training
session influences on more race days and the races in the middle could be considered as an additional training session.
Figure 4: Pipeline of the proposed framework.
ables were estimated by SPSS (IBM, 2019) and then
fed manually to the model as Scikit-learn (Pedregosa
et al., 2011) does not support these models. Further-
more, semi-log and log models (Kenneth, 2011) were
examined. In the case of an LSTM model, various ar-
chitectures of layers and neurons were tested. Since
it is a time-consuming procedure, these settings were
taken from previous studies (Eckhardt, 2018; Hilmkil
et al., 2018; Przednowek et al., 2014) and then 2
times smaller and 2 times larger number of layers
were also checked. The initial seed for the weights
was randomized according to (Brownlee, 2017). The
tree models were also evaluated. In the majority of
previous studies (Przednowek et al., 2014; Kataoka
and Gray, 2019) the settings of these models were
not clearly presented. Probably, only default param-
eters were checked. To avoid any possible bias, we
checked them with different seeds and depth settings.
Finally, according to the preliminary data overview
and knowledge, the races were additionally classified
by 2 categories: time trial and mountain stages (max-
imal elevation is higher than 1500 m). All the models
were tested with normalized datasets except for the
gradient boosting that does not require that. This step
is important because these special races have princi-
pally different strategies of the riders and the scale of
the obtained measurements could be significantly dif-
ferent. For instance, a higher energy consumption is
expected during the mountain stages. To avoid prob-
lems with the interpretation of the results, this paper
reports the Relative MAE (RMAE) which could be
easily estimated (Gepsoft, 2019).
4 EXPERIMENTAL EVALUATION
The full source code of the framework with a link to
the open-source dataset is available in (Karetnikov,
2021).
4.1 Experimental Settings
The previously described models were trained on the
specially divided dataset of the multiday races. This
dataset includes 41 races and 23 training sessions
from 3 professional riders. These training and race
sessions are combined is such a way that every race is
always connected to a training session. The mapping
is performed according to the temporal dimension of
the data considering a fact that effect of a training
can be vanished after a particular time. In this study
we use a threshold of 30 days. We predict data only
for the TOP-2 riders and use data from an additional
athlete with comparably equal performance to enrich
the input dataset. We perform these experiments with
2 main models: general (training on the common
dataset) and individual (training only on the personal
dataset). Then, we are using one of the latest multi-
day races of the Grand Tour where both riders were
participating to perform an optimization of the models
Data-driven Support of Coaches in Professional Cycling using Race Performance Prediction
47
Table 1: Input attributes of the model.
Attribute (Group) Description
Distance on High Altitude Total Distance on the altitude higher than 1500 m (race)
Altitude Max altitude, total elevation (race)
Time-Trial flag True of False
Delay
(training session-race) Normalized delay (0;1]
Distance Total distance
Speed Average speed during the training session
Power Total work, mean power, 1st, 2nd MMP 5, 6, 10, 12, 15, 20, 30, 40, 45 min
Special effort special effort (AVG Power > FTP, t >= 20 min), tempo effort
(AVG Power > 90%*FTP, t >= 8 min), bursts (AVG Power > FTP, t > 4 s)
Altitude Avg, Max altitude, Total elevation
Time, s Total time, time on the altitude higher than 1500 m
Grade slope grade during the MMPs
hyperparameters. When we have identified the most
performative models, they were also cross-validated
according to the k-folds algorithm. The folds were
split according to the race id as it is shown in Figure
5. It leads to different sizes of the train and test sub-
sets but it helps to produce a more robust evaluation.
For the cross-validation of the models, we filter only
the races that are longer than 4 days.
Figure 5: The dataset train-test splitting method. The
framework uses a modified k-folds split algorithm that splits
the dataset according to the race id rather than the fixed size
of the subsets.
4.2 Results
Regarding the model’s performance, some practically
useful results were discovered. Figures 6 and 7 show
an average RMAE (Gepsoft, 2019) of the predicted
results for the 2 examined riders. It is based on one
of the Grand Tour races where all the riders were
present. Additionally, these results are shown for
the already tuned models. First, the examination of
the models on the full general and individual dataset
has shown that normally an average RMAE of all the
prediction techniques is 1-2% higher for the individ-
ual model (Figure 6). In general, the min RMAE of
the main model is 10.74%. Then, one can find that
the mountain model is comparatively more performa-
tive (it can have a mean RMAE of 3.42% and a min
RMAE of a single race day smaller of 0.03%) than
the main one (Figure 7). The hypothesis that the time-
trials have different prediction opportunities was not
confirmed. The prediction quality is even less than
the of the first model (Figure 8). It can be explained
by an extremely small subset of time-trials (normally,
no more than 10% of the race). So, we should be fo-
cused only on the two general models (Figure 6 and
7). In details, the best performing model in the both
cases is the stepwise regression. Normally, its RMAE
is 1-2% lower than that of the other models. Some-
times, the LASSO model helps to improve this error
by mere 0.1%. Then, the Random Forest Regression
and the CatBoost models have almost the similar per-
formance. The next roughly similar group of the mod-
els consists of the XGBoost model and the Decision
Tree. The latter technique is more accurate in most of
the situations. The full multiple-linear regression is
significantly less accurate than the previous methods.
Finally, the LSTM model cannot be considered as a
possible prediction method due to its enormous error
that is higher than 20% despite varying the number of
layers and neurons as discussed in Section 3.2.
The examination of the linear regression models
has shown that a stepwise model (Efroymson, 1960)
performs insignificantly better than the full one. Ac-
cording to the mean R
2
of all the predicted variables,
43.1% of the MMP values could be explained by the
full set of predictors. The stepwise model, which is
based on 9 out of the 140 variables, increases this
metrics by an insignificant 0.28% but, in practice, this
was confirmed for all the models except the individ-
ual ones (Figures 6 - 8). The linear regression models
show completely similar performance, as can be seen
in Figure 8, but they have a very limited practical ap-
plication due to the observed overfitting of the model
and the incorrect selection of the prediction features
by the Stepwise algorithm. That does not help to an-
swer the question about settings of the training ses-
sions. The same conclusion can be drawn for the
icSPORTS 2021 - 9th International Conference on Sport Sciences Research and Technology Support
48
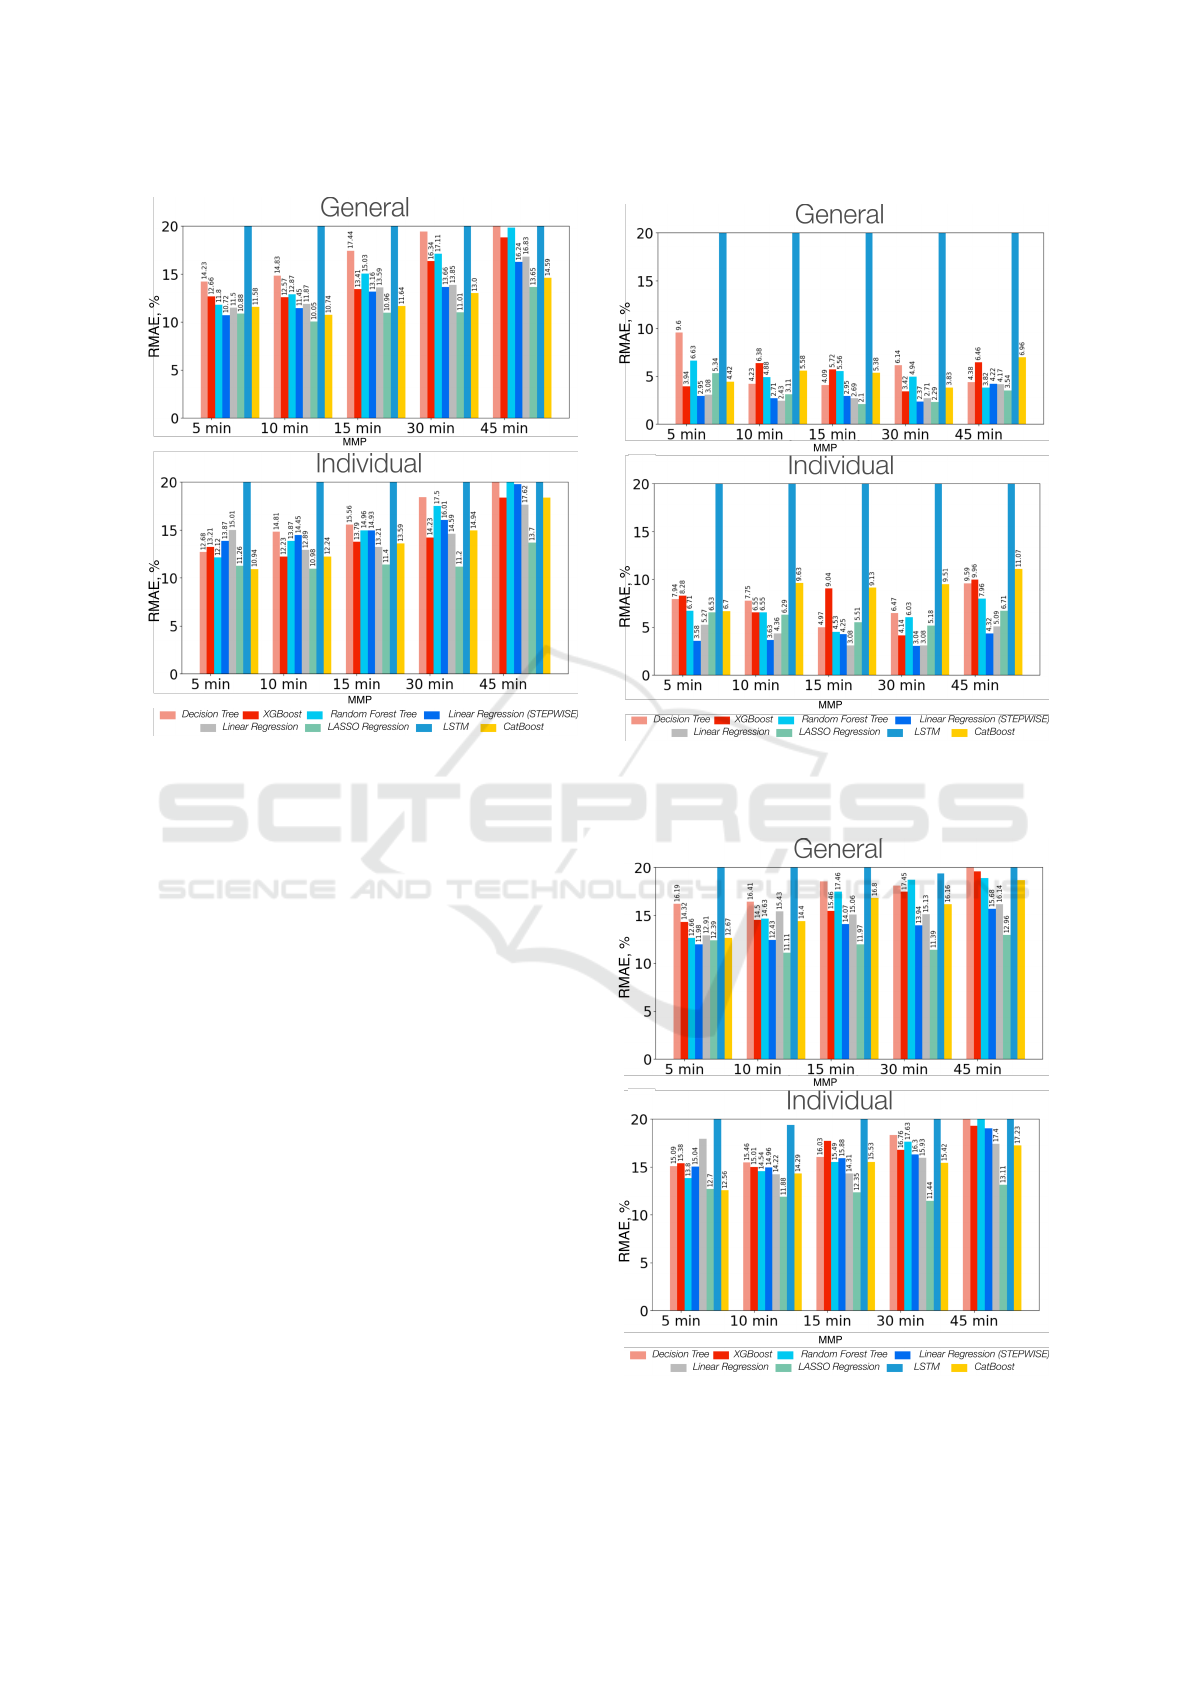
Figure 6: A comparison of prediction methods for the gen-
eral and the individual model with 2 riders by average
RMAE. Y-axis represents RMAE (lower is better), X-axis
represents different MMPs. The models are encoded by the
color of the bars and given in the same order as in the leg-
end.
Lasso regression.
The same observation was obtained after various
tests on trees’ depth. We found that the best models
are: the Decision Tree, Random Forest Tree (RFR),
XGBoost, and CatBoost. Accordingly, the following
experiments are related only to these models. To con-
firm the repeatability of the prediction and lack of de-
pendency on a random factor, a series of the differ-
ent seed tests with the RFR, XGBoost, and CatBoost
were performed. These results demonstrated an ex-
tremely small variation of the mean RMAE that con-
firms the repeatability of the experiment. The results
of the RFR model are shown in Table 3. All the val-
ues are given in % and one can find that the highest
deviation is equal to 0.07%. The other model did not
show a variation higher than 0.02%.
Then, it is clear that an LSTM model cannot be
used in this situation because it has shown signifi-
cantly higher RMAE than all other methods. At the
same time, the findings about the best performative
prediction technique from (Kataoka and Gray, 2019)
and (Przednowek et al., 2014) were confirmed. It
was realised that the most accurate prediction mod-
els is XGBoost, CatBoost and Random Forest Tree
Figure 7: Comparison of prediction methods for the gen-
eral and the individual model with (mountain stages) with 2
riders by average RMAE.
Figure 8: Comparison of prediction methods for the general
and the individual model (without time-trials) with 2 riders
by average RMAE.
Data-driven Support of Coaches in Professional Cycling using Race Performance Prediction
49

(the more detailed analysis has shown that accuracy
can dramatically drop in the case of Rider 2). Since
the CatBoost model is generally more accurate than
XGBoost (Pallapothu, 2019), we are focusing on
this model. One of the findings is that the exten-
sion of the first dataset with only two riders by an-
other athlete has significantly improved the predic-
tion quality of the CatBoost model. Previously, the
XGBoost method was over-performing this relatively
new model. In some cases, the Random Forest Tree
model is slightly more accurate (for instance, the pre-
diction of the MMPs for more than 30 minutes) but
this fact should be considered as an outlier because
it happened only for one rider. Moreover, this differ-
ence is less than 1%.
Since the two models (XGBoost and CatBoost)
have relatively similar accuracy, they were addition-
ally cross-validated by all the multi-days races (the
races that have more than 4 days). The dataset of
this experiment includes 23 races. From Table 2, that
represents the experiment’s results, we can conclude
that the mountain stages can be better predicted by an
XGBoost model (0.23% more performative than Cat-
Boost) whereas prediction of all the other stages can
be done better by a CatBoost model (1.82% more per-
formative than XGBoost).
4.3 Discussion of the Results
To conclude this section, the main hypothesis about
the application of the general model was success-
fully confirmed. Another hypothesis about applica-
tion of the special models for the special races was
only partly confirmed. The separation of the moun-
tain stages has provided a significantly higher perfor-
mance of the model whereas a model that is aimed
only on the time-trials did not demonstrate any out-
standing performance. As such, the prediction of the
mountain stages can be done with an average RMAE
of less than 6.65%. All other stages can be pre-
dicted by the general model, which shows an error
of no higher than 13.13% (Table 2). The smallest
RMAE for a single race that was obtained during the
cross-validation experiment is 0.03% for the moun-
tain stages and 0.05% for all the other race stages.
5 EXPERIMENTING ON OPEN
SOURCE DATA
Since the original model is based on the dataset
owned by our leading industrial partner, the frame-
work was additionally validated with the use of the
open cycling data(Jr. et al., 2017) to encourage re-
searchers and practitioners to repeat our results. This
dataset includes data from 5 cyclists with a race his-
tory of more than 8 years. After data pre-processing,
we discovered that only 319 days from the whole
dataset could be used. This happened because the
dataset was filtered by the presence of the power mea-
surements and the minimum length of the cycling ses-
sion should be more than 30 minutes. Then, the raw
dataset was converted into a table to make the further
operations more interactive. Additionally, this bench-
mark was aimed to prove the performance of the gen-
eral model. So, it is possible that we could meet dupli-
cates of the days. In these cases, only the first met row
was kept. Since the data is well anonymized, it is im-
possible to map the available days with the real train-
ing and race sessions. To overcome this limitation, we
have decided to create training-race clusters consider-
ing a fact that the effect of the training is neglected in
more than 30 days. After these clusters were created,
only those with 4 or more days were used for further
consideration. This is important because only under
these constraints we could guarantee to have at least
3 training days before a single-day race. The thresh-
old of about 60% of the training days was identified
by the analysis of the collected professional dataset
and we decided to keep its settings. After that step,
it was possible to apply the training-race combination
algorithm that was described earlier to obtain the fi-
nal dataset for the evaluation that consists of 819 rows
and 26 race clusters. Then, we have performed a sub-
experiment to identify the size of the training subset
for the cross-validation step. We found that the most
optimal size is 10 race clusters out of 26 that is about
40% of the whole dataset. More detailed results are
shown in Figure 9.
Figure 9: Experimental setting of the most optimal train
subset size corresponding to the lowest RMAE average.
icSPORTS 2021 - 9th International Conference on Sport Sciences Research and Technology Support
50

Table 2: Cross-validation of the models of 23 races each of multiple days.
Model Dataset MMP5 MMP10 MMP15 MMP30 MMP45 MEAN
XGBoost
Flat 13.54 13.79 13.56 14.19 13.79 13.77
Mountains 6.62 6.49 5.98 6.64 6.5 6.65
CatBoost
Flat 12.7 13.28 13.02 13.15 13.52 13.13
Mountains 6.68 6.62 5.8 6.59 8.28 6.79
Table 3: RMAE means and its variation for different random seeds (from 0 to 1000 with a step of 1) of the RFR model in %.
Parameter MMP5m MMP15m MMP30m MMP45m MMP5m MMP15m MMP30m MMP45m
Rider 1 Rider 2
General model
Mean 17.07 17.02 22.74 25.75 2.82 8.8 8.99 11.96
Variance 0.11 0.06 0.06 0.06 0.02 0.02 0.03 0.02
General model with only mountain stages
Mean 3.27 2.79 5.6 3.11 3.78 2.94 2.18 3.3
Variance 0.02 0.02 0.04 0.02 0.03 0 0.01 0
Individual model
Mean 6.61 3.6 5.78 8.61 3.19 3.82 2.28 5.44
Variance 0.02 0.03 0.07 0.05 0.02 0.01 0 0.01
Individual model with only mountain stages
Mean 6.61 3.6 5.78 8.61 3.19 3.82 2.28 5.44
Variance 0.02 0.03 0.07 0.05 0.02 0.01 0 0.01
Consequently, a full cross-validation of the previ-
ously described model was performed. For the par-
ticular dataset, we performed 16 iterations. Finally,
the obtained results were compared to the previously
obtained ones. This comparison is shown in Fig-
ure 10. Overall, the highest difference was found
in the performance of the Decision Tree model that
demonstrates a worse performance of more than 7
percentage points growth of MAE. In the collected
professional dataset, we have already identified that
the most performative model in our framework was
CatBoost that has shown more reasonable behavior.
The aggregated average results are shown in Table 4.
Although the Linear Regression model was more per-
formative in some of the cases, we could identify its
overfitting behavior in the original experiment. Ad-
ditionally, the relative difference between CatBoost
and Random Forest Tree is not recognizable to reject
the previous decision about CatBoost that has shown
an average MAE difference of 1.81%. Despite the
fact that on average all the models have shown a rela-
tively lower performance, which could be explained
by limitations of the available dataset, all of them
have demonstrated an improved performance to pre-
dict MMP 45 minutes.
Finally, the main target of the benchmark was met.
It was possible to evaluate the framework with the use
of the open dataset with a mixed profile of the ath-
letes. Considering the mainly used CatBoost model,
an average MAE difference is acceptable to confirm
the robustness of the approach and repeatability of the
experiment. It means that the model does not have
a high prediction quality variation and it is not lim-
ited only by the original subset of the athletes with
the strong mountain races profile. On the contrary,
it is possible to significantly improve its performance
by use of the special settings that correspond to the
rider’s profile. The full source code of the framework
with a link to the open-source dataset is available in
(Karetnikov, 2021).
Table 4: Mean RMAE difference between the base model
based on the proprietary dataset and the model trained with
an open-source dataset in percentage points.
Model RMAE
Linear Regression 0.8
Random Forest Tree 1.74
CatBoost 1.81
LASSO Regression 2.79
XGBoost 4.21
Decision Tree 4.78
6 CONCLUSION AND OUTLOOK
The validity of the proposed framework that predicts
the performance (in this paper it is MMP) of a pro-
fessional rider with a general model was confirmed.
The general model, that was trained on the data from
several riders with comparably similar skills, is better
performative in prediction of a single rider’s perfor-
mance than the model that is based only on the data
of this individual rider. It can be explained by ex-
tending the training dataset. The same method was
Data-driven Support of Coaches in Professional Cycling using Race Performance Prediction
51
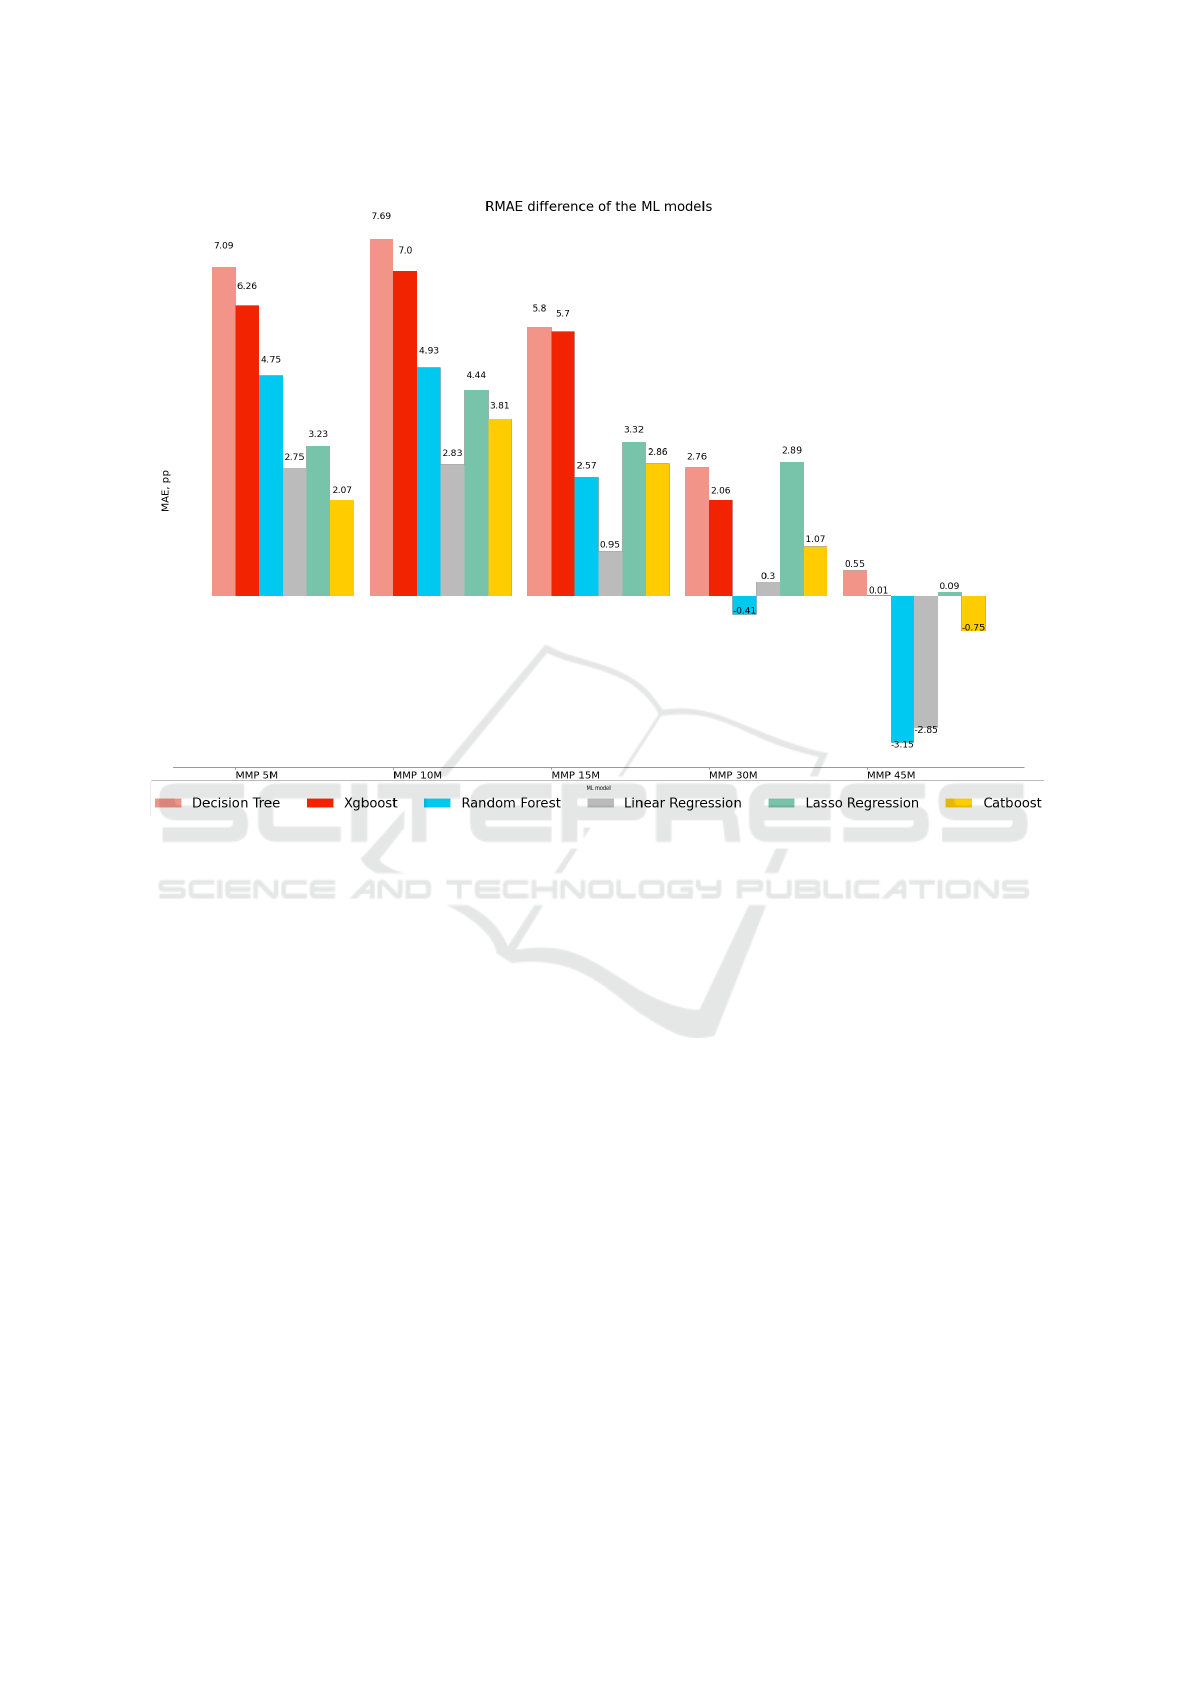
Figure 10: The performance difference between the original collected dataset and the open dataset in %. The y-axis represents
an absolute difference in percentage points in comparison with the model trained with a proprietary dataset. The x-axis shows
different predicted MMPs. The models are encoded by color in the same order as in the legend.
applied in (Maszczyk et al., 2012) and we have con-
firmed that it is also relevant in professional cycling.
This has been confirmed by the experiment that in-
cluded various tests on 8 tuned prediction techniques.
Finally, we have discovered that the best results can be
obtained with application of a hybrid solution that in-
cludes XGBoost (only mountain stages) and CatBoost
(the flat stages) models. We found that the moun-
tain model performs significantly better than the main
model. This happens because it uses only the filtered
subset that includes only the relevant races. Addition-
ally, it can be explained by tactics of the team when
the rider artificially reduces his/her performance dur-
ing the flat stages. These additional contextual at-
tributes of the race stages can be considered in the
future work. Moreover, the extension of the dataset
by the time-frame and number of the considered rid-
ers can be helpful to obtain even more accurate results
since the method has some principal limitations which
are related to data availability but its potential oppor-
tunities could be already identified. This research has
also identified some interesting characteristics about
the predictors of the tested models. For instance, the
stepwise linear models are mostly depended on the
race profile (in terms of the route which is known in
advance) than on the previous training session. How-
ever, other models have obtained a lot of benefits with
the application of additional context parameters such
as the weight of the rider, the analytical aggregation of
the data from sensors (MMP and other) and the nor-
malized effect of the training sessions which helps to
estimate the influence of the training days on the race
more carefully. Additionally, the approach was vali-
dated with an open-source dataset that has confirmed
the robustness of the proposed framework. In conclu-
sion, this paper has shown that the niche of sport data
in cycling has a lot of opportunities in professional
sport.
In the future, we would like to check the possibil-
ity of applying a real-time prediction (Hassani et al.,
2019; Lu et al., 2017; Hassani, 2015) to track the
changes of performance during the training sessions
by using several input streams of parameters.
icSPORTS 2021 - 9th International Conference on Sport Sciences Research and Technology Support
52

REFERENCES
Brownlee, J. (2017). Machine learning mastery.how to get
reproducible results with keras. Last accessed 17 June
2019.
Burtscher, M., Faulhaber, M., Flatz, M., Likar, R., and
Nachbauer, W. (2006). Effects of short-term acclima-
tization to altitude (3200 m) on aerobic and anaerobic
exercise performance. International journal of sports
medicine, 27:629–35.
Castronovo, M., Conforto, S., Schmid, M., Bibbo, D., and
D’Alessio, T. (2013). How to assess performance in
cycling: the multivariate nature of influencing factors
and related indicators. Frontiers in physiology, 4:116.
Cecchini, G., Maria Lozito, G., Schmid, M., Conforto, S.,
Riganti Fulginei, F., and Bibbo, D. (2014). Neural
networks for muscle forces prediction in cycling. Al-
gorithms, 7:621–634.
Chen, T. and Guestrin, C. (2016). XGBoost: A scalable
tree boosting system. In Proceedings of the 22nd
ACM SIGKDD International Conference on Knowl-
edge Discovery and Data Mining, KDD ’16, pages
785–794, New York, NY, USA. ACM.
Cintia, P., Pappalardo, L., and Pedreschi, D. (2013). “En-
gine Matters”: A first large scale data driven study
on cyclists’ performance. In 2013 IEEE 13th Interna-
tional Conference on Data Mining Workshops, pages
147–153.
Eckhardt, K. (2018). Towards machine learning.choosing
the right hyperparameters for a simple lstm using
keras. Last accessed 19 June 2019.
Efroymson, M. (1960). Multiple regression analysis. Math-
ematical Methods for Digital Computers.
Fulco, C., Rock, P., and Cymerman, A. (2000). Improving
athletic performance: Is altitude residence or altitude
training helpful? Aviation, space, and environmental
medicine, 71:162–71.
Garvican-Lewis, L., Clark, B., Martin, D., Olaf Schu-
macher, Y., McDonald, W., Stephens, B., Ma, F.,
Thompson, K., J Gore, C., and Menaspà, P. (2015).
Impact of altitude on power output during cycling
stage racing. PloS one, 10:e0143028.
Gepsoft (2019). Choosing the fitness function. Last ac-
cessed 20 June 2019.
Gepsoft (2019). Mean absolute error. Last accessed 1 July
2019.
Hamlin, M. (2013). Live low-train high in elite athletes: A
case study of a responder and non-responder. Journal
of Athletic Enhancement, 4.
Hassani, M. (2015). Efficient clustering of big data streams.
PhD thesis, RWTH Aachen University, Germany.
Hassani, M. and Seidl, T. (2011). Towards a mobile health
context prediction: Sequential pattern mining in mul-
tiple streams. In 12th IEEE International Conference
on Mobile Data Management, MDM Volume 2, pages
55–57.
Hassani, M., Töws, D., Cuzzocrea, A., and Seidl, T. (2019).
BFSPMiner: an effective and efficient batch-free algo-
rithm for mining sequential patterns over data streams.
Int. J. Data Sci. Anal., 8(3):223–239.
Hilmkil, A., Ivarsson, O., Johansson, M., Kuylenstierna, D.,
and Erp, T. (2018). Towards machine learning on data
from professional cyclists. Proceedings of the World
Congress of Performance Analysis of Sport XII.
IBM (2019). Ibm knowledge center. Last accessed 20 June
2019.
Jobson, S., Passfield, L., Atkinson, G., Barton, G., and
Scarf, P. (2009). The analysis and utilization of cy-
cling training data. Sports medicine (Auckland, N.Z.),
39:833–44.
Jr., I. F., Rauter, S., Fister, D., and Fister, I. (2017). A col-
lection of sport activity datasets with an emphasis on
powermeter data. Technical report, 2017.
Karetnikov, A. (2021). Cycling framework openlapp. https:
//github.com/alexey-ka/OpenLapp. Last accessed 14
May 2021.
Kataoka, Y. and Gray, P. (2019). Real-time power perfor-
mance prediction in tour de france. Machine Learning
and Data Mining for Sports Analytics. MLSA 2018.
Lecture Notes in Computer Science, 11330:121–130.
Kenneth, B. (2011). Linear regression models with loga-
rithmic transformations. Last accessed 4 July 2019.
Leung, C. and W. Joseph, K. (2014). Sports data mining:
Predicting results for the college football games. Pro-
cedia Computer Science, 35.
Lu, Y., Hassani, M., and Seidl, T. (2017). Incremen-
tal temporal pattern mining using efficient batch-free
stream clustering. In Proceedings of the 29th In-
ternational Conference on Scientific and Statistical
Database Management, Chicago, IL, USA, June 27-
29, 2017, pages 7:1–7:12.
Maszczyk, A., Roczniok, R., Wa
´
skiewicz, Z., Czuba, M.,
Mikolajec, K., Zajac, A., and Stanula, A. (2012). Ap-
plication of regression and neural models to predict
competitive swimming performance. Perceptual and
motor skills, 114:610–26.
Pallapothu, H. S. R. (2019). What’s so special about cat-
boost? Last accessed 4 July 2019.
Pedregosa, F., Varoquaux, G., Gramfort, A., Michel, V.,
Thirion, B., Grisel, O., Blondel, M., Prettenhofer,
P., Weiss, R., Dubourg, V., Vanderplas, J., Passos,
A., Cournapeau, D., Brucher, M., Perrot, M., and
Duchesnay, E. (2011). Scikit-learn: Machine learning
in Python. Journal of Machine Learning Research,
12:2825–2830.
Przednowek, K., Iskra, J., and Przednowek, K. H. (2014).
Predictive modeling in 400-metres hurdles races. ic-
SPORTS 2014 - Proceedings of the 2nd International
Congress on Sports Sciences Research and Technol-
ogy Support.
Przednowek, K. and Wiktorowicz, K. (2013). Prediction of
the result in race walking using regularized regression
models. Journal of Theoretical and Applied Computer
Science, 7:45–58.
Rastegari, H. (2013). A review of data mining techniques
for result prediction in sports. Advances in Computer
Science, 2.
Xert (2019). Xert – discover. improve. perform. – smart
power-based training software. Last accessed 15 June
2019.
Yandex (2019). Overview of CatBoost. Last accessed 31
June 2019.
Data-driven Support of Coaches in Professional Cycling using Race Performance Prediction
53
