
A Machine Learning Model to Predict Player’s Positions based on
Performance
Zixue Zeng
1
and Bingyu Pan
2
1
Department of Biostatistics, School of Public Health, University of Michigan, Ann Arbor, Michigan, U.S.A.
2
School of Sports Engineering, Beijing Sports University, Xinxi Road no.48, HaiDian District, Beijing, China
Keywords: Football, Association Football Positions, BP Neural Network, Machine Learning.
Abstract: The prediction of the player's positions, or determining which position a player is suitable for based on sports
performance and physiological indicators, plays a major role in association football. This research is based
on the public dataset provided by Wyscout, from which player-related indicators are extracted and processed.
Six indicators, including the accuracy of shot, the accuracy of simple pass, the accuracy of glb (Ground loose
ball), the accuracy of defending duel,the accuracy of air duel, the accuracy of attacking duel, are selected
according to the ANOVA (analysis of variance) test, and being imported into BP neural network for training.
Since the neural network has three hyperparameters: training rate, iterations, and the number of neurons in
the hidden layer, it is required to use the k-fold cross-validation to evaluate by which hyperparameter pair the
model predict best. It is found that when the learning rate is set to 0.0125 and the hidden layer neuron is set
to 6, the average accuracy of the cross-check is the highest, which is 73%. When iterations reach 300, the
accuracy curve tends to converge. The final accuracy rate can reach 77%.
1 INTRODUCTION
In association football, 11 players on the team are
assigned into different positions describing their main
job and their area of operation. The player's positions
consist of four categories, goalkeeper, defender,
midfield, and attacker, each of which includes
subcategories like left-half, center-half, and right-half
in midfield. The prediction of a player’s position or to
determine which position a player is most suitable for
generally has the following benefits:
1.To Maximize player's performance. Each
position has different abilities and technical
requirements for players. For example, midfielders
need to have a solid passing ability because their main
duty is passing the ball to the forward to create a
scoring chance
(Thomas & Scott, 2012). For forwards,
because its primary responsibility is to score goals
and break the defense, high accuracy of shooting is a
prerequisite (“The greatest striker”, n.d.). If a player
who is suitable for forward is forced to play as a
defender, their disadvantages in defense and
interception may lead to poor performance. Therefore,
the team should allow each player to play their most
suitable position to maximize their performance.
2.Targeted training. Suppose the coach first
determines the player's most suitable position. In that
case, he can formulate a training plan and conduct
targeted training in advance to improve the player's
technical ability to have a better performance on the
field.
3. Assist the player selection process. Without a
precise and efficient model to predict the player's
position, the chances are high that the coach assigns
the player to the position he is not good at, which
cannot make up for the team’s weakness. If a
prediction system is available, the team can recruit
players that best address the team's deficits.
Many studies analyzed distinctions between
different positions in football. Luca Pappalardo,
Paolo Cintia, Alessio Rossi's paper describe the
world's most extensive open collection of soccer logs,
containing Spatio-temporal events (pass, shot, fouls,
etc.) that occurred every match in entire seven
prominent competitions. This highly detailed dataset
includes every events' subcategory(whether a pass is
a cross or a free-kick, etc.), its position in the field,
and the players involved in this event. This data is
highly applicable in research such as performance
analysis, prediction of competition results, and
passing network analysis. The research done by
36
Zeng, Z. and Pan, B.
A Machine Learning Model to Predict Player’s Positions based on Performance.
DOI: 10.5220/0010653300003059
In Proceedings of the 9th International Conference on Sport Sciences Research and Technology Support (icSPORTS 2021), pages 36-42
ISBN: 978-989-758-539-5; ISSN: 2184-3201
Copyright
c
2021 by SCITEPRESS – Science and Technology Publications, Lda. All rights reserved

Andrzej Soroka is based on the Castrol Performance
Index, a kinematic game analysis system that records
player movements during a game by use of semi-
automatic cameras (Andrzej. 2018). The results of the
study show that the distance players in different
positions cover differs significantly. Midfielders tend
to run frequently in the game, and the total running
distance of the game is higher than that of players in
other positions. Gaetano Altavilla and Lorenzo Riela
also evaluate the physical efforts required in different
positions using GPS technology (Altavilla, Riela, &
Tore, 2017). Their research shows the maximum
distance covered by the midfielder and defender is
higher than players in other positions; thus, they
developed greater metabolic power. Scholars such as
Yuesen Li and Runqing Ma build machine learning
models to predict football match data (Li et at., 2020),
but they intend to find the relationship between the
team’s various indicators and its ranking in the league.
This research first normalizes the original data
(converts data of different scales to the same scale),
which can significantly improve the reliability of the
data and ultimately improve the model's accuracy.
After that, the analysis of variance (ANOVA) method
was used to evaluate the indicators. The indicators
with insignificant differences were eliminated, and
they were not trained in the machine learning model.
Modric Toni, Versic Sime, and Sekulic Damir's
research aim to analyze the position-specific
differences of running performances (RPs), an
important parameter but lacking study of
contextualization when it comes to tactical solution
applications (Toni, Sime & Damir, 2020). Analysis of
variance and discriminant canonical analysis is used
to distinguish between three defensive players (3DP)
and four defensive players (4DP) tactical solutions
regarding the RPs for each playing position. The
results show that accelerations and decelerations
mostly contribute to the significant differentiation of
3DP and 4DP, higher occurrences with 3DP.
Additionally, total running distance and high-
intensity running of CDs (central defender) were
higher in 3DP.
Determining which position a player is suitable
for is the basis of football training prescription.
However, judging which position a player is suitable
for often relies solely on coaches and players'
subjective perception and game experience, and there
is no specific quantitative processing model. For
example, the coach will assign the taller player to the
defender's position based on their personal view that
the defender is usually higher than other outfielders
(Jeff, n.d.). At present, there are many analyses on the
sports performance characteristics of player positions,
but studies on player position prediction are few.
Therefore, building and training a machine learning
model that uniformly predicts a player's position can
assist coaches in selecting players based on their
sports performance. Additionally, it can also aid
players in targeted training based on their most
suitable positions.
2 METHODS
2.1 Sample and Data Source
With the development of computer technology, many
scholars have embarked on using big data analytics to
deal with football problems. Wyscout is a football
data analysis platform based on video data collection
and soccer logging (Luca et al., 2019). The data set it
provides includes the spatial location and detailed
information of all events (such as accuracy, etc.) in
each game of seven world-prominent leagues. If the
data is processed correctly and combined with related
mathematical models, the data set provided by
Wyscout can be used in player performance analysis,
the science of success andarea passing network
analysis.
Wyscout data mainly comes from video analysis:
Many trained video analysts collect the data through
tagging software to label each event in the game. The
labeling process often takes several years to complete
and requires frequent updates, mainly to guarantee
the reliability and validity of the data. Typically, the
data labeling process is completed by three operators,
two of whom are responsible for recording the
players' data on both sides of the match, and one is
responsible for monitoring.
The labeling process of a match include three
main steps:
1.Record the initial players and formation. Before
the game, an operator member will record the initial
formation of each team and the player's jersey number.
2.Labeling processing. For each event in the game,
an operator will designate a player and add a new
event on the timeline. Through a specially designed
keyboard, the operator can quickly enter the type
(pass, shot, etc.) and subtype of the event (for
example, the pass can be a header pass or a pass).
Finally, the staff will input the coordinated location
of the event and other related attributes.
3.Quality control. After the labeling process,
monitoring and adjustment of the labeling results will
be carried out. This mainly consists of two steps: first,
it will automatically run an algorithm that can reduce
and avoid the input errors made by operators. For
A Machine Learning Model to Predict Player’s Positions based on Performance
37

example, the algorithm compares the data of the two
teams participating in the game match, whether the 1-
to-1 attacking duel of one team corresponds to the 1-
to-1 attacking duel of the other team, and whether
their coordinates are the same. The second step is
done manually, including an in-depth check and
parameter correction.
2.2 Index Extraction and
Pre-processing
Because the machine learning model applied in this
study uses the indicators of football players to predict
which position the player is suitable for, the indicators
used as the input of the model generally include the
following two types:
1.Indicators representing player's physical
characteristics. The physical constitution of football
players differs from their positions. For example, the
average goalkeeper's height is a lot taller than the
outfielder because greater arm spans enable them to
cover more goal area.
2.Indicators of a player’s techniques. Unlike
physical characteristics, the indicators of techniques
can be improved through training, such as shooting
accuracy and passing accuracy. For example, a higher
duelling ability is a necessity for defenders as their
primary role is to stop attacks and prevent the
opposing team from scoring goals by blocking shots,
tackling, interception, etc.
In summary, considering the features of the
unprocessed dataset and the requirements for validity,
the selected indicators can be divided into two
categories.
The first category is about accuracy indicators,
including shooting accuracy, acceleration accuracy,
header pass accuracy, high passing accuracy, cross
accuracy, simple passing accuracy, glb accuracy,
attacking duel accuracy, defending duel accuracy, air
duel accuracy. The accuracy of indicators can be
calculated as:
Accuracy
∑
events with "accurate" tag
∑
events
(1)
By counting the number of events with an
"accurate" tag and the total number of this event, the
accuracy of this type of event can be calculated. In
order to ensure validity, any indicators with a sample
size of less than six are excluded to prevent the
generation of extreme data.
The second category is indicators that can
represent the player's own physical characteristics,
including height, mass, and age.
2.3 Indicator Selection
Some indicators have little correlation with football
positions, and the differences of this type of indicator
for different football positions are not significant.
Bringing these indicators into the model will result in
lower model accuracy; thus, an analysis of variance
(ANOVA) was conducted to filter indicators
according to positional categories (Anscombe, 1948).
Table 2 below summarizes the p-values
corresponding to the 13 indicators obtained through
pre-processing.
Table 1: Extracted indicators and their p-values.
N
ame A
b
breviation
p
-value
Accuracy of
Shoo
t
AS
1.729322e-11
Accuracy of
Acceleration
AA
0.101301
Accuracy of
Headpass
Ahead
0.00004
Accuracy of
Hi
g
hpass
Ahigh
0.591897
Accuracy of
Cross
AC
0.263998
Accuracy of
Simple pass
ASim
7.756054e-09
Age Age
0.394952
Weight Weight
0.990482
Height Height
0.456512
Accuracy of
g
lb
Aglb
9.657622e-18
Accuracy of
defendin
g
due
Adefend
2.076384e-08
Accuracy of
Air duel
Aair
5.994083e-11
Accuracy of
Attackin
g
duel
Aattack
3.012137e-08
Because the BP neural network has high
requirements for indicators, 0.00001 is selected as the
threshold. Six indicators are finally screened out,
including accuracy of shoot, accuracy of simple pass,
accuracy of glb, accuracy of defending duel, accuracy
of air duel, accuracy of attacking duel.
2.4 Model Implementation and
Validation
The prediction of a player's position based on sports
performance indicators is computed by BP neural
network, a widely used algorithm for machine
learning (Ian, Yoshua, & Aaron 2016). In this
icSPORTS 2021 - 9th International Conference on Sport Sciences Research and Technology Support
38
algorithm, the loss function was first calculated with
respect to the weights of a network for a single input-
output by the chain rule as (
Nielsen, 2015):
𝑐𝑜𝑠𝑡
1
2
𝑡𝑎𝑟𝑔𝑒𝑡
𝑜𝑢𝑡
(2)
Where 𝑡𝑎𝑟𝑔𝑒𝑡
and 𝑜𝑢𝑡
are the target output and
the computed output of the neuron 𝑖. The weight of a
neuron is updated as (Rumelhart, Hinton, & Williams
1986):
∆𝑤 𝜇
𝜕𝐶𝑜𝑠𝑡
𝜕𝑤
(3)
Where 𝜇 stands for the learning rate. In this study,
the BP neural network was modified accordingly to
meet the requirements of the data format:
1.Adjust the input layer. The input layer of the BP
neural network is equal to the number of input
indicators.
2. Adjust the output layer. Three output neurons
are arranged, corresponding to the three positions of
the players one-to-one. For the attacker, the expected
output is (1,0,0), the midfield is (0,1,0), and the
defender is (0,0,1).
3. Arrange the number of hidden layers to 1. For
neural networks, too few hidden layers will lead to
lower prediction accuracy, while arranging two or
more hidden layers will lead to the problem of
excessive computation. Thus, setting one hidden
layer can ensure accuracy while maintaining a low
computational load.
4. Adjustability of hyperparameters. The BP
neural network has three hyperparameter indexes: the
number of iterations, the learning rate, and the
number of hidden layer neurons. In designing the
program, the corresponding hyperparameter
adjustment interface is developed, which is
convenient to improve the accuracy of the model by
adjusting the hyperparameter.
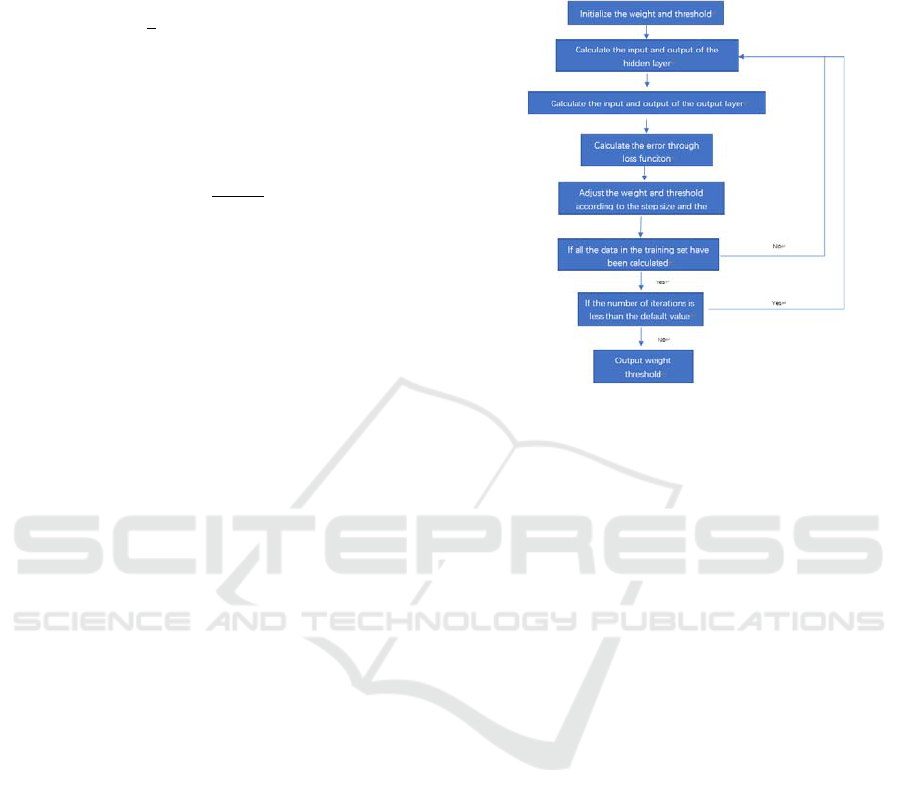
The process of BP neural network includes:
(1). Initialize the weight and threshold.
(2). Calculate the input and output of the hidden
layer.
(3). Calculate the input and output of the output
layer.
(4). Calculate the error (difference between the
network output and its expected output) through the
loss function.
(5). Adjust the weight and threshold according to
the learning rate and the error.
(6). If all the data in the training set have been
calculated, proceed to 7, otherwise, repeat 2.
(7). If the number of iterations is less than the
default value, repeat 2; otherwise, proceed to 8.
(8). Output weight threshold.
Figure 1: Schema of the BP neural network framework.
Cross-validation was simulated to validate the
model's accuracy to predict non-trained data under
different hyperparameters and prevent overfitting or
selection bias (Cawley & Talbot, 2010). Comparing
the cross-validation accuracy when the training rate
set to be 0.005, 0.0075, 0.01, 0.0125, 0.015 and the
number of hidden layer neurons set to be 2, 3, 4, 5, 6,
7, 8, 9, 10, 11, the hyperparameter pair with the
highest prediction accuracy rate will be exported.
Under this hyperparameter pair, the predicted
positions of players under the machine learning
model were tested with their actual positions.
3 RESULTS
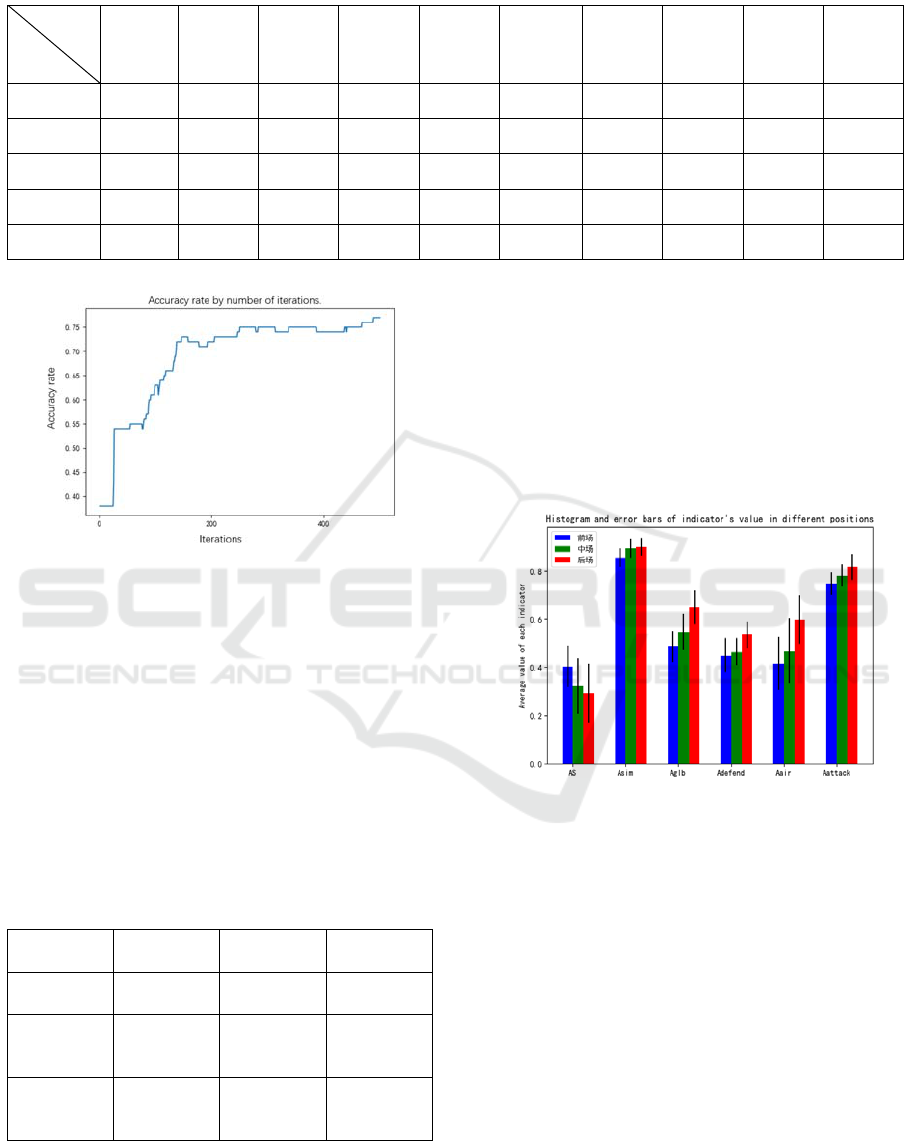
Table 2 shows the cross-validation results of different
hidden layer neurons when the learning rate is set to
0.005, 0.0075, 0.01, 0.0125, and 0.015. It is found that
when the learning rate is set to 0.0125 and the hidden
layer neuron is set to 6, the average accuracy of the
cross-validation is the highest, which is 73%. Figure
2 is a line chart of the model accuracy rate changing
with the number of iterations. It can be seen that when
the number of cycles exceeds 300, the accuracy rate
curve tends to converge. Thus, the final accuracy rate
can reach about 77%.
A Machine Learning Model to Predict Player’s Positions based on Performance
39
Hidden layer
neuron
Learning rate
Table 2: Cross-validation results under different numbers of hidden layer neurons and learning rate.
2 3 4 5 6 7 8 9 10 11
0.005 59.74684 63.41771 68.6076 64.3038 58.86078 62.91141 69.3671 61.77215 67.34179 64.43038
0.0075 61.77216 68.98734 67.9747 66.20252 67.59494 67.59495 61.13924 63.54432 56.70887 65.69621
0.01
60.1266
69.11393 69.11393 67.59494 65.69621 70.12658 68.73417 64.43038 72.02532 69.24051
0.0125 63.92404 67.97468 71.13924 71.13925 73.29114 73.1645.5 72.65824 64.81014 68.22786 66.83544
0.015 69.62025 65.44303 68.48101 69.3671 70.37975 64.05064 72.78481 69.99999 66.83544 73.03797
Figure 2: Accuracy rate by number of iterations.
Table 3 below is a confusion matrix composed of
predicted results and actual values. The rows
represent the predicted results, and the columns
represent the true results. It is indicated that the model
performs strongly for midfielders and defenders but
lacks accurate prediction for attackers. The prediction
precision for midfielders and defenders was 77% and
90%, respectively, but the prediction precision for
attackers was only 40%. Meanwhile, the prediction
recall for midfielders and defenders was 85% and
71%, but the prediction recall for attackers was 50%.
Table 3: Confusion Matrix of Football Player's Predicted
Position and Real Position.
Actual
Values
Attackers Midfielders Defenders
Predict to
b
e attackers
4 5 1
Predict to
be
midfielders
4 46 10
Predicted
to be
defenders
0 3 27
Figure 3 below shows the histogram and error bars
of the average values of various indicators at different
positions. The 1-to-1 defending duel accuracy
(Adefend) shows that even though the difference
between attackers and defenders, the difference
between attackers and midfielders is relatively low,
the average difference between attackers and
midfielders is small. This means that if this set of
indicators is imported into the model, it will not be
constructive for training the model to distinguish and
compare the player's suitability between attackers and
midfielders.
Figure 3: Histogram and error bars of indicator’s value in
different positions.
4 DISCUSSION
This study used BP neural network to analyze the
position of football players, but this method has the
following limitations:
1.Local optimum. The BP neural network uses the
gradient descent algorithm to update the weights and
thresholds (LeCun, Bengio & Hinton, 2015). A major
problem with this method is local optimum, that even
though this solution is only optimal within a
neighboring set of candidate solutions, the local
search is stuck in this solution because no improving
adjacent neighbors are available.
icSPORTS 2021 - 9th International Conference on Sport Sciences Research and Technology Support
40

2.The rate of convergence is slow. For the BP
neural network, the gradient descent method it uses is
highly inefficient. For this experiment, when the
learning rate is 0.01, the number of iterations
generally needs to be set to more than 1500 to
guarantee accuracy. However, if the training rate is
modified to reduce the number of iterations, the
experimental results will be poor, mainly because of
missing the global optimum. Slow convergence rate
leads the computing to be time-consuming. During
cross-validation, for each hyperparameter, the
calculation time is about 2 minutes and 32 seconds
when the number of cycles is set to 1500, which
significantly slows down the research progress.
3.The number of hidden layers is limited.
Considering the Computational difficulty of the
complex neural network, the number of hidden layers
set by the BP neural network used in this research is
1. Setting more hidden layers can significantly
improve the model's predictive ability, but the
computational time will also increase significantly. In
future research, if equipment and time conditions
allow, more hidden layers can be added to improve
model performance and accuracy.
Because of the original data set format, this
experiment failed to obtain more accurate position
information of the football player and can only
predict which of the three positions (the attacker, the
midfielder, the defender) the player is suitable.
However, with the evolution of football, the division
of positions on the game field is more detailed, and
there are already eleven different sub-positions in
attackers, for instance, shadow strikers. Therefore,
the prediction model of this study is more suitable for
roughly judging which position a football player is
eligible to play and assisting players in developing
training plans and cannot perform more detailed
player classification.
The results show that the model’s overall ability
to predict which position the player is suitable for is
high, reaching 77%. This is because the ANOVA test
was conducted before the indicators being imported
into the machine learning model; thus, the indicators
differ significantly between different positions. On
the other hand, because the BP neural network has the
better predictive ability, the weight and threshold are
continuously updated through the gradient descent
method so that the accuracy curve converges and
stabilizes in the desired value. However, the
prediction ability of the model for different positions
is quite divergent. For example, although the
prediction precision for the defender and midfield
players is as high as 77% and 90%, the precision rate
for the attacker is only 40%. This is mainly due to the
varying data size between positions. For example, for
the testing set, the number of midfielders and
defenders accounted for 60% and 30%, respectively,
but attackers accounted for only 10%. This imbalance
of proportions will lead to more significant
differences in the final training results.
Moreover, the overall data size is also an
important issue. Although the original data in this
study include the five football leagues, including
Premier League (England), La Liga (Spain),
Bundesliga (Germany), Serie A (Italy), and Ligue 1
(France), because each piece of data is a football
player and its corresponding indicators, the overall
data size is not large. The total number of football
players in the five major leagues is 3603, and because
some players lack relevant indicators, the number of
football players finally brought into the model is only
891. This data size is relatively small for the machine
learning model.
From the analysis results of various indicators, the
attacker has the highest shooting accuracy, followed
by midfielders and defenders. Defenders outperform
other positions according to other indicators,
including accuracy of the simple pass, the accuracy of
glb, the accuracy of defending duel, the accuracy of
attacking duel, and the accuracy of air duel, followed
by midfielders and attackers. Because it is necessary
to frequently participate in the team's offense and
create shooting opportunities, this position in the
front field must be higher than other positions for the
players' shooting skills. The accuracy of glb, the
accuracy of defending duel, and the accuracy of
attacking duel can all reflect the player's defensive
ability. The defender is the last defensive line for the
opponents except for the goalkeeper, so it must have
a higher ability for dueling and interception ("Luiz
Adriano”, 2013).
5 CONCLUSION
When the learning rate is set to 0.125, and the number
of hidden layer neurons is 6, the model's accuracy rate
converges when the number of iterations reaches 300
or more, and the final accuracy can reach 77%. The
prediction accuracy rate for midfielders and
defenders was 77% and 90.0%, but the prediction
accuracy rate for attackers was only 40%. This shows
that the model has higher accuracy in predicting
which position a player is suitable for, but the
predictive ability of different positions is quite
different. The prediction precision of attackers is low,
which may be due to the small data size. Future
A Machine Learning Model to Predict Player’s Positions based on Performance
41

research will focus on collecting more data to
improve the predictive ability of attackers.
REFERENCES
Thomas, D.& Scott M. (2012). Soccer for dummies(2 ed.).
Indianapolis: John Wiley & Sons, Inc. p. 78
"The greatest strikers of all time". footballsgreatest.
weebly.com. Retrieved 15 May 2021. from
https://footballsgreatest.weebly.com/strikers.html
Soroka Andrzej.(2018).The locomotor activity of soccer
players based on playing positions during the 2010
World Cup.. The Journal of sports medicine and
physical fitness(6), doi:10.23736/S0022-
4707.17.04323-7.
Altavilla, G., Riela, L., Tore, A.D., & Raiola, G. (2017).
The Physical Effort Required from Professional
Football Players in Different Playing Positions. Journal
of physical education and sport, 17, 2007-2012.
Li Yuesen, Ma Runqing, Gonçalves Bruno, Gong Bingnan,
Cui Yixiong & Shen Yanfei. (2020). Data-driven team
ranking and match performance analysis in Chinese
Football Super League. Chaos, Solitons & Fractals(),.
doi:10.1016/J.CHAOS.2020.110330.
Modric Toni, Versic Sime & Sekulic Damir. (2020).
Position Specific Running Performances in
Professional Football (Soccer): Influence of Different
Tactical Formations.. Sports (Basel, Switzerland)(12),.
doi:10.3390/SPORTS8120161.
Pappalardo Luca, Cintia Paolo, Rossi Alessio,... &
Giannotti Fosca. (2019). A public data set of spatio-
temporal match events in soccer
competitions.. Scientific data(1),. doi:10.1038/s41597-
019-0247-7.
Pill, Jeff. (n.d.) "The Role of the Defender". active.com.
Retrieved 15 May 2021. from
https://www.active.com/soccer/articles/the-role-of-the-
defender
Anscombe F. J.. (1948). The Validity of Comparative
Experiments. Journal of the Royal Statistical Society.
Series A (General)(3),. doi:10.2307/2984159.
Goodfellow, Ian; Bengio, Yoshua; Courville, Aaron
(2016). "6.5 Back-Propagation and Other
Differentiation Algorithms". Deep Learning. MIT
Press. pp. 200–220. ISBN 9780262035613.
Nielsen, Michael A. (2015). "How the backpropagation
algorithm works". Neural Networks and Deep
Learning. Determination Press.
Rumelhart; Hinton; Williams (1986). "Learning
representations by back-propagating errors" (PDF).
Nature. 323 (6088): 533–536.
Bibcode:1986Natur.323..533R. doi:10.1038/323533a0.
S2CID 205001834.
Cawley, Gavin C.; Talbot, Nicola L. C. (2010). "On Over-
fitting in Model Selection and Subsequent Selection
Bias in Performance Evaluation" (PDF). 11. Journal of
Machine Learning Research: 2079–2107.
LeCun, Yann; Bengio, Yoshua; Hinton, Geoffrey (2015).
"Deep learning". Nature. 521 (7553): 436–444.
Bibcode:2015Natur.521..436L.doi:10.1038/nature145
39. PMID 26017442. S2CID 3074096.
"Luiz Adriano: I will try to score a goal and dedicate it to
my daughter". Shakhtar Donetsk's official website. 3
March 2013. Retrieved 20 August 2014. from
https://shakhtar.com/news/all-news/.
icSPORTS 2021 - 9th International Conference on Sport Sciences Research and Technology Support
42
