
A Teamwork Tool to Support Group Work in Online-based Higher
Education: Exploring User Experience and the Use of Support
Mechanisms by Students
Jessica Brandenburger
a
and Monique Janneck
b
Department of Electrical Engineering and Computer Science, Technische Hochschule Lübeck, Lübeck, Germany
Keywords: HCI, User Interface, Online Teaching, Group Work, Visualization, Teamwork Tool, Learning Analytics.
Abstract: Teamwork is often used in online and blended courses. However, numerous problems can arise within
computer-supported groups. In this paper we present a tool for supporting teamwork in computer-based
collaborative learning (CSCL) in higher education. The tool was implemented as a Moodle plugin and
combines automatic analyses of student behavior as well as students’ self-reports on their teamwork. The tool
was evaluated in two field tests by students of an online and a blended learning course. Surveys, group
discussions, and log file analysis were used as evaluation methods. The teamwork tool was rated positively
in terms of usability and visual aesthetics. Functions that reflect participation of group members and task
deadlines turned out to be very useful for students. In general, students consented to the automatic analysis of
their learning behavior. Based on the results of our studies, we derive design implications as well as
suggestions for improving functionalities to support students’ teamwork online.
1 INTRODUCTION
Due to the growing number of students studying
online, teachers are faced with the challenge of
designing didactically meaningful learning settings
for online courses. This is especially challenging in
very large courses, making it harder for teachers to
monitor individual learning processes. Collaborative
learning (Dillenbourg, 1999) by students can be
particularly conducive to learning and is often part of
innovative teaching formats (Krämer et al., 2017). So
far, standard learning management systems (LMS)
have mostly offered few advanced possibilities to
support students’ teamwork online, mainly regarding
group formation, collaborative editing, or teacher
dashboards for monitoring student’s activities.
However, awareness for the coordination of group
activities is required (Dourish and Bellotti, 1992).
The framework the ‘Big Five’ in teamwork describes
core variables that influence the effectiveness of
teamwork (Salas et al., 2005). Shared mental models,
mutual performance monitoring and mutual trust are
key factors for effective learning teams (Fransen et
a
https://orcid.org/0000-0003-0478-1353
b
https://orcid.org/0000-0003-4269-009X
al., 2011). Furthermore, team effectiveness also
depends on team constellations and roles within a
team (Fransen et al., 2011) as well as provided
materials and task complexity. Collaboration scripts
can have positive effects of the effectiveness of team
collaboration as well as negative effects through the
risk of over scripting and avoiding natural team work
(Dillenbourg, 2002). A substantial review of research
literature on designing and supporting effective
collaborative learning is provided by Strauß and
Rummel (Strauß and Rummel, 2020).
We focus on solutions within teamwork regarding
coordination, communication and engagement
(reciprocal interaction) to avoid free-riding effects
(Janssen et al., 2011) and making activities
transparent for group members. For example, unequal
participation of group members or lack of feedback
from team members can cause problems (Strauß et
al., 2018). The aim of our research is to develop
intelligent, automated diagnostic methods and
interventions that support teamwork in online
teaching environments. Visualizations that mirror, for
example, learning behavior and activities of students
Brandenburger, J. and Janneck, M.
A Teamwork Tool to Support Group Work in Online-based Higher Education: Exploring User Experience and the Use of Support Mechanisms by Students.
DOI: 10.5220/0010653100003058
In Proceedings of the 17th International Conference on Web Information Systems and Technologies (WEBIST 2021), pages 27-40
ISBN: 978-989-758-536-4; ISSN: 2184-3252
Copyright
c
2021 by SCITEPRESS – Science and Technology Publications, Lda. All rights reserved
27

and prompts with concrete calls to action to improve
learning behavior (Soller et al., 2005), can possibly
increase group awareness and enable successful
teamwork. We developed a teamwork tool to support
group work in online teaching environments,
delivering fast feedback to students and give groups
the opportunity to regulate themselves and to avoid
group conflicts during teamwork. Our tool contains
functions that are quickly visible to students within
their standard online teaching environment to reduce
cognitive effort.
In this paper, we present the teamwork tool and its
use and evaluation in two field tests. To collect
evaluation data, online surveys, group discussions
and log file analysis were used to address the main
research questions: 1) Do students benefit from using
the teamwork tool? 2) Which functions are most
useful to actually make teamwork better? Based on
the results of our mixed method design, we derive
design implications as well as suggestions for
improving functionalities to support students’
teamwork online.
2 RELATED WORK &
PROBLEMS WITHIN GROUP
WORK
Learning analytics – i.e. measuring, recording,
analyzing and reporting learners’ data – has great
potential for reflecting learner behavior and guiding
learners in LMS (Siemens et al., 2011). The reflection
of learner behavior by means of learning analytics
tools can raise awareness of teachers and students
(Verbert et al., 2014). Iterative workflows, such as the
LATUX workflow (Learning Awareness Tools –
User eXperience) (Martinez-Maldonado et al., 2015)
and guidelines for designing for social awareness of
cooperative activities (Janneck, 2009) can support the
design, development and validation of learning
analytics tools.
Fundamentally, feedback from teachers to
students should be timely, relevant and constructive,
understandable, positive and contain suggestions for
improvement (Silverman et al., 1992, Hardman,
2008, Brown et al., 2013). This should also be taken
into account when designing automatic tutoring
systems.
Many standard support mechanisms and tools for
synchronous (video, chat) and asynchronous (e-mail,
forums) communication within CSCL/CSCW
platforms are already available (Appelt, 2004). Open
learner models (Bull and Kay, 2010) and group
models (Upton and Kay, 2009) that support and
enable awareness and self-regulation of individual
learners and groups by reflecting learning data are
used by intelligent tutoring systems which collect and
analyze student data. Some standalone learning
analytics- and educational tools developed within
research contexts, such as LOCO-Analyst (Ali et al.,
2012), GLASS (Leony et al., 2012), Course Signals
(Arnold and Pistilli, 2012), StepUp! (Santos et al.,
2012), SAM (Govaerts et al., 2012) and Student
Inspector (Scheu and Zinn, 2007) enable teachers and
learners to analyze learners’ traces, interactions,
activities, time spent on activities, and performance
evaluation. Likewise, early warning systems seek to
identify and support students at risk of failing a course
by analyzing behavioral data; e.g. Course Signals
(Arnold and Pistilli, 2012), StepUp! (Santos et al.,
2012), SAM (Govaerts et al., 2012), Student
Inspector (Scheu and Zinn, 2007) Automated
Wellness Engine (AWE) and Personalized Adaptive
Study Success (PASS) (Leitner and Ebner, 2017).
However, the impact of such systems on learner
behavior is not clear. In Verbert’s (Verbert et al.,
2014) investigation of several learning analytics
tools, only one – Course Signals – had a clearly
positive effect on students' learning. Moreover, many
tools focus on individual learner data and behavior.
Regarding teamwork, Narcissus was developed
especially for the overview of activities of group
members for students (Upton and Kay, 2009).
In the following we refer to small teamwork and
their support in online teaching higher education.
Groups that exist for a specific purpose, such as
learning groups that pursue a common goal, are
viewed as formal groups (Janneck and Janneck,
2004) or as pop-up communities (Garreta-Domingo et
al., 2018). Small groups usually consist of 3 to 5/6
people. To support small teamwork, it is essential to
focus on typical problems that may occur during
online teamwork. As a basis we used a library of
typical problems developed by Strauß et al. (Strauß et
al., 2018). Furthermore, we evaluated numerous ideas
for support mechanisms in online teaching
environments as part of usability tests in which we
presented paper prototypes to students, and within a
workshop with students. Based on this, we focus on
main problems in the area of communication,
engagement and coordination such as 1) missing or
late feedback to posts, 2) unbalanced participation
between team members and 3) lack of awareness of
task progress (described by Strauß et al., 2018).
As a basis for our development of support
mechanisms for team collaboration we use the
learning management system Moodle, which is
WEBIST 2021 - 17th International Conference on Web Information Systems and Technologies
28

widely used in academia. Many extensions and
plugins are made available by a large developer
community. This is also true regarding learning
analytics tools, which we analyzed prior to our
developments. Regarding no/late feedback to forum
posts, e.g. plugins like Moodleoverflow
1
, forum
graph
2
and unanswered discussions
3
allow to
structure and represent discussions. Regarding
unbalanced participation, plugins for analyzing
students’ activity like Analytics and
Recommendations
4
, GISMO
5
, IntelliBoard
TM
6
,
SmartKlass
TM
7
, Completion Progress
8
exist, which
provide analysis of student data to teachers. Plugins
with predictive models like students at risk of missing
assignment due dates
9
support teachers as well.
Regarding missing awareness of task progress, ToDo
List
10
, Checklist
11
and note
12
plugins and modules as
well as Level up!
13
– a gamification tool where
students can gain experience points and reach levels
in the course based on their activities – are available.
However, most plugins provide functions for
individual learning or representations of student
behavior for teachers. Therefore, we aimed at
developing a teamwork tool that supports online
teamwork and enables group members to reflect on
their learning behavior. We focus on design,
acceptance and usage of the teamwork tool by
students.
3 DESIGN OF A TEAMWORK
TOOL
To support problems that can arise during online team
collaboration, we developed a modular tool that
includes six functions intended to support typical
problems within teamwork: Managing deadlines,
monitoring participation and contributions, keep
track on a shared ToDo List, allow awareness of
group dynamics and group members’ mood, and
manage the group members’ availability. A modular
tool provides the possibility for teachers to adapt the
functions to the respective didactic setting or course.
1
https://github.com/learnweb/moodle-
mod_moodleoverflow
2
https://github.com/ctchanandy/moodle-
report_forumgraph/tree/Moodle-3.1
3
https://github.com/deraadt/moodle-
block_unanswered_discussions
4
https://moodle.org/plugins/block_analytics_recommendations
5
https://bitbucket.org/steveorulez/block_gismo/src/master/
6
https://intelliboard.net
In addition, more functionalities can be added easily
in the development process.
3.1 Appearance
Data can be visualized in many different ways
(Zelazny, 2001, Lengler and Eppler, 2007, Abela,
2008, Behrisch et al., 2018). Studies show that
classical data and information visualizations, such as
bar, column, donut charts are often preferred, because
people are familiar with these visualization methods
(Grammel et al., 2010). As they were also rated best
besides bubble charts by students in terms of their
attractiveness, usability and comprehensibility
(Brandenburger and Janneck, 2018), these classical
visualization techniques were used for the
visualizations we address. We mainly use donut and
bar (column) charts to reflect learning results and
information to students. Regarding the color
appearance, studies show that tetradic color schemes
are attractive to students, but do not attract more
attention than analog color constellations within the
first impression (Brandenburger et al., 2019).
Therefore, we decided to use a scheme with color
contrast for the teamwork tool, which matches the
color design of our LMS Moodle. In addition, we
chose a sans-serif typography to ensure good
legibility on all possible end devices (Vaughan,
2006).
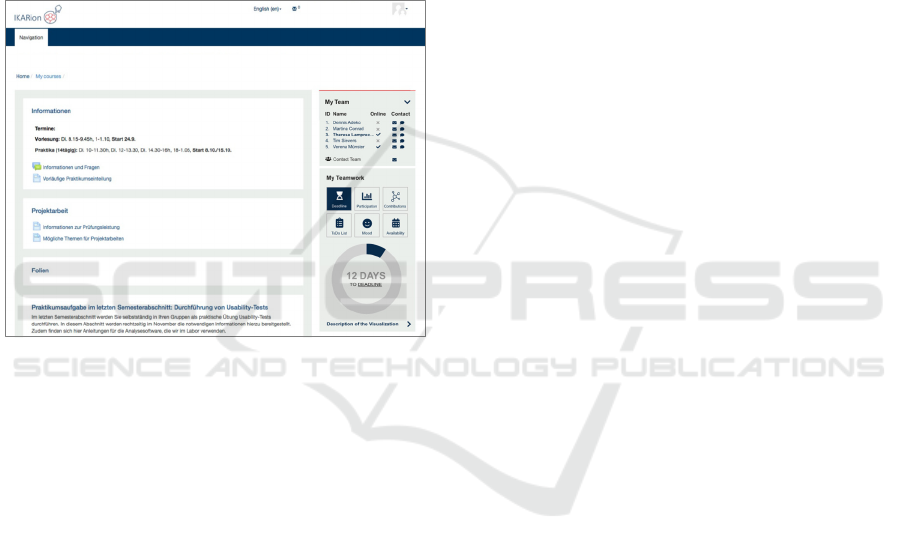
The teamwork tool has three areas: At the top the
“My Team” area lists team member names (fictive for
presentation), online status and contact opportunities
like chat and email. Below in the “My Teamwork”
area navigation (function) buttons can be found. For
the tile navigation we designed icons ourselves and
also used some from the font awesome pool
14
. Icons
are supplemented with a label to enable users to
communicate quickly and easily with the teamwork
tool. In the bottom area the content of the selected
function is shown (Figure 1). Detailed descriptions
for all functions are available so that students can see
what exactly is being visualized.
In terms of positioning, studies show that
visualizations are generally perceived better in the
header of the LMS than in the sidebar during the first
7
https://github.com/klassdata/moodle-local_smart_klass
8
https://moodle.org/plugins/block_completion_progress
9
https://github.com/dmonllao/moodle-
local_latesubmissions
10
https://github.com/mudrd8mz/moodle-block_todo
11
https://moodle.org/plugins/mod_checklist
12
https://github.com/gautamdas130780/moodle_block_mynotes
13
https://github.com/FMCorz/moodle-block_xp
14
https://fontawesome.com
A Teamwork Tool to Support Group Work in Online-based Higher Education: Exploring User Experience and the Use of Support
Mechanisms by Students
29
impression (Brandenburger et al., 2019). However,
different Moodle installations and course templates
might require different layouts, therefore the
teamwork block plugin can be placed in the sidebar
as well as in the header.
For the investigation of the teamwork tool in the
field tests (section 4), we decided to place the tool in
the sidebar (Figure 1, tool translated to English for
presentation). Positioning in the sidebar enables
students to familiarize themselves with the tool
without changing the main content area. The header
of the main content area in this Moodle set-up usually
contains course-relevant information that should be
accessible as usual and easy to find for students.
Figure 1: Teamwork tool in the Moodle sidebar.
3.2 Functions
In the following we describe the six functions of the
teamwork tool more in detail.
The Deadline function illustrates course-related
deadlines (e.g. submission due dates) by means of a
donut chart illustrating days to pass until the next
upcoming deadline (Figure 2a, a). A donut chart was
chosen because donut charts were rated well in other
studies in terms of aesthetics and usability to show
task progress (Brandenburger et al., 2019).
Participation illustrates the participation of team
members in comparison to each other based on their
contributions in the group forum and their
contributions when editing a common document in
the wiki determined by word count to measure
productivity. The relative participation of the
individual team members is reflected by means of a
bar chart (Figure 2a, b) for showing frequency
distributions and making the comparison visible to
team members (Zelazny, 2001, Lee et al., 2017). This
function exists in two variants; variant 1) mirroring of
the participation tracked by the system and variant 2)
mirroring of the self-assessed participation (students
got to see this variant in the blended learning course
– variant 1 was less meaningful in a blended learning
scenario. The function participation (self-assessment)
contains a button “self-assessment”. If students click
this button, a pop-up opens with three questions,
whether they have a) followed contributions, b) wrote
contributions or c) worked offline. Stacked bar charts
indicate their ratings (points (from 0-4) of the 3
answered questions on the 5-point Likert scale). If
there is no self-assessment by students 10 days after
the start of the course or 10 days after the last self-
assessment, the pop-up for assessing the own
participation appears automatically.
In addition, the Contributions function visualizes
the contributions of team members in the forum and
wiki by means of a network diagram/graph. The
function supports individuals as well as the entire
group. By clicking on the graph a pop-up opens. Each
circle represents a forum / wiki post, with its size
proportional to the size of the post. There are two
zoom levels. On the first level the entire network is
visible, on the second level the number of words per
contribution is shown. When users hover over a post
(node) in the second zoom level, a tooltip is expanded
including a direct link to the original post.
Contributions which are missing a response are
marked, so that other students may respond directly
(Figure 2a, c).
The ToDo List allows students to post and assign
tasks. Each team member may add personal tasks that
are only visible to themselves as well as tasks that are
relevant and visible to the entire group. A task can be
marked as “done” and afterwards appears at the
bottom in the dropdown “completed ToDos" list.
Tasks can also be completely removed from the list.
Group tasks can be created by any group member and
are visible for all group members. A group task can
only be deleted by the person who created it and must
be checked as “done” by all members to be displayed
in the "completed ToDos" (Figure 2a, d).
The Mood function illustrates how satisfied team
members are with their teamwork. Each team
member can indicate the current level of satisfaction
with the teamwork by means of a three-level Kunin
scale (‘smileys’). The aggregated ratings (from sad =
0% (grey smiley), neutral = 50% (middle blue
smiley), happy = 100% (dark blue smiley)) are
displayed in a donut chart to all team members,
complemented by an emoticon corresponding to the
WEBIST 2021 - 17th International Conference on Web Information Systems and Technologies
30
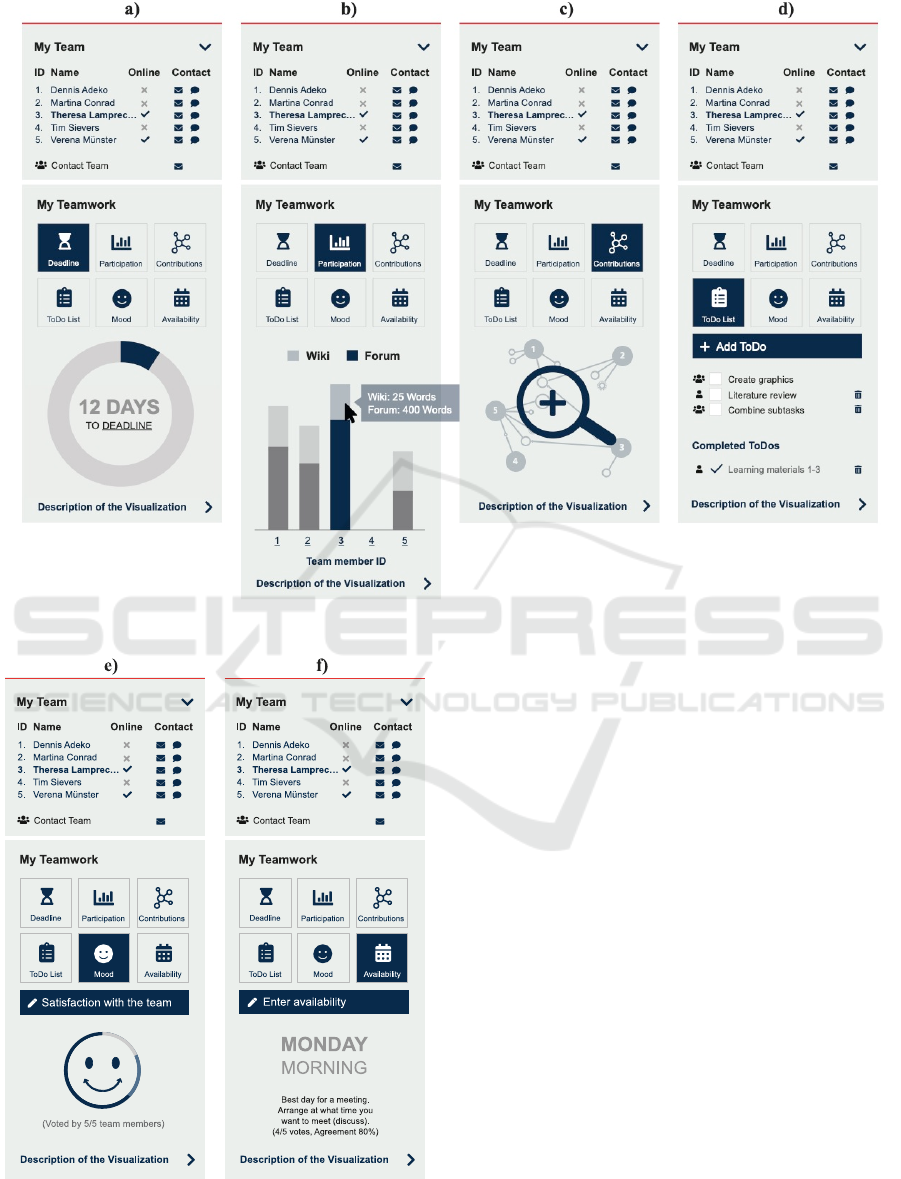
Figure 2a: Functions of the teamwork tool; Deadline a), Participation b), Contributions c), ToDo List d).
Figure 2b: Functions of the teamwork tool; Mood e),
Availability f).
average ratings (0-33% = sad smiley, 34-66% =
neutral smiley, 67-100% = laughing smiley, Figure
2b, e).
Availability shows the current availability of team
members to make scheduling appointments easier.
Each team member may indicate preferred days
and time periods. Matching results are shown. (Figure
2b, f).
Participation, Contributions and also Mood
address the problem of unbalanced participation
within groups. ToDo List, Deadline and
Contributions address the problem of missing
awareness of task progress. Availablity and
Contributions address the problem of missing/late
feedback to forum posts.
3.3 Implementation
As stated above, the teamwork tool was implemented
as Moodle plugin. The plugin uses the d3.js library
for data visualizations (Bostock et al., 2011). The
backend system, which diagnoses upcoming
problems within the group based on interaction
patterns of the students, consists of a distributed
feedback system, a learning analytics backend and a
A Teamwork Tool to Support Group Work in Online-based Higher Education: Exploring User Experience and the Use of Support
Mechanisms by Students
31
rule-based intervention system. It is described in-
depth in Constapel et al., 2019.
4 EVALUATION
The teamwork tool was evaluated in winter semester
2019/20 in an online Psychology course (named ‘OC’
further on) and a blended learning Computer Science
course (named ‘BLC’ further on) at three different
German universities. A total of 58 students
participated in the online course (OC, first field test).
In this course, students completed assignments in
small groups which changed every two weeks. The
students were able to see and use five functions of the
teamwork tool: Deadline, Participation (detected and
tracked by the system), ToDo List, Mood and
Availability and used the wiki for collaborative
writing. The Contributions function had not been
fully developed at the beginning of the semester. For
the sake of completeness, however, we wanted to
introduce the concept of that function as part of the
teamwork tool in this paper. We also consider this
function in our online studies (section 4.1).
In the blended learning course (BLC, second field
test) a total of 33 students took part. In this course
students worked in small groups (3-4 students) on a
large project throughout the semester. Teamwork was
done online as well as offline. The students were able
to see and use four functions of the teamwork tool:
ToDo List, Participation (self-assessment),
Availability and Mood. Like in the OC, the
Contributions function was not ready yet at the
beginning of the semester and the Deadline function
was not used because there was only one fixed
deadline for handing in the semester project.
For evaluation, online surveys (section 4.1),
group discussions with the BLC students (section 4.2)
and log file analyses (section 4.3) were used to
examine how the functions of the teamwork tool were
used and perceived by students. Only data from
students who had agreed to participate in the
accompanying research was included in the
evaluation.
4.1 Online Studies
4.1.1 Method
An online survey was set up to evaluate the functions
of the teamwork tool. In the online course (OC) 34
students (female = 27, male = 6, average age 24 years)
participated. In the blended learning course (BLC) a
total of 17 (female = 7, male = 8, average age of 23
years) students took part in the survey. The survey
contained questions related to the usefulness of the
various functions of the teamwork tool. (This was
only included in the OC questionnaire, as additional
group discussions took place with the BLC students
to address these aspects). To evaluate the overall
experience with the tool, the meCUE 2.0
questionnaire for interactive products (Minge and
Riedel, 2013, Minge and Thüring, 2018, Minge,
2018) was used. Furthermore, we included a semantic
differential to make detailed assessments of
attractiveness and group perception. Students were
also asked whether they preferred automatic
assessments of their activities by the system or rather
assess their level of participation themselves and
whether they were critical of the way their data was
recorded in the LMS for analysis.
4.1.2 Results
Overall, the students indicated that they were
somewhat interested in reflecting on learning
outcomes and their learning behavior (OC: M = 3.76,
BLC: M = 3.5, see Table 1).
Table 1: Results of the items of the online surveys.
Item
Online Course
N M SD
Question
1
34 3.76 1.046
Question
2
Participation 31 4.32 0.871
Mood 31 2.23 1.146
Availability 31 2.9 1.375
ToDo List 30 2.23 1.165
Deadline 31 4.1 0.978
Contributions 29 2.93 1.252
Item
Blended Learning Course
N M SD
Question
1
16 3.5 1.211
Question
2
Queried in group discussion
1
How interested are you in visualizations of your learning
outcomes / learning behavior? (1 = no interest at all to 5 = very
great interest)
2
How useful do you find the following functions? (1 = not useful
to 5 = very useful)
According to a parameter-free Mann Whitney U-
Test, there are no significant differences regarding
interest in visualizations of learning outcomes /
learning behavior between the OC and BLC students.
All six functions had been presented and
described again in the survey (including those that
students had not been able to test themselves).
WEBIST 2021 - 17th International Conference on Web Information Systems and Technologies
32
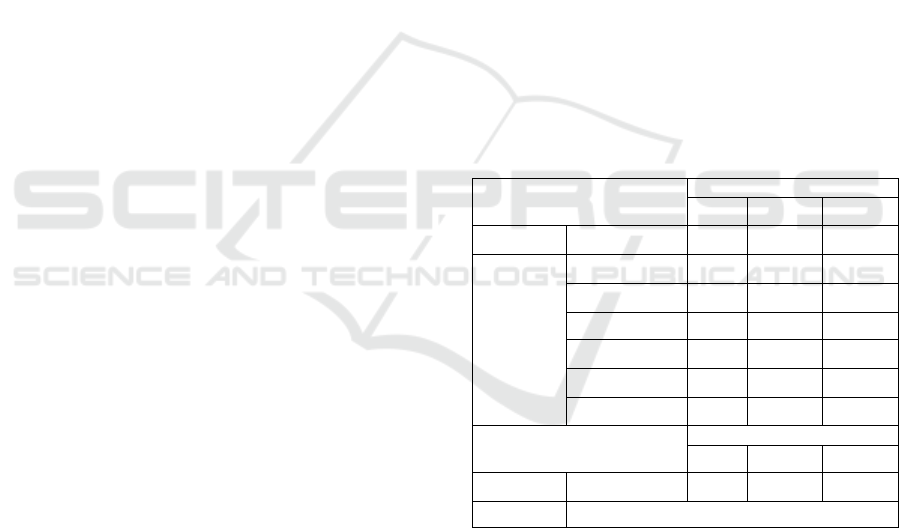
The concrete functions of the teamwork tool were
rated medium to very useful, resulting in the
following: 1.) Participation, 2.) Deadline, 3.)
Availability, 4.) Contributions, 5.) ToDo List and 6.)
Mood (see Table 1. and Figure 3.).
Figure 3: Usefulness of functions of the teamwork tool (OC,
N = 34).
Two OC students indicated that they had
comprehensibility problems with the function
Participation, three with Mood, two with Availability
and four with the ToDo List. Two of them stated that
they did not understand exactly how the ToDo List
worked, and three of them said that the participation
display did not work properly. The BLC students
were asked within the group discussion for
comprehensibility problems – nobody indicated any,
but they indicated suggestions for improving
functions. Results are presented in section 4.2.
Overall, the online students did not object to the
analysis of their learning behavior and data collection
for this purpose – 24% of OC students viewed this
critically. BLC students were asked for that in the
group discussions in section 4.2.
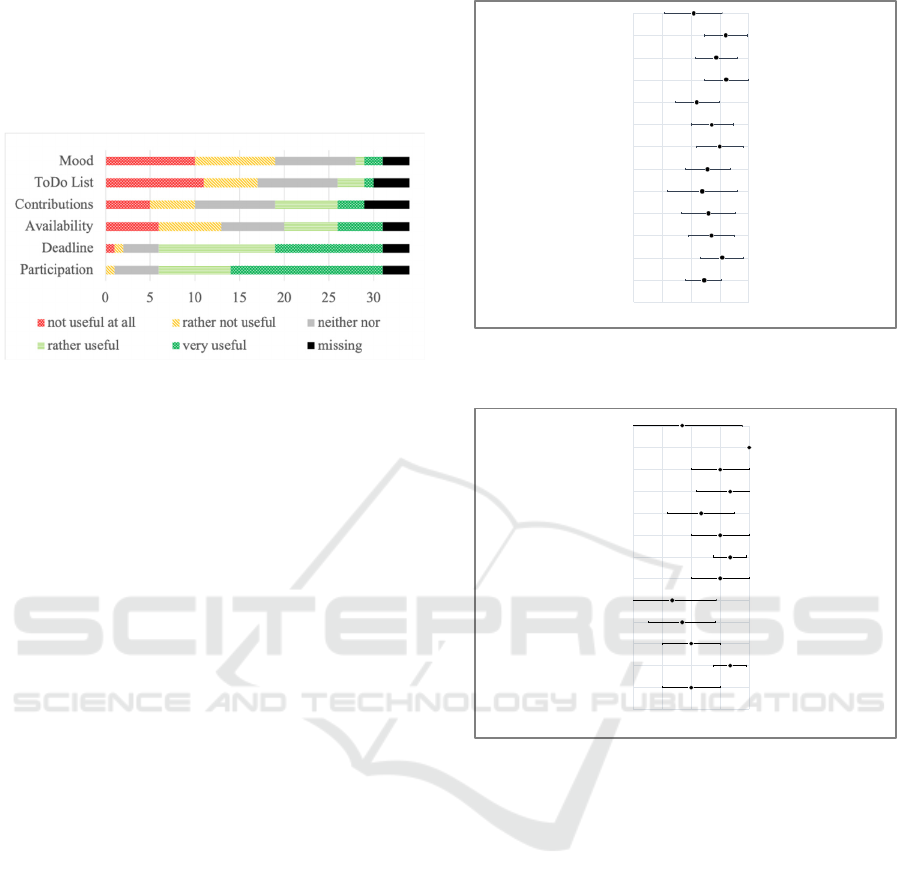
The semantic differential shows the results of the
assessment of the OC and BLC students in detail. In
general, the teamwork tool was rated rather positively
(see Figure 4 and Figure 5). BLC students tended to
rate the tool more negatively in terms of incentives,
attention to group work, group perception. Moreover,
they find the tool less informative and motivating
than OC students; however, the sample size was very
small.
Regarding the measurement and reflection of
students’ participation, 73.5% of the OC students
prefer that the system detects and tracks their
participation whereas 70.6% of the BLC students
prefer to assess their participation by themselves (see
Table 2).
Figure 4: Results (M, SD) of the semantic differential
evaluated by online course students N = 29-30.
Figure 5: Results (M, SD) of the semantic differential
evaluated by blended learning students N = 3.
A chi-square test – χ
2
(1, n = 49) = 11,492, p =
.001, φ = .484 (Yates’ correction for continuity p =
.002) shows a highly significant relationship between
form of study and preferences for forms of
measurement and reflection of participation during an
online course (no cells had an expected frequency
below 5).
The OC students used the tool much more often
than the BLC students (see Table 2).
Table 3 shows the results of the meCUE ratings
for the online and blended learning course. The
meCUE items are measured by means of a 7-point
Likert scale (from 1 = completely disagree to 7 =
completely agree).
The overall impression was determined by a
semantic differential from -5 = bad to 5 = good.
-21012
motivating
not conforming to expectations
not clearly represented
boring
laborious
confusing
inconsistent
does not draw attention to group work
does not improve group perception
meaningless
not descriptive
demotivating
consistent
draws attention to group work
improves group perception
informative
descriptive
conforming to expectations
clearly represented
stimulating
concise
orderly
gives no incentive to change behavior
not learnable
gives incentive to change behavior
learnable
3,43
4,07
3,7
3,6
3,37
3,57
4
3,73
3,2
4,21
3,87
4,2
3,07
-2 1 0 1
demotivating motivating
2
does not improve group perception improves group perception
meaningless informative
not descriptive descriptive
confusing orderly
inconsistent consistent
does not draw attention to group work draws attention to group work
not clearly represented clearly represented
boring stimulating
laborious concise
gives no incentive to change behavior gives incentive to change behavior
not learnable learnable
not conforming to expectations conforming to expectations
3
4,33
3
2,67
2,33
4
4,33
4
3,33
4,33
4
5
2,67
A Teamwork Tool to Support Group Work in Online-based Higher Education: Exploring User Experience and the Use of Support
Mechanisms by Students
33
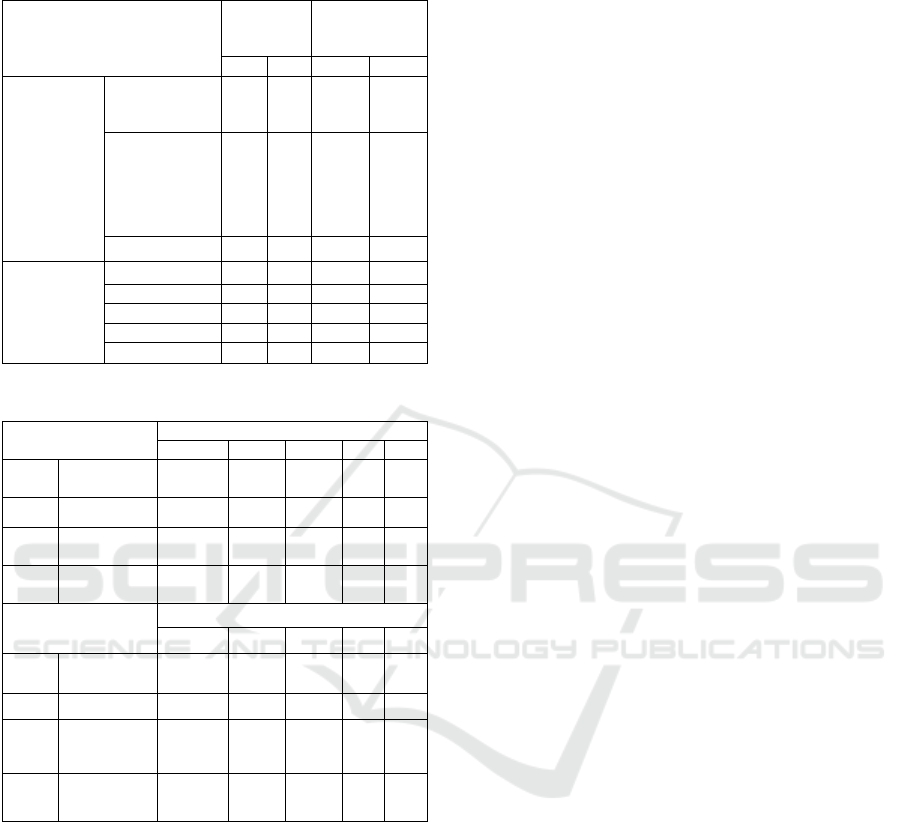
Table 2: Form of measurement of participation students
prefer and usage of the teamwork tool.
Item
Online
Course
Blended
Learning
Course
N % N %
Which form of
measurement
and reflection
of your
participation
during an
online
course do you
prefer?
I prefer to assess
my participation
myself
8 23.5 12 70.6
I prefer that the
system detects
and tracks my
participation
25 73.5 4 23.5
Missing 1 2.9 1 5.9
How many
times did you
use the
"teamwork
tool"?
Not at all
2 5.9 13 76.5
Rare 19 55.9 3 17.6
Regularly 10 29.4 0 0
Frequently 2 5.9 0 0
Missing 1 2.9 1 5.9
Table 3: Results of the standardized meCUE questionnaire.
meCUE Scale
Online Course N = 31
Median Mean SD Min Max
M
*
I
Usefulness 4.67 4.51 1.09 1.67 7
Usability 6 6.10 0.72 4.67 7
M
*
II
Visual
Aesthetics
5 5.23 0.96 3 7
M
*
V
Overall
rating
2.5 2.40 1.60 -1.5 5
meCUE Scale
Blended Learning Course N = 3
Median Mean SD Min Max
M
*
I
Usefulness 4.67 4.67 1.33 3.33 6
Usability 6 5.78 1.02 4.67 6.67
M
*
II
Visual
Aesthetics
5 5 0.33 4.67 5.33
M
*
V
Overall
rating
4 3.30 1.20 2 4
*Module
Overall the teamwork tool was rated as rather
useful (OC: M = 4.51, SD = 1.09, BLC: M=4.67, SD
= 1.33). The usability was rated very good with (OC:
M = 6.10, SD = 0.72, BLC: M = 5.78, SD = 1.02).
The same is true for visual aesthetics (OC: M = 5.23,
SD = 0.96, BLC: M = 5, SD = 0.33). The overall
rating is good (OC: M = 2.4, BLC: M = 3.3). A
benchmark comparison is not possible because there
are no benchmarks for the meCUE yet (Minge, 2018).
The OC and BLC students also had the
opportunity to note ideas or suggestions for
improving the tool. Feedback was mostly related to
the Participation function, e.g. questioning the
objectivity of the self-ratings. Furthermore, some
students wanted to see who was last online and when
in order to assess how active their group members are.
Other comments suggested different visualizations or
positioning of the tool.
4.2 Group Discussion
4.2.1 Method
In addition to the online questionnaire, we conducted
group discussions with students from the blended
learning course from our University to gain
qualitative insights, learn more about their perception
of the tool and discuss possible improvements. Due
to organizational reasons (travel / distributed
participants) this was not possible with participants
from the online course.
A total of 16 participants of the blended learning
course, divided into three smaller groups (4-7
members) to ensure lively discussions, took part in
the group discussions. Each group discussion lasted
about one hour.
The students were asked about the usefulness of
the functions of the teamwork tool, difficulties in
understanding and suggestions for improving the
teamwork tool. In addition, students were asked
whether specific prompts (with concrete
recommendations for actions to improve teamwork)
would generally be helpful for students in LMS and
whether they view the recording of their learning
behavior critically. Only statements that were
confirmed by at least one other person were taken into
account in the presentation of the results.
4.2.2 Results
The overall impression of the teamwork tool was
mostly positive. Students indicated that “you do not
have to leave the learning platform and may have to
use fewer external services because the tool offers
many useful functions”. However, the positioning in
the sidebar was criticized by the students because in
their experience “less relevant information is placed
there”. They suggest positioning the tool in the
header with a minimization function. Furthermore,
configurability of the tool would be interesting in
general, so that the students can decide for themselves
which functions (support mechanisms) they want to
use. However, students generally stated that other
external services are used for communication
purposes, such as WhatsApp, Discord etc. They
emphasized particularly the speed of communication
with WhatsApp and the advantage that they can see
who has read a message, while chat and email
functions in the LMS come with a certain delay.
WEBIST 2021 - 17th International Conference on Web Information Systems and Technologies
34

Students were also asked if they prefer to be able
to assess their participation themselves or if they
prefer that the system detects and tracks their
participation. Both self-assessment and automatic
tracking have disadvantages: “participation tracked
by the system poses a great risk, because it is difficult
to define the threshold values correctly to categorize
participation as ‘good’. People generally find it
difficult to self-assess because they do not know
whether they classify themselves correctly and the
perception of people is different. You don't want to
over- or underestimate yourself. You don't want to
wrong anyone”. Also, students fear that conflicts may
arise: “Self-assessment can lead to conflicts within
the group, and there is also a risk that performance
will be misjudged because students are at different
levels in the learning process, have prior knowledge
and have to make different efforts to solve a task”. A
mutual anonymous evaluation is proposed as a
suggestion, which is very popular. For example,
“there could be a presentation of the value of your
own rating compared with the value of the average
rating by other team members”, but according to the
students, this possibility “carries the risk that it
depends too much on sympathy”.
The Mood function showing satisfaction with the
team was generally interesting for the students
because this information is not available elsewhere,
but they indicated that the display of team satisfaction
can also be “…demotivating and cause bad mood if
no real conflict resolution is offered”.
The Availability function is generally considered
to be practical, but not necessary in a blended learning
course. Furthermore, linking this function with the
calendar would be desirable. Also, more intelligent
functions were suggested: “When entering personal
availability, the system could give feedback if other
team members have already checked the selected
date”. In this case, the system / automatic tutor could
remember and assist.
The ToDo List function was seen as very useful.
Nevertheless, many students have been using other
tools for years, such as Trello or GitLab (which,
however, is probably less common in other fields of
study, as all participants were Computer Science
students). According to the students, “it would be
desirable to be able to assign tasks to team members
if this is documented in a transparent way. Tasks
should also be assignable to more than one person.
Milestones could possibly also be added”.
Students were also asked if and how they
generally want to receive feedback from the system –
e.g. as prompts with specific calls for action,
information that draws attention to group events, or
suggestions for improving learning behavior in
general. According to the students, factual feedback
is particularly helpful to remind them of deadlines for
example. In general, however, textual hints that
something is going wrong within the teamwork is not
essential, because the team usually notices when
things are not going well. “Text feedback on the issue
may lead to an even worse mood. On the other hand,
if there is a positive message, you might just lean
back. If there is any text feedback from the system, it
should provide conflict resolution solutions that offer
real help.”
The students were also asked about using virtual
agents or tutors, as discussed in other studies
(Brandenburger and Janneck, 2018). In general, they
state that “…an automated tutor (e.g. chatbot,
mascot) indicates that someone is supporting us. A
mascot could be funny and give a nicer, maybe more
beautiful appearance, but actually you don't need it.”
An automated tutor, if available, “…should not look
like a teacher”. In general, a human appearance is
rather rejected.
The recording of student data for learning
analytics is mostly viewed uncritically "...compared
to data that is otherwise provided". Beyond their
personal benefit “…the university could benefit from
this for further development of the learning
platform”. However, a clear advantage for students
should be present. About half of the students
indicated that they would object if data were used
exclusively for the evaluation of students by teachers.
About one third of the participants generally took a
more critical stance. However, “more students might
agree to data collection if there is accurate
information about who has access to the data and
what data is recorded. A configurable data collection
with opt-ins would be a good solution”.
The students indicated that they might use the
teamwork tool more often in an online-only course.
However, there is a habit of using other external
services such as WhatsApp, Trello, GoogleDocs,
Dropbox, GitLab, etc.
4.3 Log Data
4.3.1 Method
For an insight into the actual use of the tool, we took
a closer look at the log files of the online course (OC)
during a period of 42 days, in which the students were
able to test the functions freely. Only data from
students who agreed to participate in the
accompanying research was taken into account,
resulting in N=50.
A Teamwork Tool to Support Group Work in Online-based Higher Education: Exploring User Experience and the Use of Support
Mechanisms by Students
35
In the following we analyze the views of the
teamwork tool. A view is created after visiting a page
or changing a function of the teamwork tool. Every
time students logged in, the Deadline function was
open per default, while during navigation through the
LMS the last chosen function was visible.
4.3.2 Results
Over a period of 42 days, there were a total of 4269
views of the Deadline function and 2136 views of the
Participation function, followed by fewer views of
the Availability, Mood and ToDo List functions
(Figure 6).
Figure 6: Views of functions of the teamwork tool by
students.
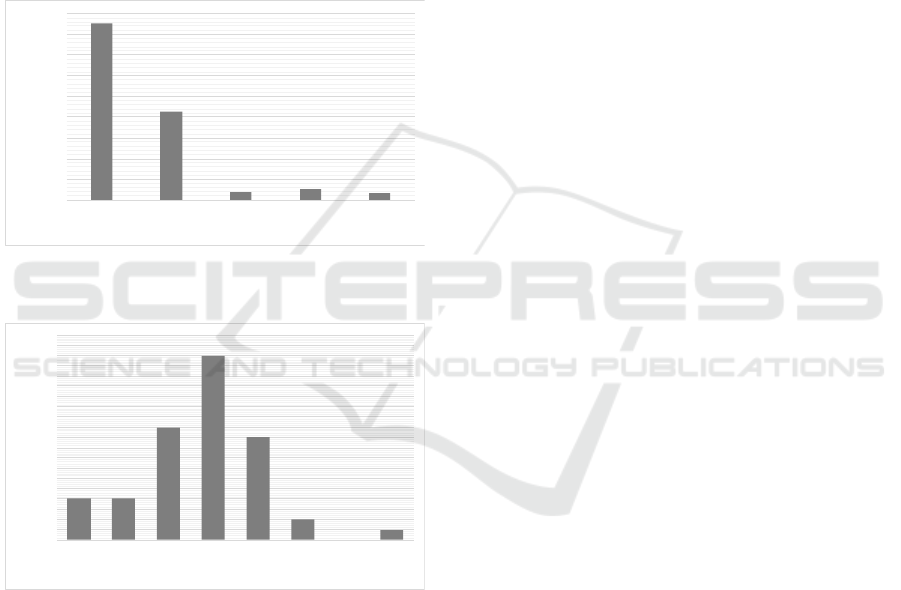
Figure 7: Number of views by students (N).
Looking at views per person, most students (18
students) have viewed the teamwork tool between
101 and 200 times (see Figure 7). Counting only
workdays, there were 5.6 views per person per day.
In total, 22% of the students did not view the
function Availability, 18% did not view the function
Mood and 34% did not view the function ToDo List.
After all 64% viewed all functions of the teamwork
tool.
5 DISCUSSION
Regarding the appearance of the teamwork tool, the
visual aesthetics was rated as good and the teamwork
tool seems to be very clear, orderly and descriptive.
Nevertheless, the teamwork tool does not seem to
attract high attention, incentive and stimulation
according to the evaluation (section 4.1). It is unclear
whether this is due to the positioning in the sidebar,
the color design or the functions themselves. We need
to take a closer look at what attracts users' attention
and whether students prefer to configure the
teamwork tool individually to show and hide certain
functionalities (which is more space-saving) or
display all functions side by side, as is usually the
case in a dashboard. Research has shown that
individual factors such as personality, experience and
cognitive abilities (Ziemkiewicz et al., 2012, Carenini
et al., 2014, Ottley et al., 2015) as well as external
factors, e.g. devices and level of adaptability (Toker
et al., 2012), influence the use of visualizations. In
addition, personality may influence preferences for
color appearance of visualizations (Saati et al., 2005).
Therefore, we suspect that understanding, use and
acceptance of the tools’ visualizations is highly
individual (Ziemkiewicz et al., 2012) and needs to be
investigated in more detail.
A small number of students stated in the survey
that they had problems understanding the
visualizations. We could not identify the exact origin
of these problems, but will closely monitor issues of
comprehension in the future, e.g. by usability tests.
By issuing prompts and advice for the students,
the teamwork tool acts as a kind of ‘automatic tutor’.
In its current form the tool does not provide any
(humanoid or non-humanoid) representation of this
‘tutor’. In the group discussions and also in other
studies (Brandenburger and Janneck, 2018), we have
seen that students prefer, if any, a non-human
appearance / symbolic representation. They also
stated that such a representation is not necessary, but
might enhance the user experience of the learning
environment. In future studies we would like to
investigate the impact of humanoid or non-humanoid
representations of ‘automatic tutors’ on motivation
and user experiences. Also, gamification approaches
could also be interesting.
Some of the functions of the teamwork tool,
namely Mood and ToDo List, were considered to be
not as useful, according to the results of the online
questionnaire. Likewise, analyzing the log data
showed that 34% of the online students did not view
the ToDo List. However, this might also reflect that
the function was simply not needed, as students in this
4269
2136
184
262
175
0
500
1000
1500
2000
2500
3000
3500
4000
4500
deadline participation availability mood todo
NUMBER OF VIEWS
FUNCTIONS
44
11
18
10
2
1
0
1
2
3
4
5
6
7
8
9
10
11
12
13
14
15
16
17
18
19
20
0-5 6-20 21-100 101-200 201-300 301-400 401-500 501-600
STUDENTS (N)
NUMBER OF VIEWS
WEBIST 2021 - 17th International Conference on Web Information Systems and Technologies
36

course worked on smaller tasks over shorter periods
of time, whereas the students in the blended learning
course – working on a semester task – stated that the
ToDo List was particularly helpful. Thus, features of
support tools need to be adapted to the didactical
setting in a particular course. This is possible due to
the modular structure of the teamwork tool, but was
not done in this case to make the evaluation in the two
courses more comparable. Moreover, tests should
follow to determine how long ToDo lists will actually
be during the semester and whether regular automatic
“cleaning” of the lists could be helpful.
The Mood function was seen more critical by
students in both courses. Although students in
principle liked the idea of reflecting team mood, they
suggested that mechanisms for conflict resolution
should be available in case that team mood turns out
to be bad. This is an interesting prospect for future
development, albeit challenging, as reasons for bad
team mood will probably be very diverse.
The OC students particularly preferred the
functions Participation and Deadline followed by
Availability. This reflects that in online courses
coordination is particularly challenging, as students
possibly don’t get to know each other face to face.
In general, the biggest challenge is to analyze
student participation correctly. Participation is likely
to be very different in different courses, didactical
settings and also between groups in the same course,
as they organize their teamwork differently. This is
also reflected in our data: The online students used
the tool much more often than students in the blended
learning course; they also generally used the LMS
much more often. Naturally, teamwork in blended
learning courses often takes place in personal face-to-
face contact, while online students often do not know
each other personally and do not necessarily live
close to each other. As many activities of BLC
students do not take place online, this might explain
why they took a more critical view of automatic
assessments of their participation in the system. In
contrast, online students lack opportunities to observe
their team members’ activities and thus benefit from
the system recognizing and tracking their
participation. With regard to appearance, a bar chart
was selected to reflect the relative participation in
order to ensure comparability with other studies in
studies running at the same time. In our experience, a
donut chart should be a better choice to reflect the
distribution of participation and could provide a better
understanding. Since the teamwork tool has a
modular structure more individualized visualizations
and analyses could possibly be implemented for both
OC and BLC learning scenarios.
Furthermore, students noted that they are at
different levels of expertise and have different speeds
in solving a task, for example. This also makes it
difficult to track the time spent on learning materials
and tasks as an indicator of activity, as it is done in
other tools and dashboards (Verbert et al., 2014,
Leitner and Ebner, 2017). In our tool we used word
counts in wiki and forum posts and also self-
assessments of offline / online activities, but defining
suitable metrics is still a challenge and will be subject
to further work, especially regarding the quality of
contributions.
Students indicated that more possibilities to
configure the tool individually would be desirable and
might improve user experience. Currently, only
teachers have the possibility to configure the tool for
their respective course. However, individualization of
groupware tools is difficult and may impair group
awareness (Janneck, 2009): e.g. if certain team
members decide to turn off the ToDo List, it is
practically useless for the rest of the team.
Nevertheless, we will explore possibilities for careful
or maybe group-based individualization to give
students more autonomy.
Generally, our results show that students are very
interested in seeing visualizations of their learning
behavior or learning outcomes. Logfile analysis
showed that the functions of the teamwork tools were
viewed in average 5.6 times per person on working
days. However, this data does not reflect how
students actually interacted with these functions.
Furthermore, the Moodle log file data was sometimes
hard to interpret: e.g., the function that was clicked
last during a login session, even when changing pages
within the same session, was reloaded and evaluated
as a view. This constitutes a limitation of our study.
Furthermore, since the teamwork tool only constitutes
a small part of the LMS, we cannot rule out that
experience with the whole learning environment was
also included in the assessment. So far, we have only
measured the experience with the tool, not the impact
on student learning outcomes.
Interaction with the tool has to be learned and
forming habits of use certainly plays a role in
evaluation and future use of the tool. This should
ideally be investigated in longitudinal studies
spanning different courses and semesters to observe
whether usage patterns change over time and whether
e.g. the use of external tools decreases.
6 CONCLUSION
This paper described the development and evaluation
A Teamwork Tool to Support Group Work in Online-based Higher Education: Exploring User Experience and the Use of Support
Mechanisms by Students
37

of a teamwork tool to support student’s teamwork in
online teaching environments. The teamwork tool
was designed based on psychological findings of
typical problems within teamwork, investigations
regarding visualization methods, appearance and
positioning in LMS and tested in two online and
blended learning courses by means of online surveys
(N = 34, N = 17), group discussions (N = 16) and log
file analysis (N = 50). Overall, the teamwork tool was
rated well in terms of usability, visual aesthetics and
overall impression. Nevertheless, certain areas for
improvement were identified. These might also serve
as general guidelines for designing learning analytics
tools for groups (see section 6.1). In general, the use
of the teamwork tool is suitable for small groups up
to 6 members. The use of the participation function
is recommended for courses in which wikis (for
editing a common document) and forums are heavily
used. Ideally, group forums and a group wiki should
be set up for the students to work on common tasks.
A solution for tracking participation in programming
tasks (e.g. in computer science courses) does not yet
exist. Further investigations regarding the
effectiveness of the tool use and its possible effect on
positive collaboration must follow. The development
of real-time performance reflection tools in an online
learning environment is becoming more and more
important, especially in pandemic times like
nowadays when online study programs are being
more and more attractive.
6.1 Design Recommendations
Use classic data and information visualizations
like bar and donut charts for visualising learning
analytic results.
Enable students to stay on the online learning
platform while viewing learning analytic results.
They appreciate if they do not have to leave the
online teaching environment.
Place learning analytic results that are important
for students prominent in the header of the online
teaching environment.
Students generally welcome visualizations of
learning behavior and activity and low-threshold
functions for task management (availability
functions could be connected to the calendar, so
that personal information can be compared with
entries in the calendar and the system can warn if
there is an overlapping appointment. ToDo lists
could be extended to a task planning tool through
the possibility of assigning ToDo’s to team
members and defining milestones).
Participation could be mirrored as a combined
rating of self-assessment, the average rating of
team members and system tracking.
Integrate possible extensions / connections to
external tools, which students like to use
(especially for the organisation of their team
work).
A non-human appearance / symbolic
representation of an automated tutor is preferred
by students. A human appearance of an automated
tutor is rather rejected.
Use prompts for reminders of appointments,
deadlines etc.
Integrate customizable approval opt-in process for
students’ data collection - Students generally
accept data analysis of their personal learning
behavior, if it is transparent.
ACKNOWLEDGEMENTS
This work was funded by the Federal Ministry of
Education and Research of the Federal Republic of
Germany (BMBF FKZ 16DHL1011).
REFERENCES
Abela, A. (2008). Advanced Presentations by Design:
Creating Communication That Drives Action (1st
editio). Pfeiffer.
Ali, L., Hatala, M., Gašević, D., & Jovanović, J. (2012). A
qualitative evaluation of evolution of a learning
analytics tool. Computers & Education, 58(1), 470–
489.https://doi.org/https://doi.org/10.1016/j.comped
u.2011.08.030
Appelt, W. (2004). Plattformen. In J. Haake, G. Schwabe,
& M. Wessner (Eds.), CSCL Kompendium.
Lehrbuch und Handbuch zum computerunterstützten
kooperativen Lernen (pp. 137–153). Oldenbourg
Wissenschaftsverlag GmbH.
Arnold, K. E., & Pistilli, M. D. (2012). Course Signals at
Purdue: Using Learning Analytics to Increase
Student Success. Proceedings of the 2nd
International Conference on Learning Analytics and
Knowledge, 267–270.
https://doi.org/10.1145/2330601.2330666
Behrisch, M., Blumenschein, M., Kim, N. W., Shao, L., El-
Assady, M., Fuchs, J., Seebacher, D., Diehl, A.,
Brandes, U., Pfister, H., Schreck, T., Weiskopf, D.,
& Keim, D. A. (2018). Quality Metrics for
Information Visualization. In Computer Graphics
Forum (Vol. 37, Issue 3, pp. 625–662). Blackwell
Publishing Ltd. https://doi.org/10.1111/cgf.13446
Bostock, M., Ogievetsky, V., & Heer, J. (2011). D
3
Data-
Driven Documents. IEEE Transactions on
WEBIST 2021 - 17th International Conference on Web Information Systems and Technologies
38

Visualization and Computer Graphics, 17(12),
2301–2309.
https://doi.org/10.1109/TVCG.2011.185
Brandenburger, J., Constapel, M., Hellbrück, H., &
Janneck, M. (2019). Analysis of Types, Positioning
and Appearance of Visualizations in Online
Teaching Environments to Improve Learning
Experiences. International Conference on Applied
Human Factors and Ergonomics, 355–366.
Brandenburger, J., & Janneck, M. (2018). Attraktivität von
Visualisierungsformen in Online-Lernumgebungen.
In N. K. T. Köhler, E. Schoop (Ed.), Gemeinschaften
in neuen Medien (pp. 249–260). TUD Press.
Brown, G. A., Bull, J., & Pendlebury, M. (2013). Assessing
Student Learning in Higher Education. Routledge.
Bull, S., & Kay, J. (2010). Open Learner Models. In R.
Nkambou, J. Bourdeau, & R. Mizoguchi (Eds.),
Advances in Intelligent Tutoring Systems (Vol. 308,
pp. 301–322). Springer, Berlin, Heidelberg.
https://doi.org/10.1007/978-3-642-14363-2_15
Carenini, G., Conati, C., Hoque, E., Steichen, B., Toker, D.,
& Enns, J. (2014). Highlighting Interventions and
User Differences : Informing Adaptive Information
Visualization Support. Proceedings of the SIGCHI
Conference on Human Factors in Computing
Systems, 1835–1844.
Constapel, M., Doberstein, D., Ulrich Hoppe, H., &
Hellbruck, H. (2019). IKARion: Enhancing a
learning platform with intelligent feedback to
improve team collaboration and interaction in small
groups. 2019 18th International Conference on
Information Technology Based Higher Education
and Training, ITHET 2019.
https://doi.org/10.1109/ITHET46829.2019.8937348
Dillenbourg, P. (1999). What do you mean by collaborative
learning ? In Pierre Dillenbourg (Ed.),
Collaborative-learning: Cognitive and
Computational Approaches (pp. 1–19). Elsevier.
Dillenbourg, P. (2002). Over-scripting CSCL: The risks of
blending collaborative learning with instructional
design. In P. A. Kirschner (Ed.), Three worlds of
CSCL. Can we support CSCL? (pp. 61–91). Heerlen,
Open Universiteit Nederland.
https://telearn.archives-ouvertes.fr/hal-00190230
Dourish, P., & Bellotti, V. (1992). Awareness and
Coordination in Shared Workspaces. Proceedings of
the 1992 ACM Conference on Computer-Supported
Cooperative Work, 107–114.
https://doi.org/10.1145/143457.143468
Fransen, J., Kirschner, P. A., & Erkens, G. (2011).
Mediating team effectiveness in the context of
collaborative learning: The importance of team and
task awareness. Computers in Human Behavior,
27(3), 1103–1113.
https://doi.org/https://doi.org/10.1016/j.chb.2010.05
.017
Garreta-Domingo, M., Sloep, P. B., Hérnandez-Leo, D., &
Mor, Y. (2018). Design for collective intelligence:
pop-up communities in MOOCs. AI
$\%%STRING%% SOCIETY, 33(1), 91–100.
https://doi.org/10.1007/s00146-017-0745-0
Govaerts, S., Verbert, K., Duval, E., & Pardo, A. (2012).
The student activity meter for awareness and self-
reflection. Conference on Human Factors in
Computing Systems - Proceedings, 869–884.
https://doi.org/10.1145/2212776.2212860
Grammel, L., Tory, M., & Storey, M. A. (2010). How
information visualization novices construct
visualizations. IEEE Transactions on Visualization
and Computer Graphics, 16(6), 943–952.
https://doi.org/10.1109/TVCG.2010.164
Hardman, F. C. (2008). Teachers’ use of feedback in whole-
class and group-based talk. In M. Neil & H. Steve
(Eds.), Exploring talk in schools (pp. 131–150). Sage
Publications Ltd.
Janneck, Michael, & Janneck, M. (2004). Gruppen und
Gruppenarbeit. In G. S. & M. W. Jörg Haake (Ed.),
CSCL Kompendium 2.0 (pp. 57–68). Oldenbourg
Wissenschaftsverlag GmbH.
Janneck, Monique. (2009). Designing for Social Awareness
of Cooperative Activities. Proceedings of the 5th
International Conference on Web Information
Systems, 463–470.
https://doi.org/10.5220/0001754204630470
Janssen, J., Erkens, G., & Kirschner, P. A. (2011). Group
awareness tools: It’s what you do with it that matters.
Computers in Human Behavior, 27(3), 1046–1058.
https://doi.org/https://doi.org/10.1016/j.chb.2010.06
.002
Krämer, N., Rummel, N., Hoppe, H. U., & Janneck, M.
(2017). Intelligente Unterstützung von
Kleingruppenarbeit in der online-gestützten
Hochschullehre. In e-teaching.org. https://www.e-
teaching.org/etresources/pdf/erfahrungsbericht_201
7_kaemer_et_al_intelligente_unterstuetzung_von_k
leingruppenarbeit_in_der_online_gestuetzten_hochs
chullehre.pdf
Lee, S., Kim, S. H., & Kwon, B. C. (2017). VLAT:
Development of a Visualization Literacy
Assessment Test. IEEE Transactions on
Visualization and Computer Graphics, 23(1), 551–
560. https://doi.org/10.1109/TVCG.2016.2598920
Leitner, P., & Ebner, M. (2017). Learning Analytics in
Hochschulen. In Handbuch Kompetenzentwicklung
im Netz. Bausteine einer neuen Lernwelt. (pp. 371–
384). Schäffer-Poeschel Verlag.
https://doi.org/10.34156/9783791037943-371
Lengler, R., & Eppler, M. J. (2007). Towards A Periodic
Table of Visualization Methods for Management.
IASTED Proceedings of the Conference on Graphics
and Visualization in Engineering (GVE 2007).
Leony, D., Pardo, A., de la Fuente Valentín, L., Castro, D.
S. De, & Kloos, C. D. (2012). GLASS: A Learning
Analytics Visualization Tool. Proceedings of the 2nd
International Conference on Learning Analytics and
Knowledge, 162–163.
https://doi.org/10.1145/2330601.2330642
Martinez-Maldonado, R., Pardo, A., Mirriahi, N., Yacef,
K., Kay, J., & Clayphan, A. (2015). LATUX: An
Iterative Workflow for Designing, Validating, and
A Teamwork Tool to Support Group Work in Online-based Higher Education: Exploring User Experience and the Use of Support
Mechanisms by Students
39

Deploying Learning Analytics Visualizations.
Journal of Learning Analytics, 2(3), 9–39.
Minge, M. (2018). Nutzererleben messen mit dem meCUE
2.0 – Ein Tool für alle Fälle? In R. Dachselt & G.
Weber (Eds.), Mensch und Computer 2018 -
Workshopband. Gesellschaft für Informatik e.V.
https://doi.org/10.18420/muc2018-ws16-0485
Minge, M., & Riedel, L. (2013). meCUE – Ein modularer
Fragebogen zur Erfassung des Nutzungserlebens. In
R. Boll, Susanne AND Maaß, Susanne AND Malaka
(Ed.), Mensch & Computer 2013: Interaktive
Vielfalt. Oldenbourg Verlag.
Minge, M., & Thüring, M. (2018). The MeCUE
Questionnaire (2.0): Meeting Five Basic
Requirements for Lean and Standardized UX
Assessment. In A. Marcus & W. Wang (Eds.),
Design, User Experience, and Usability: Theory and
Practice (pp. 451–469). Springer International
Publishing.
Ottley, A., Crouser, R. J., & Ziemkiewicz, C. (2015).
Manipulating and controlling for personality effects
on visualization tasks. Information Visualization,
14(3), 223–233.
https://doi.org/10.1177/1473871613513227
Saati, B., Salem, M., & Brinkman, W.-P. (2005). Towards
customized user interface skins: investigating user
personality and skin colour. Proceedings of HCI, 2,
89–93.
Salas, E., Sims, D., & Burke, S. (2005). Is there a “Big
Five” in Teamwork? Small Group Research, 36(5),
555–599.
https://doi.org/10.1177/1046496405277134
Santos, J. L., Verbert, K., & Duval, E. (2012). Empowering
students to reflect on their activity with StepUp!:
Two case studies with engineering students.
ARTEL@ EC-TEL, 73–86.
Scheu, O., & Zinn, C. (2007). How did the e-learning
session go? The Student Inspector. 13th
International Conference on Artificial Intelligence
and Education (AIED 2007).
Siemens, G., Gasevic, D., Haythornthwaite, C., Dawson, S.,
Shum, S. B., Ferguson, R., Duval, E., Verbert, K., &
Baker, R. S. J. D. (2011). Open Learning Analytics:
an integrated & modularized platform.
Silverman, S., Tyson, L., & Krampitz, J. (1992). Teacher
feedback and achievement in physical education:
Interaction with student practice. Teaching and
Teacher Education, 8(4), 333–344.
https://doi.org/https://doi.org/10.1016/0742-
051X(92)90060-G
Soller, A., Martinez, A., Jermann, P., & Muehlenbrock, M.
(2005). From Mirroring to Guiding : A Review of
State of the Art Technology for Supporting
Collaborative Learning. International Journal of
Artificial Intelligence in Education (IJAIED), 15(4),
261–290.
Strauß, S., & Rummel, N. (2020). Promoting interaction in
online distance education: designing, implementing and
supporting collaborative learning. Information and
Learning Sciences, 121, 251–260.
https://doi.org/10.1108/ILS-04-2020-0090
Strauß, S., Rummel, N., Stoyanova, F., & Krämer, N.
(2018). Developing a Library of Typical Problems
During Collaborative Learning in Online Courses. In R.
Kay, J. and Luckin (Ed.), Rethinking Learning in the
Digital Age: Making the Learning Sciences Count, 13th
International Conference of the Learning Sciences
(ICLS) 2018 (Vol. 2, Issue 2007, pp. 1045–1048).
International Society of the Learning Sciences, Inc.
[ISLS]. https://repository.isls.org//handle/1/554
Toker, D., Conati, C., Carenini, G., & Haraty, M. (2012).
Towards Adaptive Information Visualization: On the
Influence of User Characteristics. Proceedings of the
20th International Conference on User Modeling,
Adaptation, and Personalization, 274–285.
https://doi.org/10.1007/978-3-642-31454-4_23
Upton, K., & Kay, J. (2009). Narcissus: Group and
Individual Models to Support Small Group Work. In
G.-J. Houben, G. McCalla, F. Pianesi, & M. Zancanaro
(Eds.), User Modeling, Adaptation, and
Personalization (pp. 54–65). Springer Berlin
Heidelberg.
Vaughan, T. (2006). Multimedia: Making It Work. In Tata
McGraw-Hill Education.
Verbert, K., Govaerts, S., Duval, E., Santos Odriozola, J.
L., Van Assche, F., Parra Chico, G. A., & Klerkx, J.
(2014). Learning dashboards: an overview and future
research opportunities. Personal and Ubiquitous
Computing, 18(6), 1499–1514.
Zelazny, G. (2001). Say It With Charts: The Executives‘s
Guide to Visual Communication (4th ed). McGraw-
Hill.
Ziemkiewicz, C., Ottley, A., Crouser, R. J., Chauncey, K.,
Su, S. L., & Chang, R. (2012). Understanding
Visualization by Understanding Individual Users. IEEE
Computer Graphics and Applications, 32(6), 88–94.
https://doi.org/10.1109/MCG.2012.120
Ziemkiewicz, C., Ottley, A., Crouser, R., Yauilla, A., Su,
S., Ribarsky, W., & Chang, R. (2012). How
Visualization Layout Relates to Locus of Control and
Other Personality Factors. IEEE Transactions on
Visualization and Computer Graphics, 19(7), 1109–
1121. https://doi.org/10.1109/TVCG.2012.180
WEBIST 2021 - 17th International Conference on Web Information Systems and Technologies
40
