
Opinion and Sentiment Analysis of Twitter Users during the 2021
Ecuador Presidential Election
Jorge Parraga-Alava
1 a
, Jorge Rodas-Silva
2 b
, Iv
´
an Quimi
1
and Roberth Alcivar-Cevallos
1 c
1
Facultad de Ciencias Inform
´
aticas, Universidad T
´
ecnica de Manab
´
ı, Avenida Jos
´
e Mar
´
ıa Urbina, Portoviejo, Ecuador
2
Facultad de Ciencias e Ingenier
´
ıa, Universidad Estatal de Milagro, Cdla. Universitaria Km 1 1/2 v
´
ıa Km 26, Milagro,
Ecuador
Keywords:
Ecuador, Presidential Election, Opinion Analysis, Sentiment Analysis.
Abstract:
Social media data have been used for opinion and sentiment analysis and seem to have the potential to reflect
the political picture of many territories. This paper analyzes the opinions and sentiments of users about the
organization and candidates of the 2021 Ecuadorian presidential election to determine whether these can be
considered as a relevant factor to predict election outcomes in this country. We used a social media analytics
methodology with four phases: first two correspond to data acquisition and pre-processing, where Twitter
search API was used for fetching election-related tweets that were taken and converted into a structured for-
mat; in the third phase, an opinion analysis was performed to offer statistics about the number of tweets and
users, hashtags, mentions and, word clouds. In the fourth phase, we verified the emotional attitude of the users
regarding the presidential candidates by using sentiment analysis. The results showed that most of the users’
opinions reflected positive sentiment about presidential candidate Arauz in the first round. On the other hand,
in the second round, presidential candidate Lasso, concerning the first round, captured a more significant pos-
itive response from Twitter users, who achieved a closed result over candidate Arauz. Finally, it is concluded
that there is a correspondence between positive sentiments expressed in the tweets and the total votes obtained
by candidates.
1 INTRODUCTION
Ecuador is a country located in South America with a
population of approximately 17 million people. Pres-
idential elections in Ecuador are held every four years
since the country returned to a democracy in 1979.
Elections are mandatory for all Ecuadorian citizens
older than eighteen years old. It consists of two
rounds that are held in dates selected by Consejo Na-
cional Electoral, CNE (the state institution responsi-
ble for holding elections in the country). If any can-
didate is able to obtain more than 40 % of votes (af-
ter the count to remove invalid ballots) and if he or
she has at least 10 % over the second place is de-
clared President in the first round. Otherwise, the two
with highest ballots go for a second round of popular
elections, where the one who gets more than 50 % of
the ballots is declared President of the nation [Rofr
´
ıo
et al., 2019].
a
https://orcid.org/0000-0001-8558-9122
b
https://orcid.org/0000-0001-6526-7740
c
https://orcid.org/0000-0001-6282-8493
Despite of the coronavirus pandemic, the 2021
Ecuador Presidential Election took place in February
7th, and the second round in April 11. During the
first round, legislative elections were held in which
representatives to the Andean Parliament and Assem-
blymen were elected for the same period. In the first
round, 16 binomial candidates were registered. Af-
ter the first round, no candidate obtained the required
votes to win the elections. Therefore a second round
of elections was held in April 11, where Guillermo
Lasso was elected President of Ecuador and the run-
ner up was Andr
´
es Arauz, with 52.36 % and 47.64 %
of the votes, respectively
1
.
Social media have become an essential part of the
routine of the people, since they allow users to express
opinions as well as their happiness, anger, sadness, or
any other emotion easily. Such presence in people’s
lives is so great that they have been used to influence
elections in at least 18 countries, according to a report
by the democracy advocacy group Freedom House
2
.
1
shorturl.at/hBGT8
2
shorturl.at/ijmuD
Parraga-Alava, J., Rodas-Silva, J., Quimi, I. and Alcivar-Cevallos, R.
Opinion and Sentiment Analysis of Twitter Users during the 2021 Ecuador Presidential Election.
DOI: 10.5220/0010651000003058
In Proceedings of the 17th International Conference on Web Information Systems and Technologies (WEBIST 2021), pages 257-266
ISBN: 978-989-758-536-4; ISSN: 2184-3252
Copyright
c
2021 by SCITEPRESS – Science and Technology Publications, Lda. All rights reserved
257

In Ecuador, eight out of ten people use social me-
dia on a daily basis. Of these, 1 million are users of
the social media called Twitter. Although, the num-
ber of Twitter users compared to the total population
of Ecuador is very small (about 6 % of the popula-
tion) [Del-Alc
´
azar, 2021], this social media has the
presence of very active users and mainly politically
related actors such as the politicians, public officials,
candidates as well as news media. These actors en-
gage on the social platform as part of their political
campaigns or utilize it as a means of political deliber-
ation, advocacy and platform to exercise freedom of
speech [Parmelee, 2014].
Twitter data have been used by several studies re-
lated to political topics or general elections process in
many countries. These can be categorized as predic-
tion based and sentiment analysis based.
Works of [Singh et al., 2020, Sharma and Moh,
2016, Liu et al., 2021, Gaurav et al., 2013, Kristiyanti
et al., 2019, Wang and Gan, 2019] conducted stud-
ies to predict the outcome of elections process in
countries such as India, U.S., Venezuela, Paraguay,
Ecuador, Venezuela, Indonesia and France. These
studies use methods such as Support Vector Machine
(SVM), Naive Bayes, among others, with which they
reach prediction rates of between 74 %-90 % to es-
tablish seats in assembly, constituencies as well as
presidential winner. Despite these good results, the
limited number of tweets used in the experiments and
the particularity of each presidential election makes
that none of the work be yet able to provide a generic
method to predict the outcome of any election around
the world based upon the Twitter data.
The works of [Barnaghi et al., 2016, Gustisa
Wisnu et al., 2020, Sharma and Ghose, 2020, Jhawar
et al., 2020, Agarwal. and Bansal., 2020] performed
sentiment analysis to identify political preferences
over social media platforms. In this sense, all studies
focused on to obtain the opinion polarity of the folks
concerning general elections in diverse countries and
territories. They compare the sentiments of the users
for each of the candidates in analysis, and conclude
that, the opinion of the users is positive for the ma-
jority of candidates in comparison and furthermore,
they demonstrated that popularity in Twitter seems
to match with the election results. Also, the works
of [Troussas et al., 2016,Krouska et al., 2017,Parraga-
Alava et al., 2019] compared and evaluated classifi-
cation algorithms for the sentiment analysis problem
using data from social networks. In both cases it is
evidenced the usefulness of the machine learning al-
gorithms for sentiment analysis services.
As observed in the previously mentioned works,
the topic of political opinions in Twitter is relevant
and has received substantial attention, especially for
sentiment analysis. In this sense, researchers focus
on finding opinions and recognizing the sentiments
expressed towards the general elections, politicians,
or public figures. In this paper, we analyze the opin-
ions and users sentiments from Twitter data focused
on the 2021 Ecuador Presidential Election. Our goal
is to have useful insights of the main opinions of users
about the organization of the 2021 Ecuadorian elec-
tion as well as to identify sentiments expressed by
users towards candidates and, to determine whether
these can be considered as a relevant factor to predict
election outcomes in Ecuador. The latter is relevant
because it can serve as a baseline towards the genera-
tion of a generic method to predict the results of any
election based upon the Twitter data. In this sense,
our research questions (RQs) are the following:
RQ 1: What are the main opinions expressed by
Twitter users around 2021 Ecuadorian General Elec-
tion?
RQ 2: What is the positive sentiment expressed by
Twitter users about the presidential candidates in the
Ecuadorian general elections of 2021?
RQ 3: Is there a correlation between the sentiment
expressed by the users in the tweets and the vote per-
centage obtained by the candidates?
The paper is organized as follows: starting with
an introduction about elections and Twitter as well as
related works. Section 2 offers a description of data,
techniques and software used by our analysis. The
section 3 presents the experimental results and dis-
cussion. The conclusions are given in the last section.
2 METHODS
The aim of this paper is to have useful insights of the
main opinions of users about the organization of the
2021 Ecuador Presidential Election as well as to iden-
tify sentiments expressed by user towards the candi-
dates. To accomplish this task, we follow the method-
ology as given in Figure 1.
2.1 Data Collection
We used posts on Twitter collected during February 7,
2021 (first round) and April 11, 2021 (second round).
This period encompassed the 2021 Ecuador Presiden-
tial Election. The data were collected using the Twit-
ter API search along with rtweet R package [Kearney,
2019] and amounted to 288k tweets approximately.
The tweets acquired correspond to posts that included
the official hashtag promoted by the Consejo Na-
cional Electoral (CNE), that is, #Elecciones2021Ec
WEBIST 2021 - 17th International Conference on Web Information Systems and Technologies
258

01 02 03 04
DATA COLLECTION PREPROCESSING OPINION ANALYSIS SENTIMENT ANALYSIS
Twitter search API
General:
#Elecciones2021Ec #SegundaVueltaEc
Candidates:
Keywords by candidate (Table 1)
Tokenization
Stop Words
Twitter symbols
Tweets Statistics
# Analysis
@ Analysis
Word Clouds
Geolocation Analysis
# of positive and negative
tweets.
# of positive and negative
Twitter impressions.
Sentiment analysis report.
Figure 1: Pipeline of out opinion and sentiment analysis of 2021 Ecuador Presidential Election.
and #SegundaVueltaEc, for first and second round, re-
spectively. For the presidential election candidates,
we select either of the four presidential candidates
with greater intention of the vote according to polls
3
.
Table 1 shows the keywords and official Twitter
profiles used to filter the candidates-related tweets.
2.2 Preprocessing
We preprocess the data to convert text from human
language into computer-readable format for analitycs
use. We performed the following steps for all the
tweets: tokenization, removing stop-words and Twit-
ter symbols. In tokenization process, a string is split-
ting up into a list of tokens and constructing a bag-of-
words. Thereby, each token was used and if it was any
stop word or punctuation symbol it was removed. As
in Twitter there are some symbols which may be used
in tweets and they can introduce meaningless noise,
the URLs, “RTs”, character representing strip white
space and emojis are removed. We keep emojis out
from the analysis because the number of tweets with
emojis in our dataset was small (only 5 % and mostly
the ballot box with ballot emoji). We used the tidy-
verse [Wickham et al., 2019] and tm [Feinerer et al.,
2008] R packages for this stage. In the end, this pre-
processing converts the tweets into a dataset where
each row contains status id, user id, created at, screen
name, text, place name and country related to a Twit-
ter post. These features will be used to carry out the
analysis of opinions and sentiments.
2.3 Opinions Analysis
To extract opinions from a posts in Twitter, we ap-
plied two social media analytics techniques, namely
3
shorturl.at/lvDIN
descriptive analysis and geospatial analysis. The
descriptive analysis gives descriptive statistics about
number of tweets, number of tweet users, hashtags,
mentions and word clouds [Singh et al., 2020]. The
geospatial analysis deals with the study the topics
spread by the user throughout geographic areas [Ban-
thia et al., 2020]. We used the tidyverse [Wickham
et al., 2019] and wordcloud
4
R packages to carry out
both descriptive and geospatial analysis, respectively.
2.4 Sentiment Analysis
We performed an analysis process based on the sen-
timents got from posts on Twitter related to the pres-
idential candidates. We quantified these sentiments
using polarity. Polarity analysis is used to determine
the emotional attitude of a text writer with respect to
the topic under discussion [Li and Wu, 2010]. With
it, the text of a tweet can be classified as negative,
positive or neutral. It assigns scores range from -1 to
1, where -1 represents extremely negative sentiment
while 1 represents extremely positive sentiment, re-
spectively. A polarity score of 0 suggests a neutral
sentiment [Yaqub et al., 2020].
We quantify the sentiments of Twitter users us-
ing their polarity towards each of the candidates. In
first round, we focus solely on the presidential can-
didates and we classified tweets as Arauz-related,
Lasso-related, P
´
erez-related or Hervas-related. We
leave out the tweets which mention more than two
candidates because of the potential ambiguity as to
which candidate the sentiment of the tweet is about.
In second round, we only consider the two finalist
candidates.
We used the Phyton library Tweepy
5
for perform a
4
shorturl.at/mIRX4
5
shorturl.at/kpEPZ
Opinion and Sentiment Analysis of Twitter Users during the 2021 Ecuador Presidential Election
259

Table 1: Keywords for filtering the tweets by presidential candidates.
Candidate Twitter profile Keyword
Andr
´
es Arauz @ecuarauz
arauz, #ArauzPresidente2021
#ArauzPresidente, #EcuadorConArauz
Guillermo Lasso @LassoGuillermo
lasso, #LassoPresidente2021
#LassoPresidente, #EcuadorConLasso
Yaku P
´
erez @yakuperezg
yaku, #EcuadorConYaku
#YakuPresidente, #YakuPresidente2021
Xavier Hervas @xhervas
hervas, #EcuadorConHervas
#HervasPresidente, #HervasPresidente2021
sentiment analysis and plot the result. The text analy-
sis to identify, extract and display subjective informa-
tion about the presidential candidates (good, bad, ex-
cellent, lousy), was performed through the TextBlob
6
and Matplotlib
7
libraries, also included in Phyton.
With the application of these libraries on the infor-
mation extracted from Twitter, an approximation of
the emotional evaluation that voters had of the presi-
dential candidates in the last elections held in Ecuador
was achieved.
3 RESULTS AND DISCUSSION
3.1 Opinions Analysis
To answer the RQ 1, we performed a descriptive
analysis and a geospatial analysis. In the first one,
we included tweet statistics about number of tweets
and number of tweet users that they posted during
the elections, hashtags and mentions analysis as well
as word clouds of the opinions of the user. In the
last one, we identified from which province of the
Ecuadorian territory the tweets with mentions of each
candidate and process in general were posted.
3.1.1 Tweet Statistics
The detailed results of tweet statistics are shown in
Table 2.
Here, among 84955 tweets, 68150 (80.21 %)
tweets were in first round and 16805 (19.79 %) in
second round, related to main opinions of the election
(#Elecciones2021Ec and #SegundaVueltaEc). These
post were generated by a total of 34983 unique users,
distributed in 28039 (80.15 %) and 6944 (19.85 %),
for first and second round, respectively.
When the tweets with mentions of candidates are
analyzed, it is observed that a total of 203056 were
obtained from Twitter. They are distributed as fol-
6
shorturl.at/pELY2
7
shorturl.at/gqrCJ
lows: 88589 (43.62 %), 99754 (49.12 %), 7562 (3.73
%), 7151 (3.53 %) for Andr
´
es Arauz, Guillermo
Lasso, Yaku P
´
erez and Xavier Hervas, respectively.
These post were generated by a total of 95316 unique
users, distributed in 43843 (45.99 %), 45212 (47.43
%), 2541 (2.66 %) and 3720 (3.92 %), for Andr
´
es
Arauz, Guillermo Lasso, Yaku P
´
erez and Xavier Her-
vas, respectively.
Our tweets statistics analysis showed that more
tweets were generated with mentions of the presiden-
tial candidates than the process in general. In this
sense, to refer to the main opinions of the election pro-
cess, each user posted an average of 3 tweets. While
each user who mentions to Arauz, Lasso, P
´
erez and
Hervas posted an average of 2, 3, 3, and 2 tweets,
respectively. Regarding the finalist candidates, it is
observed that, Andr
´
es Arauz had a decrease of almost
12 % of mentions in the second round. In contrast,
Guillermo lasso was who had a significant increase in
mentions in tweets, going from 28950 tweets in first
round to 70804 tweets in the second round, which rep-
resents an increase of 59.11 %.
3.1.2 Hashtag Analysis
A total of 788 hashtags were identified in 84955
tweets in approximately 80 % (68150) of tweets for
first round and 20 % (16805) for second round related
to opinions of user about general process. The top 15
hashtags that had maximum occurrences in tweets in
two rounds are shown in Figure 2.
The Figure 2A highlights the hashtags #VotaSe-
guro, #YoMeCuido, #JuntosContraElCovid19 and
#NoBajemosLaGuardia directly related to user tips,
suggestions and complaints on aspects related to pol-
icy on conducting elections in the context of the
Covid-19 pandemic. In Figure 2B, however, these
topics decreased and only the hashtag #VotaSeguro
remained, and other hashtags related to the election
process and presidential candidates (#LassoYaNos-
Goberno, #LassoPresidente2021) stand out.
Our hashtag analysis evidenced that #EcuadorDe-
cide2021 and #LassoPresidente2021 were the most
WEBIST 2021 - 17th International Conference on Web Information Systems and Technologies
260
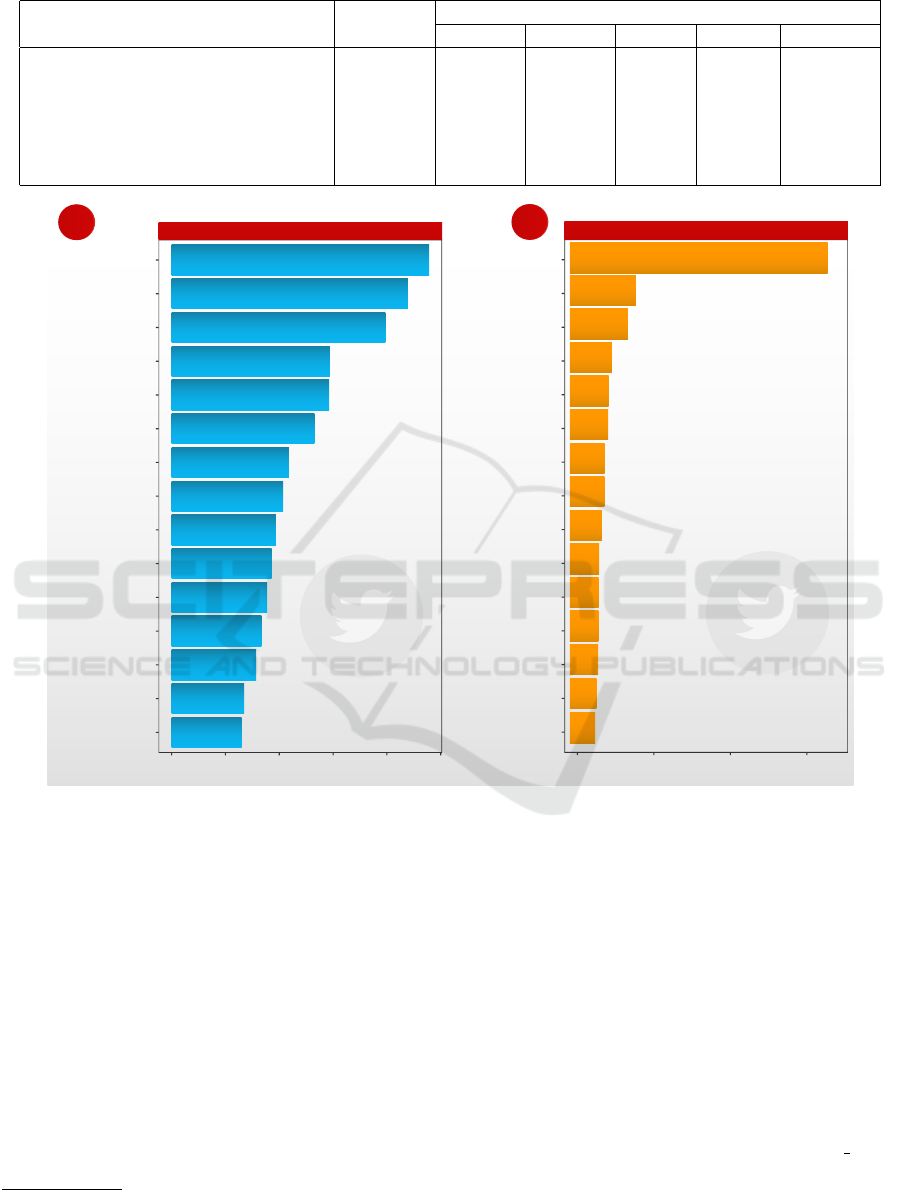
Table 2: Tweet statistics of data used in the analysis.
Statistics General
Presidential candidate
Arauz Lasso P
´
erez Hervas Total
Total Tweets 100.00 % 43.62 % 49.12 % 3.73 % 3.53 % 100.00 %
- Total Tweets (first round) 80.21 % 53.23 % 31.01 % 8.10 % 7.66 % 100.00 %
- Total Tweets (second round) 19.79 % 35.45 % 64.55 % - - 100.00 %
Total Unique Users 100.00 % 45.99 % 47.43 % 2.66 % 3.92 % 100.00 %
- Total Unique Users (first round) 80.15 % 54.04 % 30.47 % 6.28 % 9.20 % 100.00 %
- Total Unique Users (second round) 19.85 % 40.07 % 59.93 % - - 100.00 %
2392
2194
1986
1469
1462
1326
1089
1037
968
928
887
835
786
673
650
First Round
0 500 1000 1500 2000 2500
#ECU911
#LassoPresidente2021
#DENUNCIA
#JuntosContraElCovid19
#sorrynotsorry
#NoBajemosLaGuardia
#EcuadorDecide
#Quito
#Manabi
#YoMeCuido
#ATENCION
#LassoYaNosGoberno
#Guayaquil
#VotaSeguro
#EcuadorDecide2021
A
1683
430
378
273
253
249
227
225
208
191
187
185
184
173
164
Second Round
0 500 1000 1500
#LassoPresidente2021
#EcuadorDecide
#Quito
#ATENCION
#Guayaquil
#VotaSeguro
#EcuadorDecide2021
#LassoPresidente
#CNE
#EleccionesBicentenario
#GuillermoLasso
#ZapatosRojos
#Arauz
#Lasso
#EleccionesGenerales2021
B
Figure 2: Top 15 hashtags with maximum occurrence related to general perception of 2021 Ecuador Presidential Election.
popular hashtags with a total of 2072 and 1377 tweets,
respectively, when we focus on the general perception
of users about the the elections. The presence in the
first place of #LassoPresidente2021 in the global data
can be explained by the election of Guillermo Lasso
as president of Ecuador for the period 2021-2025
8
.
3.1.3 Mention Analysis
A total of 35066 mentions were present in the second
round, out of which 13145 were for Andr
´
es Arauz y
21921 for Guillermo Lasso. The top 10 mentions that
had maximum occurrences in the second round are
shown in Figure 3. In the case of the @ecuarauz,
the mentions (Figure 3A) are led by @UdlaChann-
8
shorturl.at/pyGUW
elEc who made a large number of publications related
to news about the electoral process, especially about
the counting of votes around the country in its dif-
ferent provinces. The user @uscocovich1972, who
occupies the second place, and these tweets offer in-
formation about the candidate Andres Arauz, debat-
ing his background and political party. The tweets are
informational only and do not appear to bias towards
any of the finalist candidates. Users who mention the
candidate Andr
´
es Arauz, generally also mention the
@MashiRafael, which is the account of the former
president Rafael Correa.
For the candidate Guillermo Lasso (Figure 3B),
the mentions are led by the account @codes
r who
presents strong support for the candidate, although
most of his posts are repetitions of the phrase “Sin
Opinion and Sentiment Analysis of Twitter Users during the 2021 Ecuador Presidential Election
261
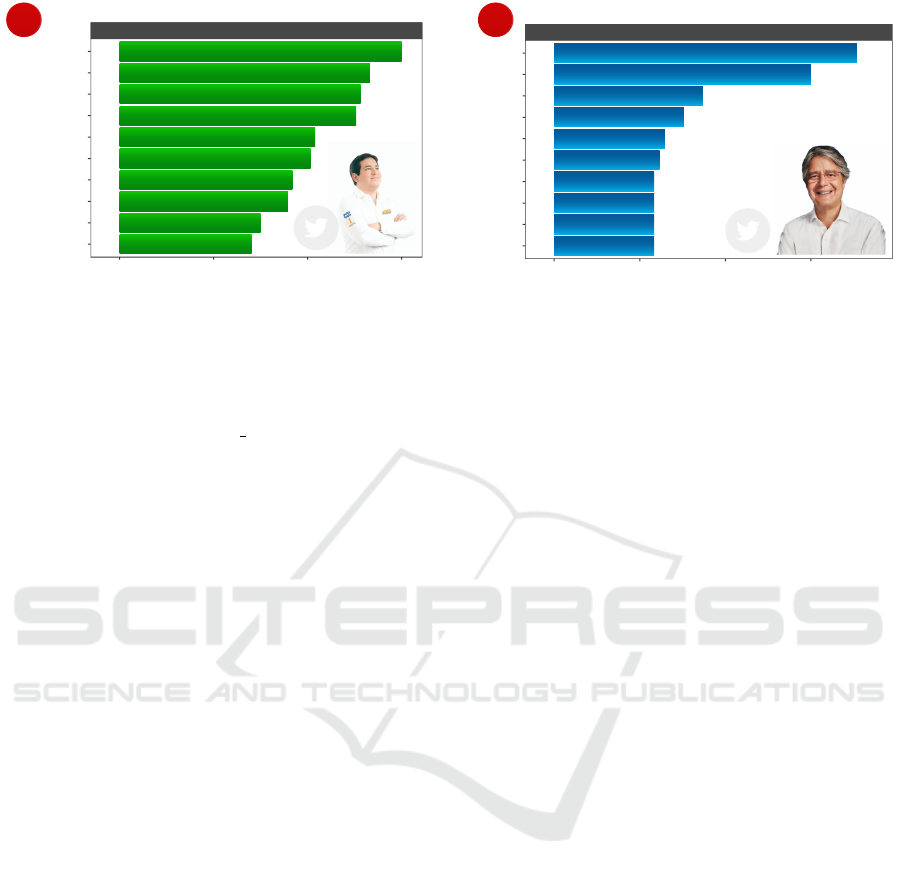
62
55
53
52
43
42
38
37
31
29
112
95
55
48
41
39
37
37
37
37
@LassoGuillermo
@ecuarauz
@FEscrutinio
@Datoworld
@EduardBernstei1
@01Rome
@CanalRTU
@SebastianChawpi
@briannjavierc01
@higuerahernan
@uscocovich1972
@UdlaChannelEc
@anibalvv1982
@antibanqueroshp
@gardfieldking
@titireyesm
@JarabaWilson
@magusreyes
@mbtello
@joselo681513
@roger_gonzalezg
@codes_r
0 20 40 60
0 30 60 90
A
B
Figure 3: Top 10 mentions with maximum occurrence related to candidates of the second round of 2021 Ecuador Presidential
Election.
confiarnos vamos con fuerza hasta el triunfo debemos
cuidar los votos la victoria est
´
a cercana Lasso Pres-
idente”. The second profile that mentions @Guiller-
moLasso the most is @roger gonzalezg with tweets
related to the hope of a prosperous country and want-
ing to change. Users who mention the candidate
Guillermo Lasso, generally also mention the @Cre-
oEcuador and @La6Ecuador, which are the accounts
of the candidate’s allied political parties.
Our mentions analysis evidenced that Andr
´
es
Arauz has great support from users, although most of
them are related to the party behind this candidate.
The mentions of Guilermo Lasso were related to the
hope of change to have a government that helps solve
corruption, crime and the economic crisis caused by
the pandemic. It was also evidenced that Arauz’s
detractors directly related him to former Ecuadorian
president Rafael Correa and to being his continuity,
while Guillermo Lasso’s detractors pointed to him as
responsible for the economic crisis in Ecuador in the
decade of the 90 when he was Minister of Economy.
3.1.4 Word Clouds
In Figure 4 and Figure 5 we show words with the
highest frequencies in tweets where users express
their opinions about general electoral process during
the first and second round, respectively. Here, larger
the word more is its frequency in the given text.
Figure 4 shows words with minimum frequency
of 1214. In this sense, 100 words were selected with
word “ecuador” having maximum frequency of 16523
followed by word “arauz” with frequency of 10823.
Figure 5 shows words with minimum frequency
of 24. In this sense, 100 words were selected with
word “electoral” having maximum frequency of 304
followed by word “ecuador” with frequency of 275.
Our word clouds evidenced that the most frequent
words of the first electoral round referred to the vot-
arauz
voto
electoral
resultados
lasso
votar
andres
electorales
cne
votacion
derecho
recintos
pais
vuelta
eleccionesecuador
proceso
guillermo
candidato
yaku
jornada
ecuadordecide
bioseguridad
guayaquil
ciudadania
gente
segunda
correa
atencion
denuncia
manabi
ecuatorianos
votaseguro
perez
medidas
democracia
hacer
estan
ahora
ejercer
papeletas
votos
nacional
junto
oficiales
hervas
filas
recinto
correismo
ciudadanos
lugar
presidencial
centros
quito
exit
personas
presidente
pueblo
colegio
poll
voluntad
dia
urnas
actas
fila
conteo
mientras
anos
seguridad
libertad
transparencia
presidenciales
popular
sectores
lassoyanosgoberno
cuenta
elegir
estrategia
populares
sistema
social
futuro
mundo
yomecuido
juntas
participacion
delegados
atentos
puntos
domingo
viendo
mascarilla
patria
derecha
primer
febrero
rapido
mediante
datos
sufragar
manana
mucha
preferencia
centro
preliminares
elegido
esperanza
cumpli
expresar
seguido
diferencia
democrata
muestra
defiende
ecuatoriano
debida
mesa
van
honre
votantes
fraude
parte
momento
via
autoridades
largas
gobierno
puede
guayas
evidenciar
aqui
receptoras
representantes
primera
venezuela
vote
presidenta
bien
sucediendo
gano
denunciamos
retardar
mesas
aglomeraciones
ciudadana
papeleta
amigos
segun
joven
electores
ecuador
Figure 4: Word cloud of frequent words in posts about gen-
eral perception during first round of the 2021 Ecuador Pres-
idential Election.
jor
lasso
arauz
voto
ahora
andres
guillermo
actas
proceso
electorales
resultados
recintos
cne
eleccionesgenerales
escrutinio
provincial
votos
desarrollo
junta
votacion
derecho
nacional
provincia
seguridad
procesadas
normalidad
presidente
inauguracion
hrs
bioseguridad
quito
pais
lassopresidente
ciudadania
oficiales
eleccionesecuador
autoridades
vuelta
sesion
sufragio
juntas
medidas
abril
receptoras
detalles
permanente
presidenta
democracia
recinto
segunda
traves
votar
ecuatorianos
presencia
urnas
centro
electores
director
ecuasondeos
cneinforma
desarrolla
datos
mesa
acto
candidato
ejercer
guayaquil
ciudadanos
delegados
ecuadordecide
educativa
personas
unidad
vicepresidente
estan
junto
atencion
mision
participacion
total
corte
dia
habilitados
republica
sufragar
colegio
instituciones
transmision
canton
delegacion
diferentes
domingo
medios
procesamiento
politicas
vivo
preliminares
via
electoral
ecuador
nada
Figure 5: Word cloud of frequent words in posts about gen-
eral perception during second round of the 2021 Ecuador
Presidential Election.
ing, the objective of the presidency, requests for le-
gal suffrage, biosafety measures and official results,
as well as the mentions of each candidate. Mean-
while for second electoral round The word cloud of
the second round similar to what happens in the first
electoral round with respect to electoral journey but
topics such as transparent process, scrutiny and offi-
WEBIST 2021 - 17th International Conference on Web Information Systems and Technologies
262
0
25
50
75
100
0
25
50
75
100
@GuillermoLasso
First
Round
Second
Round
User posts (%)
User posts (%)
7.3
0.3
0.3
1.4
2.8
3.1
34.6
0.3
2.4
0.3
3.5
1
0.3
36.7
0.3
0.7
3.1
6.5
0.2
0.6
0.2
1
0.5
2.7
1.2
42.9
1
2.1
1.8
5.8
0.3
0.1
0.3
0.2
29
1
1.1
0.1
1.3
0.1
5
0.3
0.3
2
0.3
3.3
0.7
36.7
1
1.7
0.3
4.7
0.3
0.3
39
1.7
0.7
0.3
1.3
0
25
50
75
100
6.6
0.3
1.4
0.5
1.4
0.3
2.4
1.2
37.5
1.8
1.4
1.7
7.4
0.2
0.1
0.1
32.2
0.6
0.5
0.3
1.9
0
25
50
75
100
@ecuarauz
First
Round
Second
Round
User posts (%)
User posts (%)
Figure 6: Percentages of tweets for finalist candidates in provinces of Ecuador in the 2021 Ecuador Presidential Election.
cial results as well as the mention of the finalist can-
didates are added. Note that the frequency of words
in the second round decreased significantly and this is
due to the fact that in the second round users focused
more on the candidates than on the electoral process
itself.
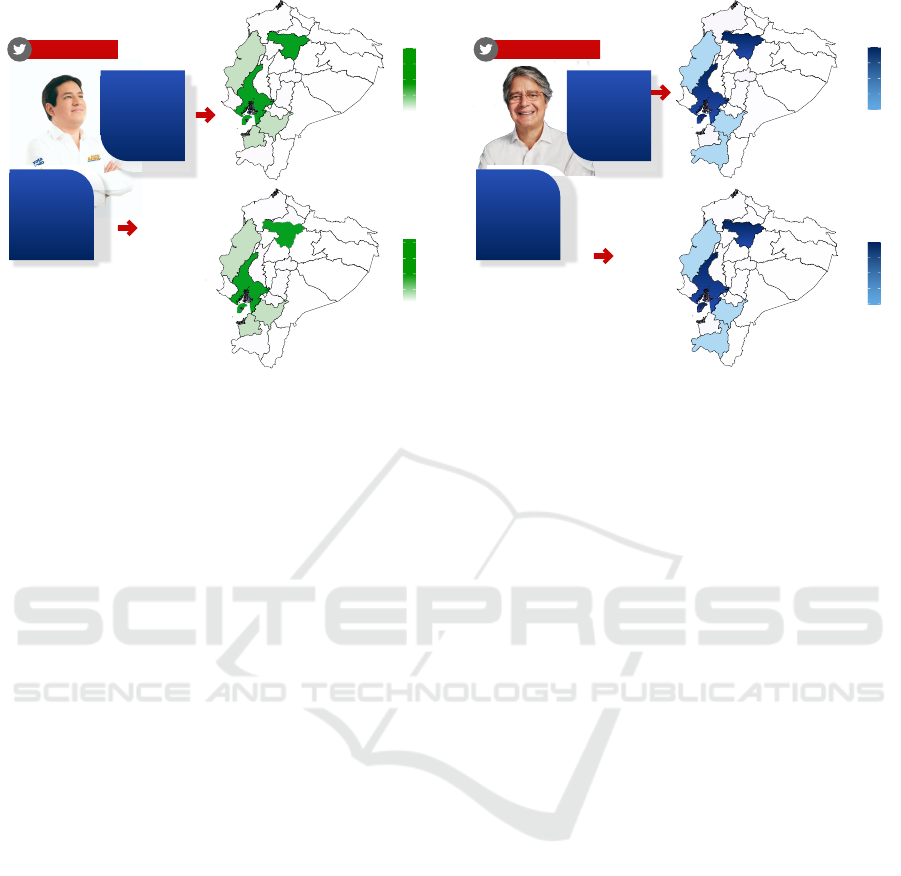
3.1.5 Geospatial Analysis
Figure 6 shows the spread by the user posts through-
out geographic area of Ecuador. the total of tweets
with geolocation, 48.5 % refer to Andr
´
es Arauz and
51.5 % to Guillermo Lasso. Note that only the two
finalist candidates were considered because the num-
ber of tweets with geolocation for the other candidates
was extremely low, i.e., less than 0.05 % of total of
their tweets.
In the case of the first round, the posts with men-
tions or references to Andr
´
es Arauz (@ecuarauz)
came mainly from the provinces of Guayas (36.7 %)
and Pichincha (39 %), adding together more than 75
% of the posts, and there were no postings from 5
provinces of Ecuador, mostly from the Andean and
Amazon region. For Guillermo Lasso (@Guillermo-
Lasso), there is a very similar posting behavior by
provinces, that is, the majority of tweets come from
Guayas (34.6 %) and Pichincha (36.7 %)
In the second round, for Andr
´
es Arauz (@ecua-
rauz) the majority of mentions in Guayas (37.5 %)
and Pichincha (32.2 %) continue to be maintained, but
an increase is noted in the province of Manab
´
ı, where
it went from 4.7 % of tweets generated in the first
round to 7.4 % in the second. It is also observed that
the number of provinces without posts was reduced
to only two. Regarding Guillermo Lasso (@Guiller-
moLasso), no significant changes are observed with
respect to the first round in terms of the provinces
from which more tweets were generated. However,
it is evident that on this occasion in all the provinces
mentions of the candidate were generated, probably
due to his triumph as president of Ecuador.
Our geospatial analysis evidenced that the most of
the tweets with geolocation and mentions of the two
candidates came from the provinces of Guayas and
Pichincha. In the case of Andr
´
es Arauz (@ecuarauz),
the provinces of Manab
´
ı, Azuay and El Oro also stand
out, to a lesser extent. In the case of Guillermo Lasso
(@GuillermoLasso), on the other hand, they are the
provinces of Manab
´
ı, Azuay and Loja.
3.2 Sentiment Analysis
To answer the RQ 2, we performed the following data
analysis: With the data collected from Twitter, about
the presidential elections, we defined the tags derived
from hashtags to train the sentiment classifiers of the
tool used in this work and to know the perception of
users about candidates. This process was performed
in the first and second round. Because of our dataset
does not have neutral data, the tags used to know the
sentiment about the candidates were frequent: “Good
president”, “Bad president”, “good”, “bad”, “lousy”,
“worst government”, “good government”.
With tags defined, we ran the algorithm included
in the tool described in 2.4, which performs a classifi-
cation of the data by dividing them into groups of pos-
itive and negative. For this work we considered the
positive sentiment results because the objective was
to know the favorable impact each candidate had on
users. Figure 7 shows the positive sentiment results
obtained for each candidate in the first round.
Opinion and Sentiment Analysis of Twitter Users during the 2021 Ecuador Presidential Election
263
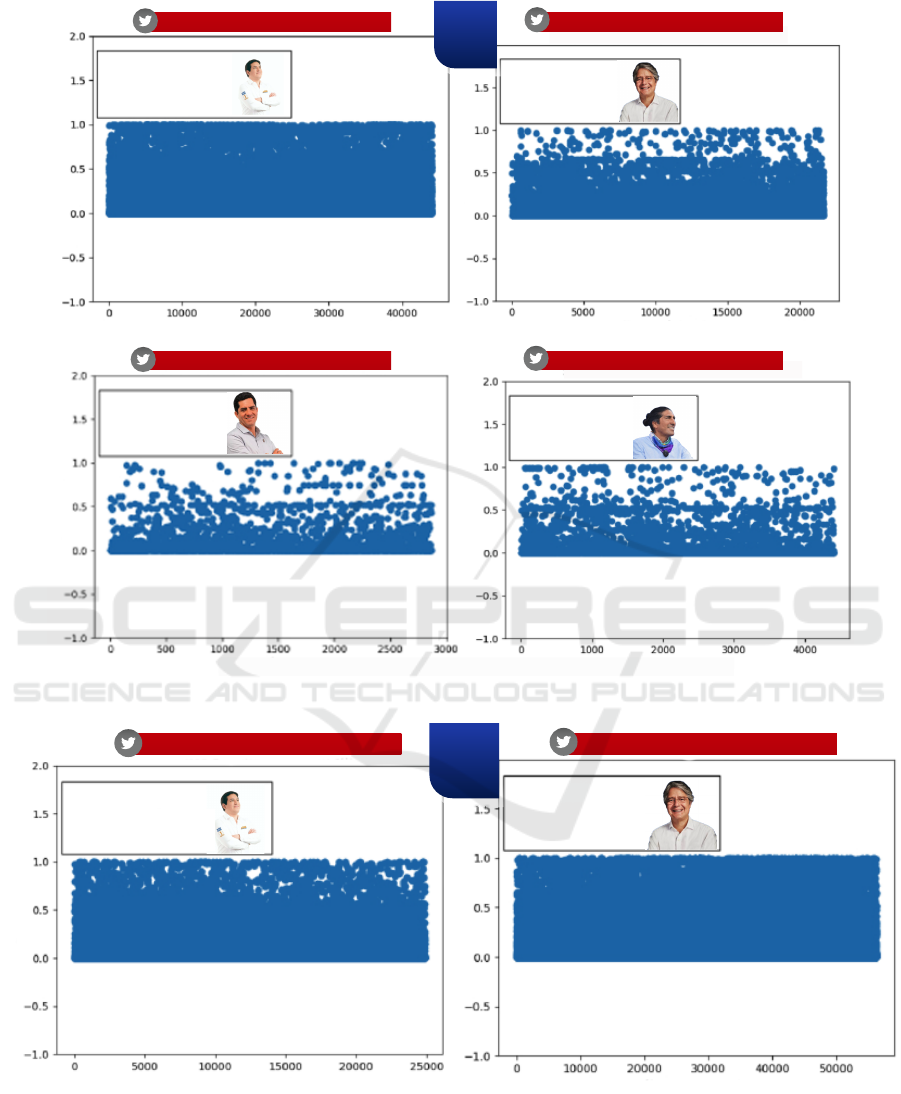
Results of Arauz's sentiment on Twitter
Results of Lasso's sentiment on Twitter
Results of Hervas's sentiment on Twitter
Results of Perez's sentiment on Twitter
Number of tweets Number of tweets
Number of tweets Number of tweets
Sentiment
Sentiment
Sentiment
Sentiment
Average sentiment :
Average sentiment :
Average sentiment :
Average sentiment :
Round
1
32,56 %
16,28 %
25,58 %
25,58 %
Figure 7: Sentiment results in the first round of the presidential election.
Results of Arauz's sentiment on Twitter
Results of Lasso's sentiment on Twitter
Average sentiment :
Average sentiment :
Number of tweets Number of tweets
Sentiment
Sentiment
Round
2
51,85 %
48,12 %
Figure 8: Sentiment results in the second round of the presidential election.
As shown in figure 7, presidential candidates
Arauz, Lasso, Hervas and P
´
erez, were the ones who
generated the most information traffic on Twitter, pro-
voking different points of opinion among users. For
the case of Arauz, we can observe that he obtained
an average positive value of 32,56 %, Lasso 16,28 %,
while Perez and Hervas an average of 25,58 %. Arauz
was candidate who caused more sympathy among
WEBIST 2021 - 17th International Conference on Web Information Systems and Technologies
264

Table 3: Votes and Positives Sentiments obtained by candidates of the 2021 Ecuador Presidential Election.
Candidate
First round Second round
Positive Sentiment Total Votes Positive Sentiment Total Votes
Andr
´
es Arauz 32.56 % 32.72 % 51.85 % 47.64 %
Guillermo Lasso 16.28 % 19.74 % 48.15 % 52.36 %
Yaku P
´
erez 25.58 % 19.39 % - -
Xavier Hervas 25.58 % 15.68 % - -
users which leads us to say that the majority agreed
with the electoral tweets that generated trends during
the first round. These results were contrasted with
the official electoral results obtained in the first round
where Arauz, Perez, Lasso and Hervas were those
who occupied the first positions in the elections re-
spectively.
In the second round, the same process described
in the first round was carried out, results of positive
sentiments are shown in Figure 8. The figure shows
the perception of candidates Arauz and Lasso, if we
compare them with the results obtained by both can-
didates in the first round, in this case the results were
similar. Arauz obtained an average positive value of
51,85 % while Lasso obtained 48,12 %. Results ob-
tained evidence the positive sentiment of the tweets
that users posted on Twitter during the electoral con-
test in the second round.
3.3 Correlation between Sentiments and
Votes
To answer the RQ 3, we show in Table 3, the positive
sentiments expressed by users towards each candidate
with the votes finally obtained by them in the offi-
cial elections. Here, the total votes are obtained from
the CNE website for first
9
and second round
10
. From
these data, we computed the Pearson correlation co-
efficient (ρ) to measure the statistical relationship be-
tween two variables. Here, we considered as variables
X = positive sentiments and Y = total votes. We com-
puted ρ and we obtained a value of 0.63 for the first
round. This indicates that there tends to be a positive
association, i.e., as positive sentiment increases, total
votes tends to increase. For the second round, it is not
possible to compute the coefficient because it require
at least 3 points data to offer a meaningful capture
about the linear correlation.
Our simple correlation analysis evidenced that the
positive sentiments expressed towards the presiden-
tial candidates are similar to the votes finally obtained
during the first round of the election. However, it is a
way simple method used for a single election process.
9
shorturl.at/jsIV0
10
shorturl.at/xAX29
Furthermore, we observe that for the second round
the percentages of positive sentiments are not as pre-
cise (as in the first round) in relation to the total votes
obtained by the presidential candidates. Therefore,
we believe that this correlation analysis requires more
historical data from other elections and a deeper anal-
ysis of the country’s social context, to come to con-
sider Twitter sentiment analysis as a relevant factor to
predict election outcomes in Ecuador.
4 CONCLUSIONS
This paper presented an opinion and sentiment anal-
ysis of Twitter users during the 2021 Ecuador Presi-
dential Election. It includes an interesting look into
the sentiments expressed by users and their relation
with the official voted achieved by presidential candi-
dates.
Opinions analysis shows that users offered opin-
ions on biosecurity measures due to the pandemic and
speed in providing the official results quickly during
the first round. In the second round, opinions were
more focused on mentioning positive and negative as-
pects of each finalist candidate.
Sentiment analysis shows results of user’s perception
of the candidates from tags extracted from tweets col-
lected from Twitter. Results showed that candidate
Arauz was the presidential candidate who obtained
the most positive sentiment in the first and second
round. However, for the second round, results ob-
tained by presidential candidate Lasso evidenced a
close relationship of positive sentiment over Arauz.
The final results of the sentiment analysis on Twitter
about Ecuador’s presidential elections in 2021 were
close to the official results published by the CNE.
Correlation analysis demonstrated that there is a cor-
respondence between positive sentiments expressed
in the tweets and the total votes obtained by candi-
dates during the first round of the 2021 Ecuador Pres-
idential Election. However, it does not seem sufficient
to produce a reliable result regarding sentiments anal-
ysis in Twitter to be considered a relevant factor in
predicting election outcomes in Ecuador.
Opinion and Sentiment Analysis of Twitter Users during the 2021 Ecuador Presidential Election
265

REFERENCES
Agarwal., A. and Bansal., V. (2020). Exploring sentiments
of voters through social media content: A case study
of 2017 assembly elections of three states in india. In
Proceedings of the 22nd International Conference on
Enterprise Information Systems - Volume 1: ICEIS,,
pages 596–602. INSTICC, SciTePress.
Banthia, M., Goel, S., Deepanshi, and Sinha, A. (2020).
Geo-spatial analysis of information outreach in twitter
social network. In Singh, P. K., Sood, S., Kumar, Y.,
Paprzycki, M., Pljonkin, A., and Hong, W.-C., editors,
Futuristic Trends in Networks and Computing Tech-
nologies, pages 444–455, Singapore. Springer Singa-
pore.
Barnaghi, P., Ghaffari, P., and Breslin, J. G. (2016). Opinion
Mining and Sentiment Polarity on Twitter and Corre-
lation between Events and Sentiment. Proceedings -
2016 IEEE 2nd International Conference on Big Data
Computing Service and Applications, BigDataService
2016, pages 52–57.
Del-Alc
´
azar, J. (2021). Ecuador Estado Digital Ene/21.
Mentinno - Formaci
´
on Gerencial - New Media.
Feinerer, I., Hornik, K., and Meyer, D. (2008). Text min-
ing infrastructure in r. Journal of Statistical Software,
25(5):1–54.
Gaurav, M., Kumar, A., Srivastava, A., and Miller, S.
(2013). Leveraging candidate popularity on Twitter
to predict election outcome. Proceedings of the 7th
Workshop on Social Network Mining and Analysis,
SNA-KDD 2013.
Gustisa Wisnu, G. R., Ahmadi, Muttaqi, A. R., Santoso,
A. B., Putra, P. K., and Budi, I. (2020). Sentiment
analysis and topic modelling of 2018 central java gu-
bernatorial election using twitter data. 2020 Interna-
tional Workshop on Big Data and Information Secu-
rity, IWBIS 2020, pages 35–40.
Jhawar, A., Munjal, V., Ranjan, S., and Karmakar, P.
(2020). Social Network based Sentiment and Net-
work Analysis to Predict Elections. Proceedings of
CONECCT 2020 - 6th IEEE International Conference
on Electronics, Computing and Communication Tech-
nologies, pages 0–5.
Kearney, M. W. (2019). rtweet: Collecting and analyzing
twitter data. Journal of Open Source Software, 4(42).
R package version 0.7.0.
Kristiyanti, D. A., Normah, and Umam, A. H. (2019). Pre-
diction of Indonesia presidential election results for
the 2019-2024 period using twitter sentiment analysis.
Proceedings of 2019 5th International Conference on
New Media Studies, CONMEDIA 2019, pages 36–42.
Krouska, A., Troussas, C., and Virvou, M. (2017). Compar-
ative evaluation of algorithms for sentiment analysis
over social networking services. Journal of Universal
Computer Science, 23(8):755–768.
Li, N. and Wu, D. D. (2010). Using text mining and senti-
ment analysis for online forums hotspot detection and
forecast. Decision Support Systems, 48(2):354–368.
Liu, R., Yao, X., Guo, C., and Wei, X. (2021). Can We
Forecast Presidential Election Using Twitter Data?
An Integrative Modelling Approach. Annals of GIS,
27(1):43–56.
Parmelee, J. H. (2014). The agenda-building function of
political tweets. New Media & Society, 16(3):434–
450.
Parraga-Alava, J., Caicedo, R. A., G
´
omez, J. M., and
Inostroza-Ponta, M. (2019). An unsupervised learn-
ing approach for automatically to categorize potential
suicide messages in social media. In 2019 38th Inter-
national Conference of the Chilean Computer Science
Society (SCCC), pages 1–8.
Rofr
´
ıo, D., Ruiz, A., Sosebee, E., Raza, Q., Bashir, A.,
Crandall, J., and Sandoval, R. (2019). Presidential
elections in ecuador: Bot presence in twitter. In 2019
Sixth International Conference on eDemocracy eGov-
ernment (ICEDEG), pages 218–223.
Sharma, A. and Ghose, U. (2020). Sentimental Analysis
of Twitter Data with respect to General Elections in
India. Procedia Computer Science, 173(2019):325–
334.
Sharma, P. and Moh, T. S. (2016). Prediction of Indian elec-
tion using sentiment analysis on Hindi Twitter. Pro-
ceedings - 2016 IEEE International Conference on
Big Data, Big Data 2016, pages 1966–1971.
Singh, P., Dwivedi, Y. K., Kahlon, K. S., Pathania, A., and
Sawhney, R. S. (2020). Can twitter analytics predict
election outcome? An insight from 2017 Punjab as-
sembly elections. Government Information Quarterly,
37(2):101444.
Troussas, C., Krouska, A., and Virvou, M. (2016). Evalua-
tion of ensemble-based sentiment classifiers for twit-
ter data. In 2016 7th International Conference on In-
formation, Intelligence, Systems Applications (IISA),
pages 1–6.
Wang, L. and Gan, J. Q. (2019). Prediction of the 2017
French Election Based on Twitter Data Analysis Us-
ing Term Weighting. 2018 10th Computer Science
and Electronic Engineering Conference, CEEC 2018
- Proceedings, pages 231–235.
Wickham, H., Averick, M., Bryan, J., Chang, W., Mc-
Gowan, L. D., Franc¸ois, R., Grolemund, G., Hayes,
A., Henry, L., Hester, J., Kuhn, M., Pedersen, T. L.,
Miller, E., Bache, S. M., M
¨
uller, K., Ooms, J., Robin-
son, D., Seidel, D. P., Spinu, V., Takahashi, K.,
Vaughan, D., Wilke, C., Woo, K., and Yutani, H.
(2019). Welcome to the tidyverse. Journal of Open
Source Software, 4(43):1686.
Yaqub, U., Sharma, N., Pabreja, R., Chun, S. A., Atluri, V.,
and Vaidya, J. (2020). Location-based sentiment anal-
yses and visualization of twitter election data. Digit.
Gov.: Res. Pract., 1(2).
WEBIST 2021 - 17th International Conference on Web Information Systems and Technologies
266
