
Measuring Pressure in Different Layers of the Ski Boot to
Estimate Skiing Movements
Aljoscha Hermann
a
, Patrick Carqueville
b
, Melanie Baldinger
c
and Veit Senner
d
Professorship of Sport Equipment and Materials, School of Engineering and Design,
Technical University of Munich, Munich, Germany
Keywords: Pressure Sensors, Measurement Boot, Measurement Sock, Alpine Skiing.
Abstract: A pressure sensing measurement ski boot or sock would allow to estimate body positions, skiing manoeuvres,
and external loads on the foot. This information may be used for research, in consumer products or for
intelligent safety systems like a mechatronic ski binding. To investigate the optimal placement of pressure
sensors with respect to the foot and the number of sensors needed to detect six pre-defined loading conditions,
three pressure sensor systems were developed measuring the pressure in three respective layers: between foot
and sock, sock and liner, liner and shell. The prototypes were evaluated in a laboratory test. The participant
performed a series of six simulated ski manoeuvres each held for 5 seconds. In this pilot test the system sock
/ liner shows the best overall performance due to pressure curves in the mid-range of the sensor characteristics.
Though, with an optimized sensor design a measurement boot with sensors between inner boot and shell may
be possible, which would increase the robustness of the system needed for a future customer product. As a
result of this study, a recommendation for sensor positions for the determination of the loading conditions in
alpine skiing is given.
1 INTRODUCTION
Tracking skiing loads is normally done with specially
developed equipment. An optimal sensor system
would not only allow to measure forces, but also to
calculate the resulting torques at the binding, the force
application points and the centre of gravity. This
information also allows to make assumptions about
the body position (for example a possible backward-
lean) and resulting loads at the knee (e.g. valgus/varus
due to a high side-load on the ski).
The use of standard laboratory dynamometers is
not applicable, as the system must be carried by the
skier or attached to the skiing equipment.
Several custom-made systems were developed for
recording the forces and moments acting on the ski.
Most systems are based on strain gauge sensors for
measuring the forces between the ski and the ski
binding or between the ski binding and the ski boot.
In many systems, forces and moments are recorded
a
https://orcid.org/0000-0003-3168-3273
b
https://orcid.org/0000-0001-7066-5225
c
https://orcid.org/0000-0002-5753-4025
d
https://orcid.org/0000-0001-5136-7580
separately for the front and back component of the ski
binding (Schwameder et al. 2001; Falda-Buscaiot et
al. 2017; Saito et al. 2015; Stricker et al. 2010). This
is advantageous if the force transmission through the
two binding components is investigated, but
susceptible for provoking and recording coercive
forces in the ski-boot-binding-complex, as the system
is statically overdetermined, thus limiting
interpretability of the results. Other systems use only
one sensing component (Kiefmann et al. 2006), thus
measuring the absolute skiing loads.
Such “measurement bindings” can give highly
accurate information about the forces, moments, and
the centre of vertical force application along the
longitudinal axis of the ski. On the other hand, these
bindings are unhandy to use, as they are stiff, large,
and heavy. Moreover, they are unique and of a
complexity that does not allow widespread use in
skiing as a consumer product.
28
Hermann, A., Carqueville, P., Baldinger, M. and Senner, V.
Measuring Pressure in Different Layers of the Ski Boot to Estimate Skiing Movements.
DOI: 10.5220/0010650700003059
In Proceedings of the 9th International Conference on Sport Sciences Research and Technology Support (icSPORTS 2021), pages 28-35
ISBN: 978-989-758-539-5; ISSN: 2184-3201
Copyright
c
2021 by SCITEPRESS – Science and Technology Publications, Lda. All rights reserved

One option to reduce weight and size is to reduce
the degrees of freedom measured by the system.
However, force sensor systems measuring only the
vertical force are still heavy and, due to the
measurement principle, need to be very stiff. For
example the system by Wimmer and Holzner (1997)
had a total weight of 990 g.
An alternative to force measurement is the
measurement of pressure. With a known
measurement surface and pressure distribution, the
acting forces and moments can theoretically be
calculated. Pressure sensors are cheaper and can be
very thin and therefore minimize a possible restriction
of the athlete by the system itself. A flexible design
of pressure sensors is possible and allows the
integration inside a ski boot. Various systems of
different sensor types (resistive, capacitive, hydro
cells) have been used in research and are also
available as commercial products.
Drawbacks of pressure sensors are the limitation
on unidirectional measurements and the reduced
measurement frequency compared to force sensors
(depending on the measuring principle and the
number of sensors used, but usually lower than 250
Hz). Moreover, further limitations are a difficult
calibration when inside the boot (for example due to
shoe buckles and changing position of the foot inside
the boot), and the difficult determination of the force
application points (only possible for forces inside the
sensing area). As with all sensor systems, a
compromise between spatial resolution, time
resolution, measurement accuracy, robustness and
usability must be found for the intended use.
Nevertheless, pressure insoles were successfully
used in skiing research for various reasons. Krueger
et al. (2006) determined the edging angle and the
ground reaction force with a 24 sensor insole.
Raschner et al. (2001) used insoles with 99 capacitive
sensors to compare carving turns to (at that time)
traditional turns. Spitzenpfeil et al. (2006) tracked
mechanical loads in alpine ski racing and derived
implications for safety and material considerations
and Lafontaine et al. (1998) conducted a study with
PEDAR pressure measuring soles (Novel, Munich,
Germany) with professional Ski instructors. The
maximum and average vertical forces, the maximum
pressure, the pressure distribution, and the trajectory
of the pressure point was calculated for different
turns. In their congress abstract, Brodie et al. (2008)
propose, that pressure insoles can provide insight into
possible stance alteration to reduce knee torques or
aid preventive programs. An interesting work was
presented by Holleczek et al. (2010) who used self-
made pressure sensors (Holleczek et al. 2009) and
artificial intelligence to detect snowboard turns.
Falda-Buscaiot et al. (2017) studied the influence of
slope angle, foot position, and turn phase on the
plantar pressure distribution.
Stricker et al. (2010) compared forces calculated
with data from pressure measurement soles with
forces recorded by 3D dynamometers. The
compressive force measured by the soles were on
average between 21 % (outer ski) and 54 % (inner ski)
lower than that measured by the 3D dynamometers.
The authors attribute this to the different positions of
the measuring systems, as well as to the fact that part
of the force is absorbed in the boot shaft. However, a
high degree of similarity between the force-time
curves of the pressure measuring pads and the
dynamometers was found.
A sophisticated pressure sensing system was
presented by Schaff et al. (1997), who used a
measurement sock with 64 sensors attached beneath
the foot, as well as around the lower leg, the instep
and medially and laterally at the foot.
The use of pressure sensors, not only in the plantar
region of the foot, but also in the shaft, can add
valuable information and enable the estimation of all
force and moment components acting on the foot. A
system working on pressure sensors is preferable to a
system based on force sensors because it would be
easier to integrate in the existing equipment and
would be a lot cheaper. Especially an integration into
the outer shell of the ski boot would be relatively easy
Table 1: Advantages and disadvantages of resistive and capacitive pressure sensors.
Resistive Capacitive
+ simple sensor design + not sensitive to temperature and humidity
+ simple data logger design - complex data logger design
+ large measurement range - sensor thickness
+ fast reaction time
- non-linear
- sensitive to temperature and humidity
o records maximal pressure acting on the sensor
o records mean pressure acting on the sensor
Measuring Pressure in Different Layers of the Ski Boot to Estimate Skiing Movements
29

to manufacture and may have advantages to an
integration in the soft boot or sock with respect to
manufacturing and sensor robustness. On the other
hand, the pressure amplitude certainly is diluted
through the different material layers from the foot to
the outer shell.
For the development of sensors for measuring the
pressure distribution in a ski boot either capacitive or
resistive sensors are applicable.
The two technologies each have advantages and
disadvantages (
Table 1
) and the decision for a
technology depends on the application and the
resulting requirements. The most important
requirements for pressure sensors as well as their
practical application are summarized by Razak et al.
(2012) and mainly concern hysteresis, linearity,
temperature sensitivity, and the pressure range of the
sensor. In addition, the two pressure measurement
methods differ fundamentally with respect to the
measurement results. While resistive sensors measure
the peak pressure of the entire sensor surface, the
result of the capacitive measurement is the average
pressure over the sensor surface (Ashruf 2002).
Main aim of this study was to find the (1) number
of sensors and the (2) location of those sensors on the
foot needed to optimally estimate load states, and to
determine the (3) pressure differences between a
placement of sensors in the three layers between foot
/ sock, sock / liner, and liner / shell.
2 METHODS
For this study self-made prototype systems were
developed to measure pressure distribution in the ski
boot. In total three systems for the right foot were
built:
• PTBoot: Pressure sensors attached to the plastic
shell of the boot, between the shell and the inner
soft boot.
• PTSock: Pressure sensors attached to the inside of
the soft boot, between the soft boot and the ski
sock.
• PTFoot: Pressure sensors directly attached to the
foot.
This allowed to investigate the best location for the
sensors around the leg and test the loss of pressure
amplitude from one (material) layer to the next.
In a laboratory study, simulated skiing movements
were recorded simultaneously with all three systems.
Based on the results, a recommendation of a reduced
number of sensors is given. Fewer sensors allow
higher measurement frequencies and reduce
complexity of a to-be commercial measurement boot
and the required microcontrollers.
For the easy structure of the sensor and the
logging module, a resistive solution was chosen. The
two types of self-made sensors have a circular design
with a sensitive area of 30 mm in diameter and a
surface of 707 mm² (
Figure 1
) for a larger sensor and
20 mm in diameter and a surface of 314 mm² for the
smaller sensor. The sensors consist of a flexible
carrier foil of 25 μm thickness with 18 μm thick
copper tracks printed on it. The tracks form two
interlocking combs. The two conductive tracks are
wired for the connection to the data logger and a
reference conductor. Velostat
®
(electrically
conductive foil due to a carbon black impregnation,
3M, Maplewood, United States) was used as pressure
sensitive conductive material. Three layers, each 0.1
mm thick, were placed on the conductive side of the
foil. All layers were fixed and isolated by laminating
them with conventional laminating film. A voltage
divider circuit with a 100 Ω reference conductor was
used to record the sensor signal (see equation (2)).
Figure 1: Schema of the pressure sensor (left) and steps of manufacturing: middle left: foils with conductive tracks; middle
right: wired sensor foils; right: finished sensor with pressure sensitive conductive material layer over the foils with the
conductive tracks and protective, non-conductive foils laminated on both sides of the sensor.
icSPORTS 2021 - 9th International Conference on Sport Sciences Research and Technology Support
30
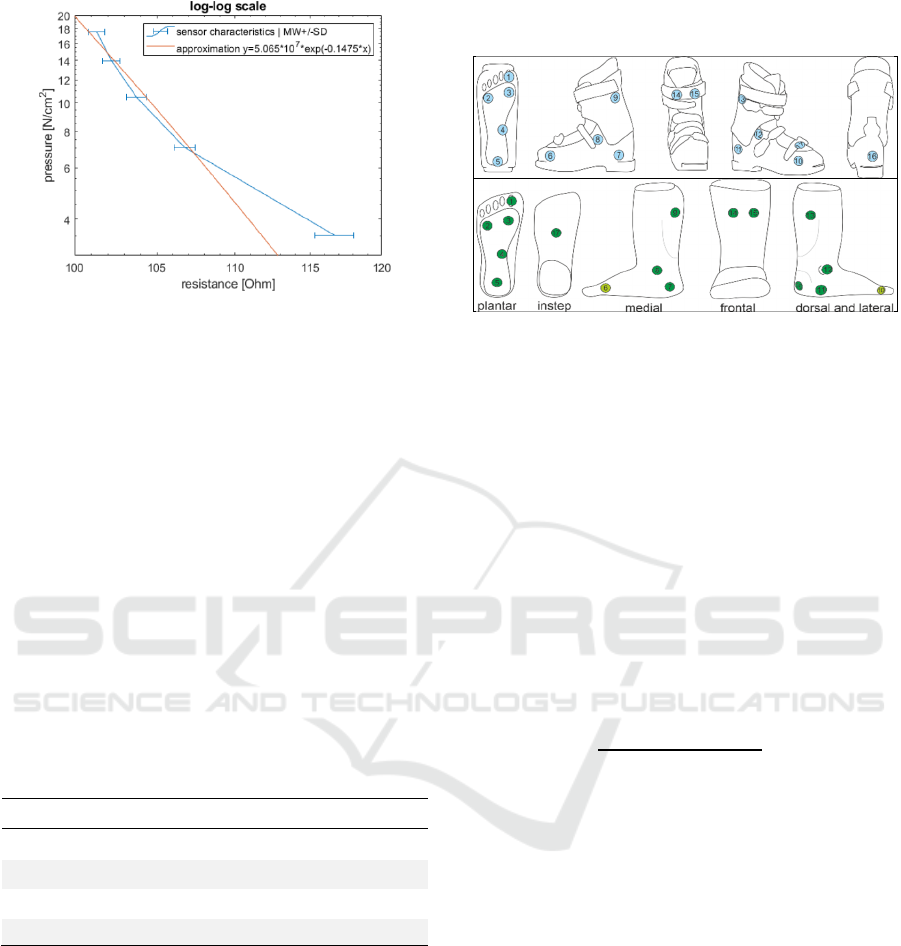
Figure 2: Sensor characteristic of the large sensor type
derived of 5 of the self-made pressure sensors.
𝑦𝑎𝑒
(1)
The sensor characteristics were determined
(Figure 2) by applying defined loads on the sensors.
An approximation curve was calculated using
equation (1) with the curve fitting tool of Matlab
2020a (MathWorks, Natick, Massachusetts,
USA).with 𝑦 being the pressure seen by the sensor, 𝑥
being the electrical resistance of the sensor, and the
parameters 𝑎 5.065 ∗ 10
, and 𝑏 0,1475 for the
large sensor type, having a corelation of 𝑅
0.9527 between pressure und electrical resistance.
Due to the small number of the smaller sensors the
sensor characteristics for each of the small sensors
was determined individually and is given in
Table 2
.
Table 2: Parameters for the sensor characteristic
approximation for the four small sensors used. Parameters
refer to equation (1).
Sensor a b R²
PTSock 6 125.1 0.01671 0.9286
PTSock 10 115.8 0.008495 0.9588
PTFoot 6 95.98 0.001639 0.9743
PTFoot10 370.5 0.0364 0.9775
The placement of the sensors was determined
based on preliminary tests and considerations with
regard to an optimal detection of following loads
acting on the foot, which are for-/backward leaning
(My) / rotation torque (Mz) /edging loads (Mx / Fy) /
vertical ground reaction force (Fz).
For all three prototypes 17 sensors were
distributed around the foot and lower leg (see Figure
3). Four sensors are placed on, both, the medial and
lateral side of the foot, five sensors were placed in the
plantar region, two sensors at the tibia shaft, one
sensor at the heel and one sensor above the instep. For
PTSock and PTFoot the sensors in the toe region no.
6 and 10, have a smaller diameter of 20 mm, due to
space limitations.
Figure 3: First line: Placement of the 17 pressure sensors o
f
ski boot prototype ‘PTBoot’ (placed on the inner side of the
hard shell of the boot). All sensors have a diameter of 30
mm. Second line: Placement of 17 pressure sensors in the
sock prototype ‘PTSock’ and the placement of the sensors
directly on the skin of the foot ‘PTFoot’. Sensors 6, and 10
are of a smaller diameter (20 mm). All other sensors have
a
diameter of 30 mm.
A myRio-1900 (National Instruments, Austin,
Texas, USA) was used for A/D conversion,
processing, and logging. To allow the logging of all
sensors, multiplexers (MUX, CD74HC4051E, Texas
Instruments, Dallas, Texas, USA) were used with
reference conductors ( 𝑅
100Ω ). The
sensors were supplied with 𝑈
5𝑉. The resistance
of each sensor 𝑅
is calculated using equation
(2), were 𝑈
is the measured signal in Volt.
𝑅
𝑈
∗𝑅
𝑈
𝑈
(2)
A LabView 2015 (National Instruments, Austin,
Texas, USA) program was running on the myRio.
Measurement frequency was set to 10 Hz (limited by
the number of sensors and the hardware, e.g.,
switching time of the MUX). Data was saved on an
USB-stick plugged into the myRio-modul.
All three pressure sensing prototypes (Figure 4)
were used simultaneously. The setting of the data
collection is stationary. One participant is simulating
ski-typical body postures by shifting body weight and
using muscle activation.
Simulated postures are backward-leaning,
forward-leaning, left curve (inner edge of the
measurement boot), right curve (outer edge of the
measurement boot), internal rotation, and external
rotation. Each position was held for 5 seconds.
The pressure values were calculated using equations
(1) and (2) with the respective equation parameters of
the above-mentioned sensor characteristics. All
calculations were performed using Matlab.
Measuring Pressure in Different Layers of the Ski Boot to Estimate Skiing Movements
31
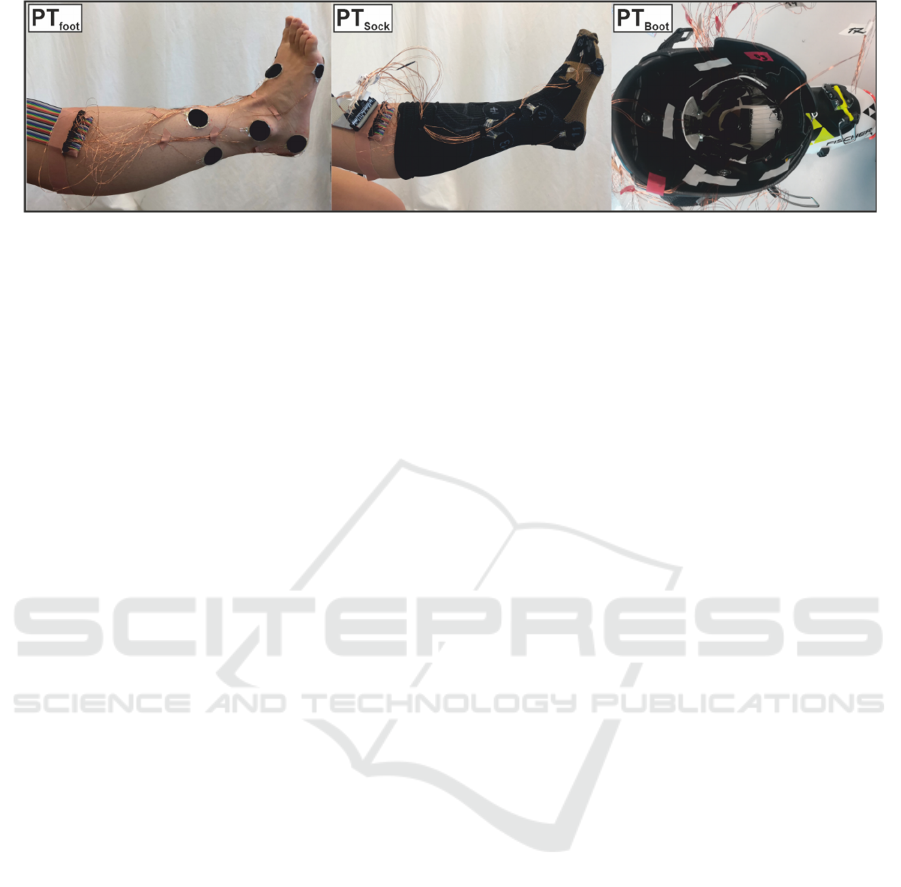
Figure 4: The three sensor prototypes and the test set up with the participant wearing all prototypes.
3 RESULTS
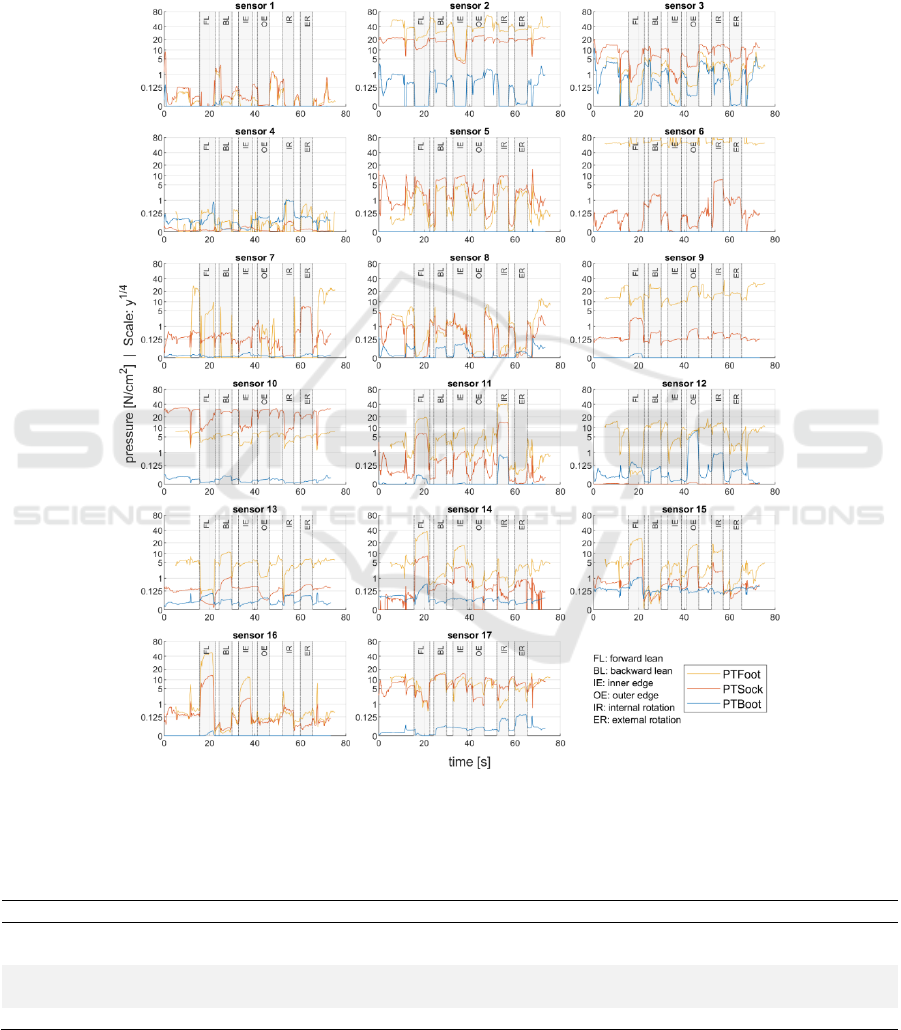
The comparison of the respective values of each
sensor of the different prototypes at the same position
indicate a qualitative similarity between the pressure
curves with a loss of amplitude from PTFoot to
PTSock to PTBoot (Figure ). The loss is not the same
for each sensor position. The pressure recorded by
PTBoot is low with values smaller than 0.125 N/cm²
for most of the sensors and not exceeding 10 N/cm²
in any sensor. The pressure range for PTFoot and
PTSock is mainly between 0 and 40 N/cm². Higher
values are reached by PTFoot sensor 2 (positioned
under the outside edge of the ball of the foot), which
reaches 68 N/cm² and PTFoot sensor 6 (positioned at
the medial side of the ball of the foot), which reaches
a maximum of 83.4 N/cm².
Both sensors under the ball of the foot (sensor 2
and 3) show highest pressure values in the plantar
region and have a distinguishable resolution of the
measured manoeuvres in all three systems. The
sensor positioned under the heel (sensor 5) hardly
measures any pressure for PTBoot but higher values
(about 10 N/cm²) for PTFoot and PTSock. The
sensors under the big toe (Sensor 1) of PTFoot and
PTSock show only small pressure responses to the six
skiing manoeuvres, with highest values for the time
spans of the transition from one manoeuvre to
another. The same sensor of PTBoot shows nearly no
signal. The different skiing manoeuvres are not
prominently expressed in the sensor data under the
arch of the foot (sensor 4), which recorded small
pressures over the total measurement. At the medial
and lateral side, the higher positioned sensors 8 and
12 of PTBoot show higher pressures than the lower
positioned sensors 6, 7 (medial) and 10, 11 (lateral)
of PTBoot. The same sensors of PTSock and PTFoot
give more pronounced values than the sensors of
PTBoot, but some signals of sensors 6, 7, and 12 show
an abnormal behaviour (see discussion). Even
though, the sensors at the calf (9 and 13) show high
pressures for PTFoot and PTSock, only low values
are recorded by PTBoot. At the tibia (sensors 14 and
15), the sensors of all three prototypes are sensitive to
the six skiing manoeuvres. Sensor 16 (backside of
heel) and 17 (instep) record high pressure and allow
to distinguish the skiing manoeuvres for PTFoot and
PTSock but record only low values for PTBoot.
4 DISCUSSION
In this study, PTBoot measured only very small
pressure values and the loss of amplitude from
PTFoot to PTBoot is large. Therefore, sensors for a
to-be measuring boot or sock need to be designed
very specifically with respect to resolution and
sensitivity and probably different sensor designs are
needed for different sensor positions in the boot. It
may be advisable to design the shell shape in such a
way that the liner transfers a large part of the force to
the shell on defined surface areas on which the
sensors are placed.
In general, the sock prototype produced the best
results compared to both other prototypes. This
prototype generates sensor values in the middle range
of the sensor characteristics for almost all sensors and
thus seems best suited for this application. Therefore,
an integration of such a pressure measurement system
in the sock or the liner would be more expedient than
the integration between the hard-shell and the liner.
On the other hand, with respect to robustness and easy
manufacturing, a pressure sensing boot is preferable
to a pressure sensing sock.
The qualitative determination of specific skiing
manoeuvres with a pressure measurement system in
the ski boot is possible. Based on the results of the
investigations with the three prototypes it is possible
to reduce the number of pressure sensors needed. A
recommendation of sensor positions based on
qualitative judgments is given in
Table 3
. The sensors
which show the most significant change in pressure
for the specific movements are highlighted in bold
letters.
To detect a forward or backward leaning body
position the tibia shaft may be better suited than a
icSPORTS 2021 - 9th International Conference on Sport Sciences Research and Technology Support
32
position at the calf or the plantar region. The sensors
at the calf are not only influenced by the leaning
position, but also by muscle activation. The sensors
in the plantar region may be non-optimal as they may
give misleading information in some situations. For
example, the sensors under the ball of the foot may be
unloaded even though the skier is leaning forward. In
such a case, the skier presses the tibia in the boot and
pulls the toes up to increase this pressure on the tibia
by increasing the pressure on the heel.
The exact selection of a sensor position at the
outer sides of the foot may heavily influence the
quality of results in detecting turns or rotation
movements. One issue to consider is the very
individual geometry of the foot, another reason is the
Figure 5: Comparison of the pressure sensor values of the three prototypes. The six skiing positions are indicated by the grey
areas and a respective annotation.
Table 3: Recommendation of the placement of pressure sensors to determine skiing manoeuvres based on the results with the
three prototypes.
Detection of Sensor Sensor position
Forward / backward lean (2), (3), 9, 13, 14, 15, 16,
17
(ball of foot), calf, tibia shaft, heel, instep
Left / right curve 8, 9 / 12, 13 Upper part of the lateral and medial side of the foot, near the bend of the
foot and the calf.
Internal / external rotation 6, 11 / 7, 10 Lower part of the lateral and medial side of the foot.
Measuring Pressure in Different Layers of the Ski Boot to Estimate Skiing Movements
33

clamping of the foot in the boot, which varies for
different skiing positions and manoeuvres but also as a
result of deliberate force production to control the ski.
If exact pressure values or loads should be
determined (in contrast to the estimation of body
position only), a great challenge will be the
calibration of the sensors. A commonly used
procedure for plantar pressure measurements is that
the persons foot is in the boot or shoe and the person
lifts the foot for a static and unloaded recording which
is then used to ‘zero’ the sensors. In the following
these values of the static recording are subtracted
from the later recorded values to determine the loads
acting on the foot. This procedure is not possible in
the prototypes used in this study. Even though the
lifting of the foot unloads the sensors placed under the
foot, the sensors positioned in other regions are
loaded. Moreover, a tight setting of the buckles of the
ski boot can produce high pressure values which even
may bring the sensors to a saturation.
The above given recommendation may only hold
for the detections of isolated and very specific
movements and will probably not be applicable if
multiple movement patterns occur simultaneously. A
possible solution approach to this could be the use of
artificial intelligence with a well-trained neuronal
network. As attractive as such a solution is, the
training of such a network would need sufficient real-
life data which also has to be labelled labour-
intensively.
Due to the design of the study, no high dynamics
are apparent, and the loads and pressures measured
with the prototypes are relatively low with most
sensors measuring values below 5 to 10 N/cm² and
only singular sensors reaching values of 20 to 40
N/mm². Up to ~ 6.4 N/cm
2
the pressure is
underestimated, due to the sensor characteristics
shown in Figure 2. Still, the values are small
compared to maximal (only plantar) pressure values
reported in on-slope skiing of 28 to 38 N/cm²
(Lafontaine et al. 1998).
As only the local maximal pressure of each
resistive sensor at each time is recorded, the system is
prone to large errors due to wrinkles in the sock, a
small hard object pressing on the sensor (for example
a stiff seam of the sock or inner boot or a bone of the
foot), or a bending of the sensor. This may also be a
reason for the, significantly, higher pressure signals
of single sensors of PTFoot compared to the other
prototypes (for example sensors 2, 3, 5, 6, 12).
Therefore, the use of capacitive sensors would be
advantageous, as local pressure peaks at the sensor
surface are filtered and a mean pressure of the sensor
surface is measured. But capacitive sensor designs are
more complicated and need specific experience.
The self-designed sensors used in this study are
non-linear and the approximation is not ideal. This
may lead to large errors in the calculation of pressure
values especially for very small and very high sensor
values. This is a result of various aspects of the sensor
design and, therefore, could be addressed in multiple
ways. For example, by replacing the Velostat
®
layers
by a carbon black silicon compound, potential contact
loss between the Velostat
®
layers themselves and
between Velostat
®
and the printed circuit board
material may be prevented. This contact loss results
in higher electrical resistance and thus lower pressure
values.
5 CONCLUSION
This work shows the relevance of certain sensor
positions for detecting the simulated load states. Two
groups of sensors should be emphasized here: the
anterior shaft sensors (Sensors 14 and 15) for
determining a forward/backward lean, and the sensors
on the lower part of the lateral and medial side of the
foot for determining an internal/external rotation.
In general, the sensor design must be specifically
made for the respective position and the
corresponding pressure value range. Here the sock
prototype shows the most balanced sensor values for
the different sensor positions. To tackle the various
challenges with respect to an optimal sensor design
(for example, measurement range, saturation, and
sensor size), field data will be needed to allow more
insights.
Injuries of the knee in alpine skiing often result
from a backward leaning position (Freudiger and
Friedrich 2000). Therefore, the implementation of a
measurement boot recording external loads and body
positions in an adaptive safety system (for example a
future mechatronic ski binding) may allow to detect
risky situations and react accordingly. A combination
of force sensors measuring torques around the vertical
axis and pressure sensors used to predict forward and
backward lean and torques in the sagittal plane might
be a possible compromise.
Artificial Intelligence may allow to cope with the
high complexity due to imperfect defined sensor
characteristics. A neuronal network with a small
number of pressure sensors at defined positions could
be trained with ground reaction forces (My, Mz, Fy,
Fz) recorded by a measurement binding. With
sufficient training data, the neuronal network will
predict the skiing loads using the pressure sensor data.
This has been successfully done for a snowboard
binding by Holleczek et al. (2010).
icSPORTS 2021 - 9th International Conference on Sport Sciences Research and Technology Support
34

REFERENCES
Ashruf, C.M.A. (2002): Thin flexible pressure sensors. In SR
22 (4), pp. 322–327. DOI: 10.1108/02602280210444636.
Brodie, Matthew; Walmsley, Alan; Page, Wyatt (2008):
Fusion motion capture: a prototype system using
inertial measurement units and GPS for the
biomechanical analysis of ski racing. In Sports Technol.
1 (1), pp. 17–28. DOI: 10.1002/jst.6.
Falda-Buscaiot, Thomas; Hintzy, Frédérique; Rougier,
Patrice; Lacouture, Patrick; Coulmy, Nicolas (2017):
Influence of slope steepness, foot position and turn
phase on plantar pressure distribution during giant
slalom alpine ski racing. In PloS one 12 (5), e0176975.
DOI: 10.1371/journal.pone.0176975.
Freudiger, S.; Friedrich, N. F. (2000): Critical load cases for
knee ligaments at skiing - an engineering approach. In
ASTM Special Technical Publication (1397), pp. 160–174.
Holleczek, Thomas; Ru, Alex; Harms, Holger; Tro,
Gerhard (2010): Textile pressure sensors for sports
applications. In : 2010 IEEE sensors. Waikoloa,
Hawaii, USA, 1 - 4 November 2010 ; [the Ninth IEEE
Sensors Conference 2010. 2010 Ninth IEEE Sensors
Conference (SENSORS 2010). Kona, HI, 11/1/2010 -
11/4/2010. Institute of Electrical and Electronics
Engineers; Sensors Council; IEEE Sensors Conference.
Piscataway, NJ: IEEE, pp. 732–737.
Holleczek, Thomas; Zysset, Christoph; Arnrich, Bert;
Roggen, Daniel; Troster, Gerhard (2009): Towards an
Interactive Snowboarding Assistance System. In :
Proceedings / 2009 International Symposium on
Wearable Computers. ISWC 2009 ; 4 - 7 September
2009, Linz, Austria. 2009 International Symposium on
Wearable Computers (ISWC). Linz, Austria, 9/4/2009
- 9/7/2009. International Symposium on Wearable
Computers; Institute of Electrical and Electronics
Engineers. Los Alamitos, Calif.: IEEE Computer
Society, pp. 147–148.
Kiefmann, Andreas; Krinninger, Maximilian; Lindemann,
Udo; Senner, Veit; Spitzenpfeil, Peter (2006): A New
Six Component Dynamometer for Measuring Ground
Reaction Forces in Alpine Skiing. In : The Engineering
of Sports 6, vol. 21. New York, NY: Springer, pp. 87–
92, checked on 11/17/2019.
Krueger, A.; Edelmann-Nusser, J.; Spitzenpfeil, P.; Huber,
A.; Waibel, K.-H.; Witte, K. (2006): A measuring
method for combined determination of the edging angle
and the ground reaction force in alpine skiing. In E.
Müller (Ed.): 24 International Symposium on
Biomechanics in Sports. With assistance of H.
Schwameder, G. Strutzenberger, V. Fastenbauer, S.
Lindinger. 24 International Symposium on
Biomechanics in Sports. Salzburg, July 14-16, 2006.
Lafontaine, D.; Lamontagne, M.; Dupuis, D.; Diallo, B.
(1998): Analysis of the distribution of pressures under the
feet of elite alpine ski instructors. In H. J. Riehle, M. M.
Vieten (Eds.): 16 International Symposium on
Biomechanics in Sports. 16 International Symposium on
Biomechanics in Sports. Konstanz, July 21-25, 1998.
Razak, Abdul Hadi Abdul; Zayegh, Aladin; Begg, Rezaul
K.; Wahab, Yufridin (2012): Foot plantar pressure
measurement system: a review. In Sensors, pp. 9884–
9912. DOI: 10.3390/s120709884.
Saito, Ayuko; Doki, Hitoshi; Kondo, Akiko; Hirose,
Kiyoshi (2015): An Attempt for Developing the
Measurement System of Reaction Force from Snow
Surface for Private Ski Boots by Compact Force
Sensors. In Procedia Engineering 112, pp. 326–331.
DOI: 10.1016/j.proeng.2015.07.257.
Schaff, P.; Senner, V.; Kaiser, F. (1997): Pressure
distribution measurements for the alpine skier - from
the biomechanical high tech measurement to its
application as Swingbeep-feedback system. In Erich
Müller (Ed.): Science and skiing. 1st ed. London, New
York: E & FN Spon, pp. 159–172.
Schwameder, H.; Nigg, B.; Tscharner, V.; Stefanyshyn, D.
(2001): The effect of binding position on kinetic
variables in alpine skiing. In Erich Müller (Ed.):
Science and skiing II. Tagungsband ; St. Christoph a.
Arlberg, Austria, January 9 - 15, 2000. With assistance
of H. Schwameder, C. Raschner, S. Lindinger, E.
Kornexl. Hamburg: Kovač (Schriftenreihe Schriften
zur Sportwissenschaft, 26), pp. 43–54.
Spitzenpfeil, P.; Huber, A.; Waibel, K. (2006): Mechanical
load and muscular expenditure in alpine ski racing. In
E. Müller (Ed.): 24 International Symposium on
Biomechanics in Sports. With assistance of H.
Schwameder, G. Strutzenberger, V. Fastenbauer, S.
Lindinger. 24 International Symposium on
Biomechanics in Sports. Salzburg, July 14-16, 2006.
Stricker, Gerhard; Scheiber, Peter; Lindenhofer, Elke;
Müller, Erich (2010): Determination of forces in alpine
skiing and snowboarding: Validation of a mobile data
acquisition system. In European Journal of Sport
Science 10 (1), pp. 31–41. DOI:
10.1080/17461390903108141.
Wimmer, M. A.; Holzner, R. (1997): Constraint Forces may
influence the measurement of vertical ground reaction
forces during slalom skiing. In Erich Müller (Ed.):
Science and skiing. 1st ed. London, New York: E & FN
Spon, pp. 208–215.
Measuring Pressure in Different Layers of the Ski Boot to Estimate Skiing Movements
35
