An Implementation of a Pseudo-beat Presentation Device Affecting
Emotion of a Smartphone Video Viewer
Masaki Omata
1
and Yuta Nakada
2
1
Graduate Faculty of Interdisciplinary Research, University of Yamanashi, Kofu, Yamanashi, Japan
2
Department of Computer Science and Engineering, University of Yamanashi, Kofu, Yamanashi, Japan
Keywords: Pseudo-beat, Heart Beat, Smartphone, Emotion, Video.
Abstract: We have developed a pseudo-beat presentation device that represents visual and tactile movements around a
smartphone for the purpose of affecting emotions of a video viewer. The device controls multiple solenoids
attached to the back of the smartphone and moves them as if they were human heartbeats in accordance with
an emotion of a video content on the smartphone. The results of a usability evaluation experiment of the
device showed that the heart rate of viewers who felt the pseudo-beats as their own heartbeats increased, and
that the pseudo-beats increased emotional arousal of a calm scene in a video.
1 INTRODUCTION
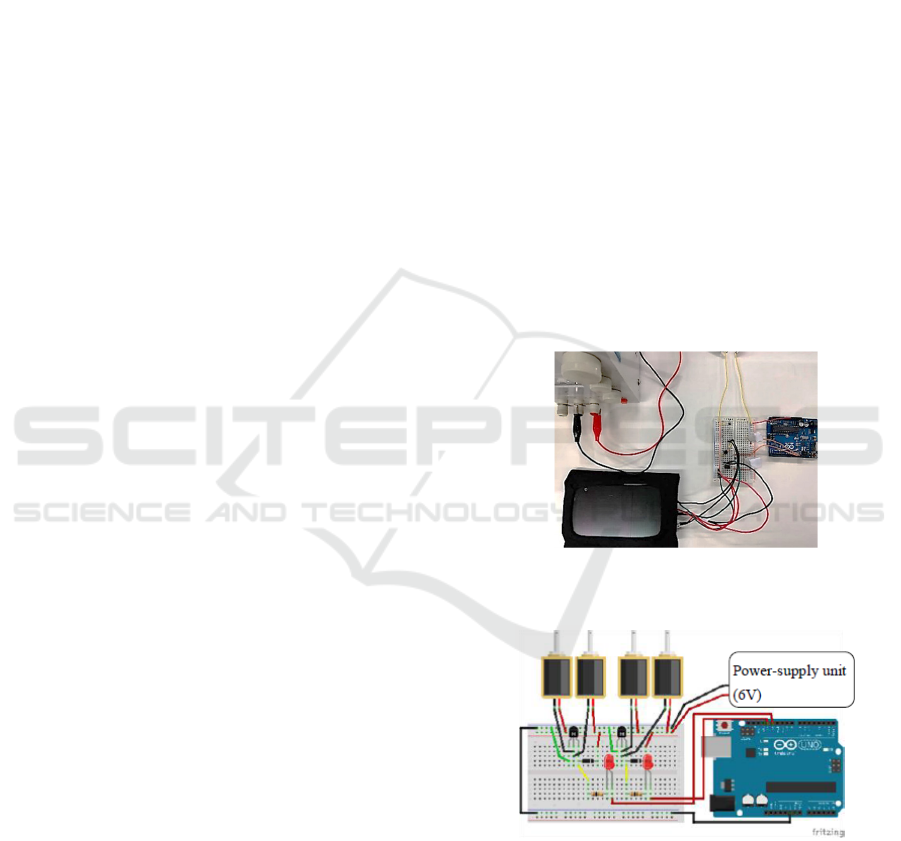
We have developed a device that enhances viewer’s
emotional experience by presenting pseudo-beats as
visual, pressure, and vibration sensation while
watching a video on a smartphone (see Figure1). As
shown in Figure 2, the device consists of four
solenoids attached around a smartphone. The
movements of each solenoid are interlocked to make
the smartphone appear to be moving like a human’s
heartbeat. The device is capable of presenting visual
as well as tactile movements to smartphone users. Our
goal is to emphasize the viewer’s emotional
experience by linking the beating cycle to a scene of
a video.
The reason for our idea is that it is difficult to
apply conventional methods of emphasizing
emotional experiences, such as displaying video on a
large screen or 4D technology that uses large-scale
devices such as wind and water spray, to
smartphones. Smartphone screens are getting larger
every year, but they will never be as big as a TV or a
movie theatre screen. Many smartphones are
equipped with a vibration actuator as a tactile
feedback device, but this vibration device only
conveys notification information and does not
provide enough stimulation to emphasize an
emotional experience.
There is a close relationship between human
physiological responses and emotions.
Figure 1: Pseudo-beat presentation device and its control
circuit.
Figure 2: Substantial wiring diagram of the control circuit.
Conventionally, it has been thought that emotions
are generated as a result of recognition of a situation
in response to stimuli from the external world, and
that they subsequently appear as changes in
physiological responses such as facial expressions
and pulse rates. However, in recent years, in the field
of cognitive psychology, a theory that some kind of a
Omata, M. and Nakada, Y.
An Implementation of a Pseudo-beat Presentation Device Affecting Emotion of a Smartphone Video Viewer.
DOI: 10.5220/0010649400003060
In Proceedings of the 5th International Conference on Computer-Human Interaction Research and Applications (CHIRA 2021), pages 149-157
ISBN: 978-989-758-538-8; ISSN: 2184-3244
Copyright
c
2021 by SCITEPRESS – Science and Technology Publications, Lda. All rights reserved
149

physiological response to a stimulus appears first, and
then the change is recognized and a specific emotion
is generated, has been proposed and is supported
positively (William, 1890, Stanley et al., 1962). In
addition, it has been shown that even a pseudo-
stimulus can affect emotions if the stimulus is
presented as if it were a change in one’s own bodily
response and is perceived as one’s own bodily
response (Stuart, 1966).
In this paper, we examined how visual and tactile
beating around a smartphone affected emotions of
video viewers using the proposed device. In the
verification experiment, we targeted emotions of fear
and tension, which are closely related to the
physiological and psychological responses to the
pulse, and which we believe are likely to respond as
negative emotions. We hypothesized that the
emotions would be amplified when viewers perceived
pseudo-beats linked to a scene while watching a
video. We recorded the viewers’ subjective
evaluation of the emotional changes and their blood
volume pulses (BVPs) as evaluation metrics.
The contributions of this paper are as follows:
The presentation of pseudo-beats has an effect on
pulse waves of a viewer. the heart rate of viewers
who feel the pseudo-beats as their own heartbeats
increases.
The presentation of the pseudo-beats increases the
emotional arousal of a calm scene in a video.
2 RELATED WORK
This section introduces some research studies on
influencing users’ emotions by using changes in
pseudo-physiological responses.
Sakurai et al. developed “Communious Mouse”
that rewrites user’s perception of his/her skin
temperature and pulse in his/her palm by representing
false-bodily temperature and pulse beat in accordance
with emotions, which are included in remarks pointed
by the mouse cursor, in order to evoke his/her
emotion (Sakurai et al., 2016). The mouse exhibited
to over 150 people and it revealed that the mouse was
able to help users to experience others’ emotions.
However, the score for “happiness” was lower than
the valuations for other emotions. They reported that
it seemed to be difficult to evoke “Happiness” only
because of the physiological comfort.
Ueoka et al. developed an Emotion Hacking VR
(EH-VR) that hacks one’s heartbeat and controls it to
accelerate scary VR experience by detecting user’s
heart rate in real time and calculates false heart rate,
which is faster than the one observed. (Ueoka et al.,
2016). The system edited a heartbeat sound as a
sampling sound of a cycle of heartbeat for giving
vibrotactile feedback.
Mikami et al. proposed a system to enhance
listener’s music experience by improving his/her
immersive feelings toward the music by inscribing
rhythm with his/her fingertip using electric muscle
stimulator (Mikami et al., 2018). The results of their
experiment showed that, although the system
increased immersion in the music experience for
some listeners, it decreased immersion for others
because of differences in rhythmic timing and
matching to the music due to differences in music
preference and musical experience.
Fukushima et al. focused on piloerection which
was a kind of involuntary emotional reaction and
constructed a device that controlled the piloerection
on listener’s forearm by electrostatic force in order to
enrich the quality of experiment (Fukushima et al.,
2011). Their experiments showed that the device
increased the value of surprise in the subjective
evaluation and the duration of surprise in the skin
conductance values.
The differences between the device proposed in
this paper and the ones introduced here are that the
proposed device is simpler, easier for users to handle,
and more familiar to users because it targets emotions
in video viewing with smartphones.
3 PSEUDO-BEAT
PRESENTATION DEVICE
We installed a device around a smartphone that
makes the smartphone appear to beat as a pseudo-
heart in order to make a viewer feel as if his/her own
heartbeats are changing in accordance with scenes in
a video. In this section, we describe the
implementation of the device in detail.
3.1 Design
Since the average normal pulse rate of a person over
the age of 10 is between 60 bpm and 100 bpm
(American Heart Association website, 2021), our
system also sets five pulse rate levels: 60 bpm, 67
bpm, 75 bpm, 85 bpm, and 100 bpm.
In this study, we use Lang et al.’s two-
dimensional emotion model (Lang, 1995), which
consists of emotion valence and arousal, to handle
emotions quantitatively. Emotional valence
represents the positive and negative aspects of an
emotion. On the other hand, the arousal level repre-
CHIRA 2021 - 5th International Conference on Computer-Human Interaction Research and Applications
150
sents the intensity of the emotion.
As a relationship between the beating rate of the
device and the emotion of a video scene, in a horror
movie scene where the emotional value is negative
and the arousal level is gradually increasing, the
beating rate of the device is gradually increased from
low to high in accordance with the deployment of the
scene. On the other hand, in a landscape movie where
the emotional value and arousal level are neutral, the
beating rate is kept constant at 60 bpm.
3.2 Implementation
Four push-type solenoids (rated voltage DC 6 V - 48
V, 1.2 W) were used for the implementation of the
beating. LG Nexus 4 (133.9 x 68.7 x 9.1mm) was
used as the smartphone. Two of the solenoids were
attached to the backside of the bezels of the two long
sides of the smartphone, so that the movement
direction of the moving parts was vertically outward
from the long sides (see Figure 3). A wooden stick of
the same length as the long side was attached to
connect the moving parts of the two solenoids so that
each long side would appear to be beating. To make
these devices and the smartphone appear to be
integrated, the entire bezel of the smartphone was
covered with an elastic fabric, as shown in Figure 1.
Arduino UNO (Arduino, 2021)) and Processing
(Fry and Reas, 2021) were used to control the pseudo-
beat presentation device (see Figure 1 and 2). Since
this is a prototype at this time, we used an external
power supply of 6V to operate the solenoids, instead
of the smartphone power supply. The LEDs on the
breadboard shown in Figure 2 are feedback circuits
for checking the operation, and are not directly related
to the operation of the pseudo-beat presentation
device.
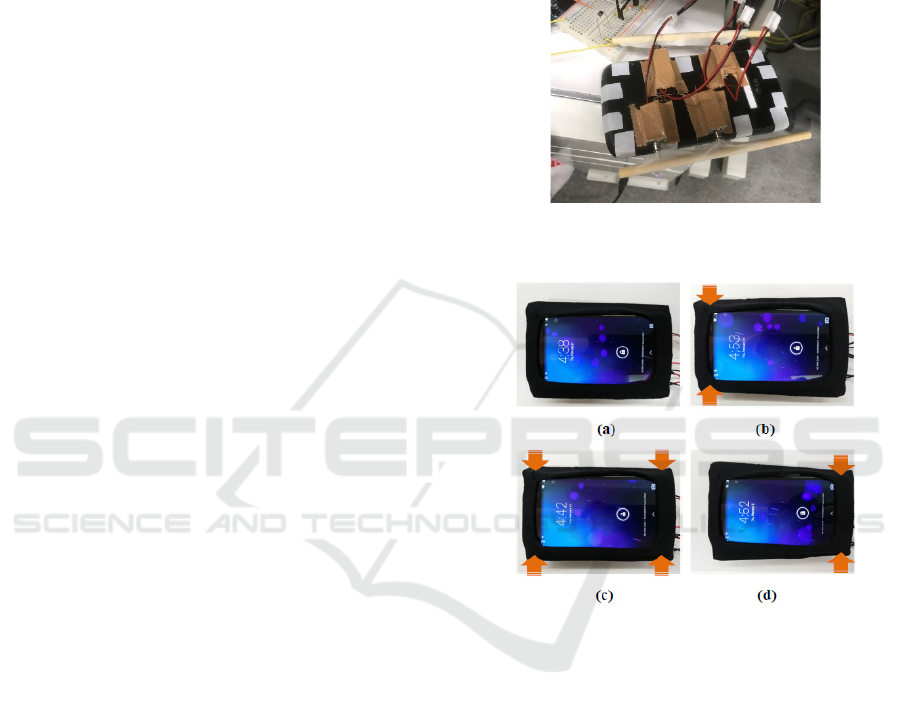
In order to make the entire smartphone appear to
be beating by the movement of the four solenoids, the
left and right sides of the smartphone were made to
look like an atrium and a ventricle, respectively, when
it was placed horizontally. Specifically, the outward
motion of the solenoids on the same side of the
smartphone was set to the same timing, and the
motion timing of the solenoids on the left and right
sides was shifted by 150 ms. Figures (a) to (d) in
Figure 4 show the sequence of the operation. Figure
4a shows that all solenoids are not energized and the
all moving parts are extended. Figure 4b shows that
the voltage is applied to the two solenoids on the left
side, and the movable parts of them are contracted.
Figure 4c shows that the right solenoids contract after
a delay of 150ms while the left two solenoids are
contracted. Figure 4d shows that the solenoids on the
right side have contracted while the solenoids on the
left side have extended to its original state with no
voltage applied. Finally, the right side of the
solenoids are also de-energized and return to the state
shown in Figure 4a. The sequence of the movements
is repeated according to the beat frequency specified
by the software.
Figure 3: Arrangement of four solenoids and two wooden
sticks.
Figure 4: The movement of the pseudo-beat. The left and
right solenoids expand and contract synchronously in the
order from (a) to (d).
4 EXPERIMENT ON SELECTION
OF EMOTIONAL VIDEOS
Before evaluating the effectiveness of our proposed
pseudo-beat presentation device, we conducted an
experiment to select videos to be presented in the
evaluation experiment. In this experiment, we asked
viewers to watch candidate videos and assess their
emotions on the videos. Based on the results, we
selected the videos whose emotional evaluation was
far from neutral and whose variation was small
among the viewers to evaluate the effectiveness of
our proposed system.
An Implementation of a Pseudo-beat Presentation Device Affecting Emotion of a Smartphone Video Viewer
151
4.1 Experimental Stimuli and
Participants
We chose four horror videos, four landscape videos,
four narrative TV commercial videos, and a roller
coaster passenger’s view video from YouTube as the
videos used in this experiment. The horror videos and
the narrative TV commercial videos were separated
into some scenes in which we thought the levels of
arousal changed within each video, and the
participants were asked to assess emotions in the
scenes.
Ten male undergraduate or graduate students
between the ages from 19 to 23 participated in this
experiment. All participants were in the habit of
watching videos almost every day.
4.2 Experimental Environment and
Procedure
We asked each participant to use his own smartphone
for watching the videos. The location and time of
viewing were not specified, but were decided freely
by each participant. However, we instructed the
participants not to use a tablet in order to avoid
influence of screen size on their emotions (Hatada et
al., 1979). We also instructed the participants to wear
earphones or headphones in order to prevent sounds
other than the video from coming from outside.
Because we wanted the participants to accurately
assess emotions of the videos, we instructed them that
they could watch the videos multiple times.
We used the Self-Assessment Manikin (Bradley
et al., 1994) as a questionnaire for the emotional
assessment of each video and scene. The participants
were presented with a chart showing nine levels of
mannequins for emotional valence and arousal, and
were asked to select one of the mannequins that
corresponded to levels of emotional valence and
arousal of a video or a scene they viewed. We used
Google Form for the questionnaire survey.
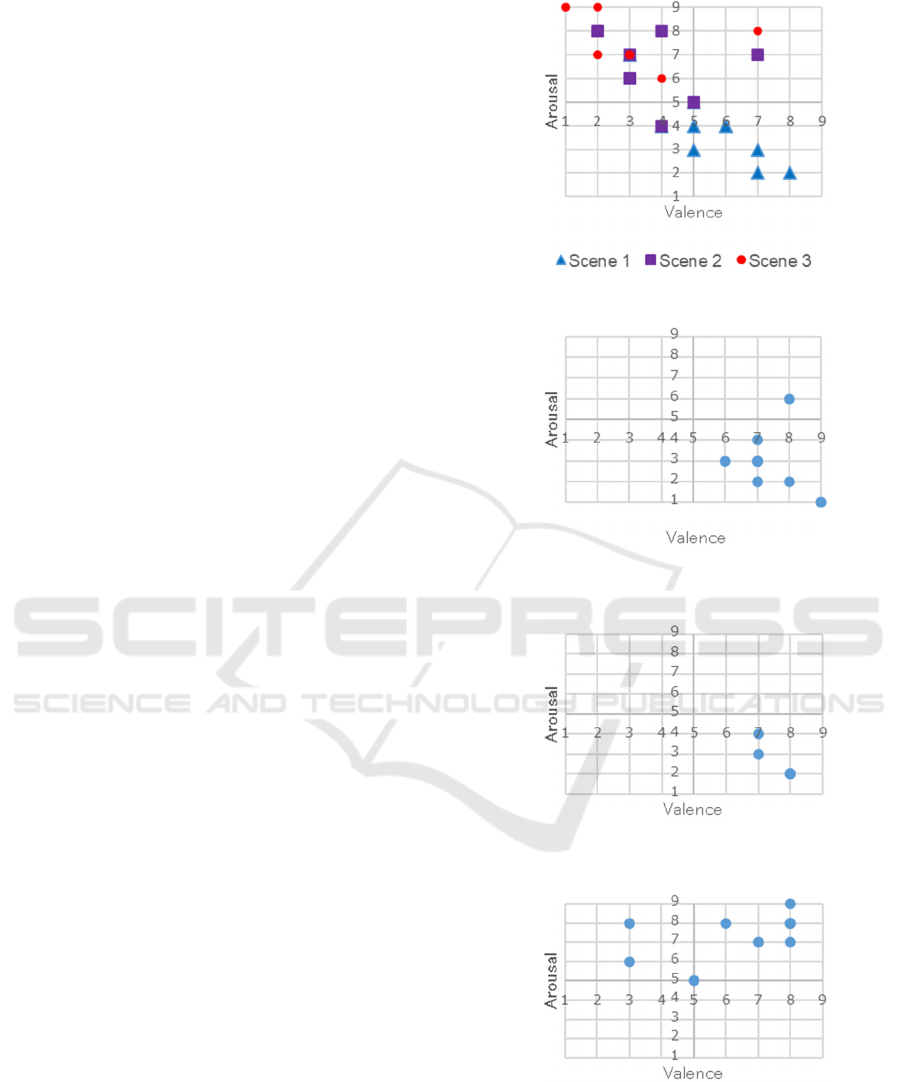
4.3 Results
All four horror videos showed high arousal with
negative emotional valence. The distribution of the
responses of all participants in three scenes of one of
the horror videos is shown in Figure 5.
Three of the landscape videos and three of the TV
commercial videos resulted in lower arousal with
positive emotional valence, as shown in Figure 6 and
Figure 7, which are representative of one of them.
Figure 5: Emotional assessment results of a horror video.
Figure 6: Emotional assessment results of a landscape
video.
Figure 7: Emotional assessment results of a TV commercial
video.
Figure 8: Emotional assessment results of a roller coaster
video.
As shown in Figure 8, the video from the
perspective of a passenger on a roller coaster had
positive emotional valence and high arousal.
CHIRA 2021 - 5th International Conference on Computer-Human Interaction Research and Applications
152

Based on the results, we decided to use 10 of the
13 videos to evaluate ours proposed system,
excluding the videos whose emotion ratings were
neutral in terms of both emotion valence and arousal
and the videos whose individual differences were
large. In addition, since the tendency of the emotional
assessments of the landscape videos and the TV
commercial videos was similar, both were classified
as landscape videos in the next experiment.
5 EVALUATION EXPERIMENT
OF PSEUDO-BEAT
PRESENTATION DEVICE
We conducted an experiment to validate whether the
use of a pseudo-beat presentation device while
watching a video on a smartphone can increase the
emotional response of the video viewer.
The independent variable in this experiment is the
presence or absence of the pseudo-beat presentation
device. The dependent variables are emotional
valence, arousal, and dominance values of a video as
subjectively evaluated by the viewers based on the
three-dimensional emotion model (Lang, 1980) and
pulse rate of the viewer’s fingertip blood volume
pulses (BVPs) as a psychophysiological index.
The participants were 10 male university students
aged 19 to 22 years, and the design was a between-
subjects design with five participants in the
experimental group using the pseudo-beat
presentation device and other five participants in the
control group not using it. All participants were in the
habit of watching videos almost every day.
5.1 Experimental Stimuli
The participants viewed the 10 videos selected in
Section 4. Table 1 shows the numbers assigned to the
videos, the genre of the videos, and the number of
scenes in each video. Table 2 shows the number of
beats of the pseudo-beat presentation assigned to each
scene and its timing (elapsed time from the start of
playback). The pseudo-beats continued to be
presented throughout the viewing of the subjects in
the experimental group. The number of beats and the
timing of the beats were designed by the authors after
watching the video scenes, and were pre-programmed
into the pseudo-beat presentation system to change
according to the contents of the scenes. The beats for
the videos from No. 6 to No. 10(in the landscape
genre) was kept constant at 60 bpm.
Table 1: Videos as experimental stimuli.
No. Genre Num. of scenes and the scene No.
1 Horro
r
3 (1.1, 1.2, 1.3)
2 Horro
r
3 (2.1, 2.2, 2.3)
3 Horro
r
3 (3.1, 3.2, 3.3)
4 Horro
r
2 (4.1, 4.2)
5 Roller coaste
r
1
6 Landscape 1
7 Landscape 1
8 Landscape 1
9 Landscape 1
10 Landscape 1
Table 2: Timing and tempo of pseudo-beat changes.
No. of scene Timing (sec): Num. of beats (bpm)
1.1 0: 60, 36: 67, 50: 60
1.2
0: 60, 14: 67, 20: 75, 25: 67, 36: 85,
42:85, 46: 75
1.3
0: 67, 8: 75, 18: 85, 35: 100, 56: 85,
69: 75, 78: 85, 87: 75
2.1 0: 60, 20: 67, 38: 75
2.2
0: 67, 9: 75, 21: 85, 30: 75, 63: 85,
71: 75
2.3 0: 75, 19: 85, 51: 100
3.1 0: 60, 8: 67
3.2 0: 67, 11: 75, 64: 67
3.3 0: 67, 19: 75, 31: 85, 83: 100
4.1 0: 60
4.2
0: 60, 7: 67, 19: 75, 88: 67, 105: 75,
111: 85, 132: 100
5 0: 60, 5: 67, 15: 75, 23: 85
5.2 Experimental Environment
Figure 9 shows the experimental environment and a
participant watching a video. The experiment was
conducted in a laboratory with a constant room
temperature in order to control the influence of
external factors on emotion and BVPs. In addition,
the participants were asked to wear headphones in
order to avoid the influence of external sounds.
Figure 9: Experimental environment and task.
A Thought Technology’s BVP sensor was used as
the pulse wave sensor, and was attached to tip of
index finger of the participant’s non-dominant hand.
An Implementation of a Pseudo-beat Presentation Device Affecting Emotion of a Smartphone Video Viewer
153
The signals of the sensor were recorded on a laptop
computer via Thought Technology’s ProComp
Infiniti System.
5.3 Experimental Procedure
Informed consent was given before start of each
participant’s experiment.
In conducting the experiment for each participant,
the experimenter first explained to a participant how
to answer questionnaire survey. As in Section 4, the
method of answering the questionnaire was to select
one of the nine levels for emotional valence, arousal,
and dominance for each scene. After the explanation,
the participant was asked to play and stop a practice
video for each scene and answer the three
components of emotion in the scene as a practice. In
between scenes, a slide showing the number of the
next scene was displayed for 4 seconds.
Next, the experimenter attached the BVP sensor
to the participant, asked him to close his eyes, and
recorded his pulse waves during one minute of his
normal condition.
After that, the participant repeated the
experimental task of watching a scene from all the
videos specified in random order and answering the
three components of subjective emotion of the scene.
At this time, the control group received no feedback
on the pseudo-beats, while the experimental group
received feedback on the pseudo-beats according to
the scene based on Table 2. In the actual
implementation, the number of beats and timing of
the pseudo-beats were pre-programmed, but as a
Wizard of Oz method, each participant of the
experimental group was instructed that the beats were
a feedback of their own pulses. Although the linkage
between emotions and pseudo-beats was not
mentioned at all during the experiment, the
instruction led the participants of the experimental
group to believe that their pulse waves were linked to
the movements of the device around the smartphone.
After watching all the videos, the participant
answered a question about whether he felt the pseudo-
beats were linked to his own pulses or not.
5.4 Results
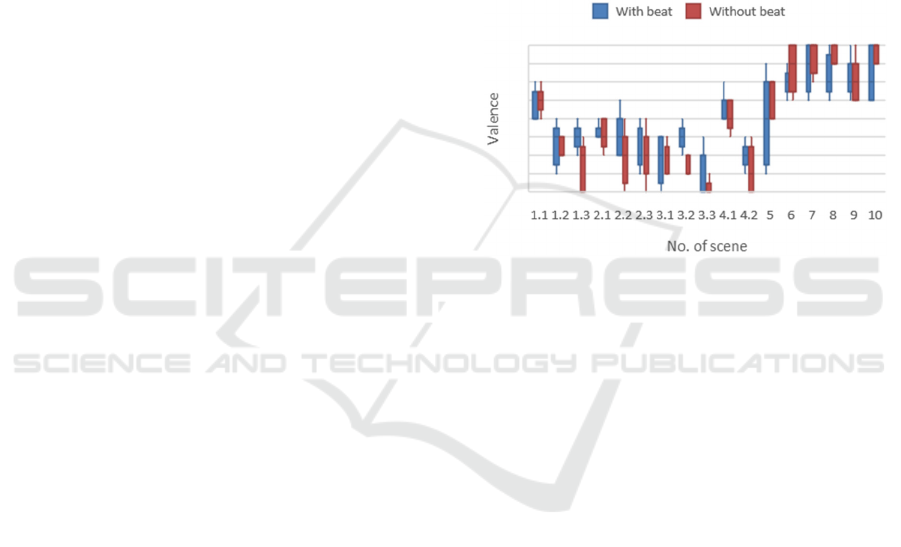
5.4.1 Questionnaire on Emotion
Figure 10 shows the results of the assessments of the
emotional valences of all participants for each scene
with and without the presentation of the pseudo-beat.
The vertical axis of the graph shows the emotional
valence, with 5 being neutral among the nine levels,
and the higher the value, the more positive the
emotion, and the lower the value, the more negative
the emotion. The results of a Wilcoxon rank sum test
showed that the difference in emotional valence
between the videos with and without pseudo-beats
was significantly closer to neutral and the degree of
negativity was weaker in the horror videos (No. 1 to
4) (p < 0.05). For the roller coaster video (No. 5), it
was found that the presentation of the pseudo-beats
resulted in a significantly negative response (p <
0.05). As a scene-by-scene test, the emotional
valences of scenes 1.3 and 3.2 were found to be
significantly closer to neutral (p < 0.05) when the
pseudo-beat was presented.
Figure 10: Results of subjective emotional valence.
Figure 11 shows the results of the evaluation of
the arousal level of all participants for each scene with
and without the presentation of the pseudo-beat. The
vertical axis of it shows the level of arousal, with 5
being neutral among the nine levels. The higher the
value, the higher the level of arousal, and the lower
the value, the lower the level of arousal. As a result,
for each scene in the horror movie, some scenes
showed an increase in arousal due to the presentation
of the pseudo-beats, while others showed a decrease.
A Wilcoxon rank sum test was performed on the
results of the landscape videos, and it was found that
the presentation of the pseudo-beats tended to
increase the level of arousal (p < 0.1). As a result of
the test for each scene, it was found that the
presentation of the pseudo-beats tended to increase
the level of arousal in scene 2.1 (p < 0.1).
Figure 12 shows the results of the dominance of
all participants in each scene with and without the
pseudo-beat. As in the previous figures, 5 is neutral,
and a value lower than 5 indicates less dominance,
while a value higher than 5 indicates more
dominance. From the figure, it can be seen that the
variance of the assessment value becomes smaller
when the pseudo-beats were presented in the horror
videos (No. 1 to 4). The test of homogeneity of
CHIRA 2021 - 5th International Conference on Computer-Human Interaction Research and Applications
154
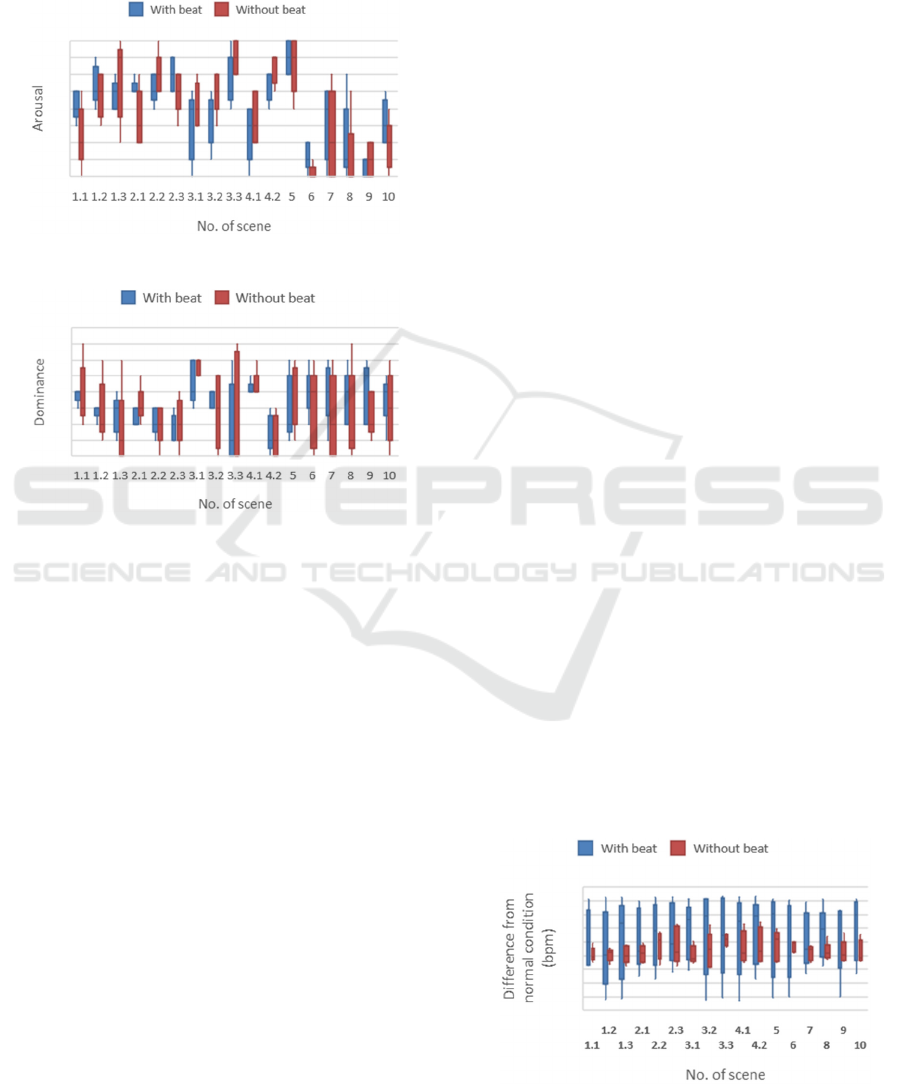
variance showed that the variance was smaller when
the pseudo-beats were presented than when they were
not presented in scenes 1.1, 1.2, 1.3, 2.1, 3.2, and 4.1.
There were no significant differences for the presence
or absence of pseudo-beat in any of the scenes.
Figure 11: Results of subjective emotional arousal.
Figure 12: Results of subjective emotional dominance.
5.4.2 BVP
Figure 13 shows the differences between the average
pulse rate during normal condition and the average
pulse rate while watching each scene for all
participants with and without pseudo-beating.
Therefore, 0 in this graph indicates that there was no
difference from the normal value, and the positive
side indicates that the value was higher during the
viewing. A Wilcoxon rank sum test was used to test
the difference in pulse rate between those with and
without the pseudo-beats. The results showed that the
pulse rate was significantly higher when the pseudo-
beats were presented than when they were not.
About the question, “Did the pseudo-beats feel
like your own pulses?,” three out of five participants
of the experimental group answered that they felt it.
Figure 14 shows the pulse differences between the
three who answered that they felt their own pulse, and
Figure 15 shows the pulse differences between the
two who answered that they did not feel them. As can
be seen from these graphs, the pulse rates of the three
participants who felt that the pseudo-pulses were their
own pulses were higher than normal, while the pulse
rates of the two participants who did not feel them
were lower than normal.
6 DISCUSSIONS
The results of the questionnaire on emotional valence
show that the experimental group’s rating values were
closer to neutral than those of the control group. This
suggests that the pseudo-beat had the effect of
reducing the amplitude of the emotional valence. This
may be due to the fact that the beating interfered with
the viewer’s concentration on the video contents.
The results of the questionnaire on arousal show that
when pseudo-beats are presented, the level of arousal
tends to be higher or lower depending on the scene in
horror videos. The scenes with a lower level of
arousal were 1.3, 2.2, 3.1, 3.2, 3.3, 4.1, and 4.2.
Among them, the surprising scenes where something
suddenly appears with a loud sound are 1.3, 2.2, 3.2,
3.3, and 4.2. This indicates that the proposed system
is not effective enough to further increase level of
arousal in such a scene where the level suddenly
increases. A reason for the result may be that the
beating was always given in this experiment and the
changes in heart rate were discrete. In this experiment,
the beating was always given to the experimental
group because the difference between the two groups
was investigated. However, in actual use, we believe
that the effect of the beating can be more clearly
shown by setting a scene in which the beating is
presented and another scene in which it is not
presented at all. Additionally, in a future
improvement, based on physiological findings, we
are considering a continuous gradual increase and
decrease of the heart rate according to a scene and an
actual heart rate of a viewer. Since the presentation of
pseudo-beats tends to increase arousal in scenes with
gradual changes in arousal, such as landscape videos,
it is expected to be effective in increasing arousal in
videos with gradual changes in arousal.
Figure 13: Results of difference in heart rates from normal.
An Implementation of a Pseudo-beat Presentation Device Affecting Emotion of a Smartphone Video Viewer
155
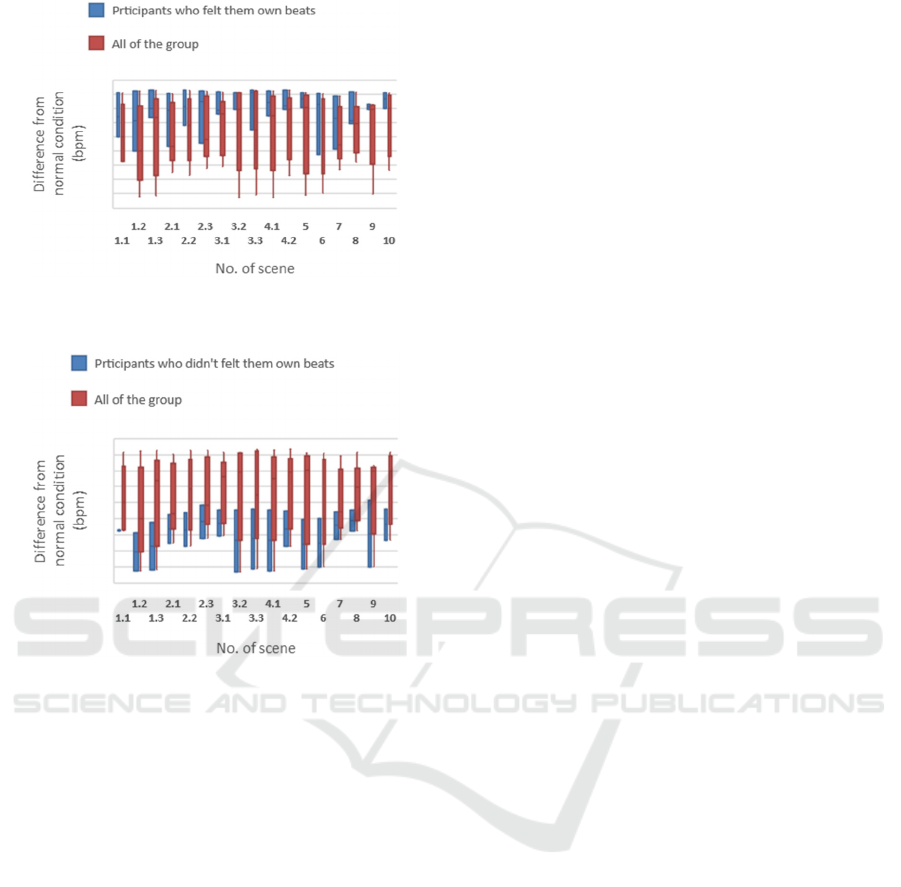
Figure 14: Differences in heart rates of participants who felt
the pseudo-beats as their own pulses.
Figure 15: Differences in heart rates of participants who did
not feel the pseudo-beat as their own pulses.
The results of the questionnaire survey on
dominance show that the variance of the evaluation
value becomes smaller when the pseudo-beat is
presented. The reason for this is that the same pseudo-
beats were presented to the participants in the
experimental group at the same timing, suggests that
the presentation of pseudo-beats may cause viewers
to be more synchronized to the assessments of the
dominances. On the other hand, there was almost no
difference in the bias of the dominance assessment
values between the experimental group and the
control group, indicates that the presentation of the
pseudo-beats did not have any effect on reversing the
dominance.
The results of the BVP analyses show that when
viewers feel the pseudo-beat as their own pulses, their
pulse rate increases. Therefore, if we can make the
pseudo-beats feel more like their own pulse in terms
of movement and period, we think that the system
will be able to intentionally influence or intentionally
control the physiological responses of viewers. To
meet the new challenge, we are planning to link actual
pulse waves of a viewer to the pseudo-beat as a future
improvement. Specifically, we will design a system
that acquires pulse waves and heart rate from a
smartwatch or similar device while watching a video,
passes them through a Psychophysiological effector
to generate intended pseudo-pulse waves, and then
reflects them to the pseudo-pulse presentation device.
In addition, we will implement the loop that acquires
and evaluates changes in viewer’s pulse waves and
heart rate during presentation of the pseudo-beats,
and adjusts them to move toward the more intended
changes.
7 CONCLUSIONS
In this study, we aimed to control viewer’s emotion
by presenting visual and tactile pseudo-beats around
a smartphone during video viewing. For the purpose,
we attached four solenoids to a smartphone and
moved them as if they were beating of a human heart,
and set their beating cycles according to contents of a
video.
Using the device, we conducted an experiment in
which participants in the experimental group were
asked to experience pseudo-beats while watching
horror, roller coaster, and landscape videos, and were
compared to the control group in which no pseudo-
beats were presented. The results of the questionnaire
survey showed that neither emotional valence,
arousal, nor dominance were generally raised or
lowered by the pseudo-beats, but there was a
tendency for them to be raised or lowered depending
on the scene of the video.
On the other hand, physiological BVPs showed
that the heart rate was significantly higher in the
experimental group in which the pseudo-beat was
presented than in the control group in which it was
not presented. In particular, the heart rates of the
participants who felt that the pseudo-beats were their
own pulses were higher than normal conditions of
them.
Based on the results, we conclude that while the
presentation of pseudo-beats using the proposed
system has an effect on the physiological pulse
waves, it does not have a strong effect on the
subjective emotional assessments. However, since
physiological and psychological findings indicate
that changes in physiological responses may
influence psychological responses (Stuart, 1966), we
will improve our system to provide intended
influence on subjective emotions as well.
In our future research, we will implement a
function to link the pseudo-beat presentation device
CHIRA 2021 - 5th International Conference on Computer-Human Interaction Research and Applications
156

to actual pulse waves of a video viewer. Specifically,
we plan to implement a data logger that acquires pulse
waves from the viewer’s smartwatch during video
viewing, an effector that intentionally increases or
suppresses the emotions in the video content, an
analyser that automatically calculates the emotional
valence, arousal, and dominance from the video and
audio of each scene, and a synthesizer that controls
the pseudo-beat presentation device according to the
results of the analyser and the effector, and conduct
the same evaluation experiments as in this paper.
Furthermore, as a long-term experiment, we plan to
investigate effects on emotions during initial use and
after long-term use, and to validate temporal changes
in habituation to our proposed device.
REFERENCES
American Heart Association website. (Retrieved May 17,
2021). All About Heart Rate (Pulse). from
https://www.heart.org/en/health-topics/high-blood-
pressure/the-facts-about-high-blood-pressure/all-
about-heart-rate-pulse.
Arduino. (Retrieved May 17, 2021). Arduino UNO. from
https://store.arduino.cc/usa/arduino-uno-rev3.
Bradley, M. M., Lang, P. J. (1994). Measuring emotion:
The self-assessment manikin and the semantic
differential. In Journal of Behavior Therapy and
Experimental Psychiatry, 25(1), 49–59.
Fry, B., Reas, C. (Retrieved May 17, 2021). from
https://processing.org/.
Fukushima, S., Kajimoto, H. (2011). Enhancement of
Surprise Feelings by Controlling Piloerection on the
Forearm. In The 16th annual conference of the VRSJ,
NO.11C-5.
Hatada, T., Sakata, H., Kusaka, H. (1979). Induced Effect
of Direction Sensation and Display Size. In The Journal
of the Institute of Television Engineers of Japan. 33(5),
407–413.
Lang, P. J. (1980). Behavioral treatment and bio-behavioral
assessment: Computer applications. In Technology in
mental health care delivery systems. 119–137.
Lang, P. J. (1995). The emotion probe: Studies of
motivation and attention. American Psychologist,
50(5), 372–385.
Mikami, N., Ogawa, T. (2018). Study On Emotion
Enhancement Method Using Electrical Muscle
Stimulation For Improving Music Experience. In IPSJ
SIG Technical Report, 2018(42), 1–6
Sakurai, S., Ban, Y., Katsumura, T., Narumi, T., Tanikawa,
T., Hirose, M. (2016). Sharing Emotion Described as
Text on the Internet by Changing Self-physiological
Perception. In Proceedings of the Fourth International
Conference on Human Agent Interaction (HAI ’16).
Association for Computing Machinery, 145–153.
Stanley, S., Jerome, S. (1962). Cognitive, social, and
physiological determinants of emotional state.
Psychological Review, 69(5), 379–399.
Stuart, V. (1966). Cognitive effects of false heart-rate
feedback. In Journal of Personality and Social
Psychology, 4, 400–408.
William, J. (1890). The Principles of Psychology, Courier
Dover Publications. Vol. 2.
An Implementation of a Pseudo-beat Presentation Device Affecting Emotion of a Smartphone Video Viewer
157
