
Perceptual Active Equalization of Multi-frequency Noise
Juan Estreder, Gema Pi
˜
nero
a
, Miguel Ferrer
b
, Maria de Diego
c
and Alberto Gonzalez
d
Inst. Telecommunication and Multimedia Applications (iTEAM),
Universitat Polit
`
ecnica de Val
`
encia, Spain
Keywords:
Active Noise Equalization, Frequency Masking, Perceptual Equalization, Multi-channel Adaptive Filtering.
Abstract:
In this paper we propose a novel multi-channel active noise equalizer (ANE) when music or speech signals
are present inside the same room. Our perceptual ANE (PANE) can benefit from the masking effect of the
music emitted carrying out a perceptual equalization (PEQ) of the undesired ambient noise. Our PEQ strategy
automatically adapts the spectral profile of the ambient noise recorded at the error microphones to the masking
threshold of the audio signal recorded at that same point. We present a real-time experiment carried out in
our laboratory that simulates the position of a driver in a car to test the PANE with different audio signals.
The experimental results are compared with two alternative strategies: the full cancellation (FC) profile that
corresponds to an active noise cancellation strategy, and the hearing threshold (HT) profile that corresponds
to an ANE system whose gains mimic the human audibility threshold. Both FC and HT profiles are indepen-
dent of the music presented in the room. Results show that the noise power measured at the microphones is
higher for the PEQ profile, but always below the masking threshold of the music, getting almost unnoticeable.
However, the emitted anti-noise power in the case of PEQ is 15 dB lower compared to HT and FC profiles for
frequencies above 300 Hz. This performance leads to a reduction of noise pollution in the room and a lower
power consumption of the system loudspeakers. In addition, the PEQ profile provided by the novel PANE sys-
tem is a versatile approach that can reduce the perceived noise as much as the user decides, even reaching the
same performance than the HT or FC profiles if needed. Therefore, the PANE system is a versatile real-time
alternative to the classic active noise cancellation systems for multi-frequency noise.
1 INTRODUCTION
The way we perceive sounds has been studied from
a systematic point of view over the last few decades
giving rise to the field of psychoacoustics (Fastl and
Zwicker, 2007; Pickles, 2012). This approach to
the human hearing system models the process that a
sound undergoes from the moment it enters our outer
ear until it reaches our neurological system and be-
yond. This knowledge has been widely used in sev-
eral signal processing areas, such as coding (Branden-
burg and Johnston, 1990), equalization (V
¨
alim
¨
aki and
Reiss, 2016), personal sound zones (Donley et al.,
2016), or noise cancellation (Wang et al., 2018;
Mosquera-S
´
anchez et al., 2018). Generally speaking,
the field of pyschoacoustics provides a more realis-
tic approach to any sound or noise processing since it
a
https://orcid.org/0000-0002-8719-8106
b
https://orcid.org/0000-0002-8743-1887
c
https://orcid.org/0000-0001-9948-3396
d
https://orcid.org/0000-0002-6984-3212
takes into account how our hearing system perceives
sounds (Fletcher, 1940).
From this perceptual point of view, we revisit
in this paper the active noise equalizer that was
first proposed by Kuo (Kuo and Tsai, 1994). This
very first idea of an active noise control system that
could shape the spectrum of the residual noise was
further developed for multi-frequency noise and
named “adaptive noise equalizer” (Kuo and Ji, 1995).
Afterwards it was extended for a multi-channel active
noise equalizer (ANE) in (Gonzalez et al., 2006),
where the equalization parameters that controlled
each single frequency were arbitrarily selected. In
the present paper we revisit the algorithm proposed
in (Gonzalez et al., 2006) and go a step further
introducing a perceptual strategy to control the
ANE. This strategy benefits from the masking effect
that a sound (music or speech) produces over the
ambient noise, as for example it happens within a
car where its entertainment system can emit music
and can also be used to actively control the car noise.
Estreder, J., Piñero, G., Ferrer, M., de Diego, M. and Gonzalez, A.
Perceptual Active Equalization of Multi-frequency Noise.
DOI: 10.5220/0010648100390047
In Proceedings of the 18th International Conference on Signal Processing and Multimedia Applications (SIGMAP 2021), pages 39-47
ISBN: 978-989-758-525-8
Copyright
c
2021 by SCITEPRESS – Science and Technology Publications, Lda. All rights reserved
39

The idea of using the human perception model to
improve some performance of an active noise can-
cellation (ANC) system has been previously studied.
In (Wang et al., 2012), a two-stage ANC approach
is proposed where a carefully designed masking sig-
nal is used to mask the residual noise, whereas (Wang
et al., 2018) takes advantage of the temporal post-
masking effect in order to improve the noise loud-
ness at the ANC output. The patent by Doclo (Doclo,
2016) controls the filter shape of the ANC system ac-
cording to some audio signal, which is the same idea
that the one explored in this paper. However, in (Do-
clo, 2016) the design of the ANC filters are obtained
through an iterative optimization process, which is
difficult to achieve in real-time systems (increasing
the active performance in a certain frequency region
typically reduces the active performance in another
frequency region).
In this paper, a multi-channel real-time ANE sys-
tem (Gonzalez et al., 2006) that shape the residual
noise according to a certain masking threshold is pro-
posed, and its performance is compared to other two
profiles for different types of musical sounds. We
have selected excerpts from two different music gen-
res, one Latino-type and one Jazz-type. The noise is
a multi-frequency noise similar to that generated by a
diesel engine and other rotating machines (Ho et al.,
2020). The system performance in terms of noise at-
tenuation, mean squared error of the recorded music
signal and anti-noise power emitted by the loudspeak-
ers are analysed. It can be appreciated how the per-
ceptual equalization based on the ambient music can
reduce the emitted anti-noise power without compro-
mising the perceived quality of the music.
The rest of the paper is organized as follows: In
Section 2, relevant concepts regarding active noise
control and the computation of the masking thresh-
old are reviewed. In Section 3, the strategy to imple-
ment a perceptual ANE is stated. In Section 4, the
real-time ANE experiment mounted in our laboratory
is described and their results are shown, together with
a discussion on the system performance obtained for
the different equalization profiles and types of music
signals. Finally, Section 5 presents the main conclu-
sions of the paper.
2 SYSTEM MODEL
This section states the model of the ANE system and
describes the process to compute the masking thresh-
old of a sound in the frequency domain, also known
as simultaneous masking (Fastl and Zwicker, 2007).
Once these previous concepts are explained, the prin-
ciples of the perceptual equalization strategy will be
described in Section 3.
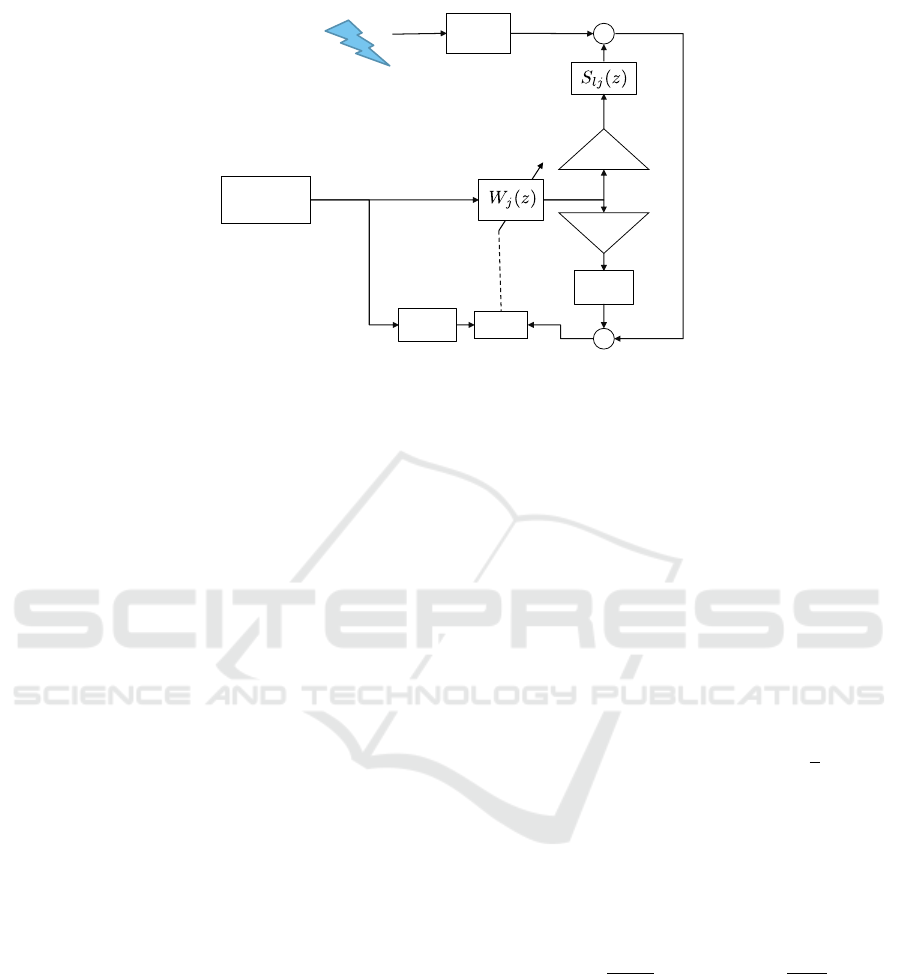
2.1 Active Noise Equalization
As said before, the ANE system presented in this pa-
per is based on the multi-channel model described
in (Gonzalez et al., 2006). Fig. 1 shows the block
diagram of the ANE system designed to equalize
the multi-frequency noise. The multi-channel sys-
tem is formed by J secondary sources and L error
sensors (or microphones), although Fig. 1 describes
the signal processing for one generic error sensor
l and one generic loudspeaker j. The output of
the sinusoidal generator is the reference signal x(n)
composed by K sine waves denoted by x
k
(n) with
k = 1,... ,K. Therefore, the adaptive filter W
j
(z) is
formed only by two-coefficients for each component
and secondary source (Kuo and Ji, 1995): W
j
(z) =
[w
j1,1
,w
j1,2
,. .. ,w
jK,1
,w
jK,2
].
The noise arriving at the lth microphone is de-
noted by d
l
(n). Then, the recorded signal at the lth
error sensor is expressed as
e
l
(n) = d
l
(n) +
K
∑
k=1
(1 − β
k
)
J
∑
j=1
[s
l j
(n) ∗ y
jk
(n)], (1)
where β
k
is the attenuation associated to reference
signal x
k
(n), s
l j
(n) is the impulse response of the FIR
filter that models the electroacoustic path (or room
impulse response, RIR) between the jth loudspeaker
and the lth microphone, and y
jk
(n) is the kth com-
ponent of the adaptive filter output y
j
(n). Notice
that the RIRs s
l j
(n) must be estimated for the de-
sign of the adaptive filters, being their estimates de-
noted by ˜s
l j
(n) in Fig. 1. We assume that the esti-
mated RIRs have a negligible estimation error, that is,
˜s
l j
(n) ≈ s
l j
(n),∀l, j.
It was shown in (Gonzalez et al., 2006) that the
system transfer function in steady state for the kth ref-
erence signal is given by
H
l
(e
jω
k
) =
E
l
(e
jω
k
)
D
l
(e
jω
k
)
= β
k
, l = 1, .. ., L , (2)
which will be intuitively shown in the following
1
.
Let us express (1) in the frequency domain for
every ω
k
such that k = 1,. .. ,K, and taking into ac-
count that Y
j
(e
jω
k
) = W
j
(e
jω
k
)X(e
jω
k
) according to
the model shown in Fig. 1:
E
l
(e
jω
k
) = D
l
(e
jω
k
) + (1 − β
k
)×
J
∑
j=1
S
l j
(e
jω
k
)W
j
(e
jω
k
)X(e
jω
k
).
(3)
1
For the proof of convergence, see Section V of (Gon-
zalez et al., 2006)
SIGMAP 2021 - 18th International Conference on Signal Processing and Multimedia Applications
40
+
+
LMS
P(z)
e
l
(n)d
l
(n)
x(n)
<latexit sha1_base64="VPSLYXDMl786iIiZCkmXAmi46XU=">AAAB5XicbZDNSsNAFIVv6l+tf1WXbgaLUDclqYIuC25cVrA/0IYymd40QyeTMDMRS+gj6ErUnS/kC/g2JjULbT2rb+45A/dcLxZcG9v+skpr6xubW+Xtys7u3v5B9fCoq6NEMeywSESq71GNgkvsGG4E9mOFNPQE9rzpTe73HlBpHsl7M4vRDelEcp8zavLRY12ej6o1u2EvRFbBKaAGhdqj6udwHLEkRGmYoFoPHDs2bkqV4UzgvDJMNMaUTekEBxlKGqJ208Wuc3LmR4qYAMni/Tub0lDrWehlmZCaQC97+fA/b5AY/9pNuYwTg5JlkczzE0FMRPLKZMwVMiNmGVCmeLYlYQFVlJnsMJWsvrNcdhW6zYZz0WjeXdZazeIQZTiBU6iDA1fQgltoQwcYBPAMb/BuTawn68V6/YmWrOLPMfyR9fENZZ2LYg==</latexit>
Sinusoidal
Generator
Multi-frequency
noise
y
j
(n)
𝟏 − 𝜷
𝜷
<latexit sha1_base64="MzmGKS199YmGpBa0KvCUOcSr8wU=">AAAB9HicbZDJTgJBFEVfOyJOjS7dVCQmuCHdhIisJHHjEqMMCRBSXTygpHpIVTUGO/yJroy680v8AXd+ik1DjNNdnXr3VvLedQLBlbasd2NpeWV1bT21kd7c2t7ZNTN7deWHkmGN+cKXTYcqFNzDmuZaYDOQSF1HYMMZnc/8xhil4r53rScBdlw68HifM6rjUdfMtDUXPYyupt1I3Exzd8ddM2vlrUTkL9gLyJ59QKJq13xr93wWuuhpJqhSLdsKdCeiUnMmcJpuhwoDykZ0gK0YPeqi6kTJ6lNy1Pcl0UMkyft7NqKuUhPXiTMu1UP125sN//Naoe6fdiLuBaFGj8WR2OuHgmifzBogPS6RaTGJgTLJ4y0JG1JJmY57SifnlxOROZSKCyjbX+fXC3n7JF+4LGYrhXkPkIIDOIQc2FCCClxAFWrA4BYe4BlejLFxbzwaT/PokrH4sw8/ZLx+At0Kk0E=</latexit>
˜
S
lj
(z)
Figure 1: ANE system model where only the signal processing within the jth secondary source is shown.
Substituting E
l
(e
jω
k
) = β
k
D
l
(e
jω
k
) from (2) in (3)
and assuming that D
l
(e
jω
k
) = P
l
(e
jω
k
)X(e
jω
k
), where
P
l
(z) is the primary acoustic path between the noise
source and the lth microphone shown in Fig. 1, then
(3) can be rewritten as
−(1 − β
k
)P
l
(e
jω
k
)X(e
jω
k
) = (1 − β
k
)×
J
∑
j=1
S
l j
(e
jω
k
)W
j
(e
jω
k
)X(e
jω
k
),
(4)
which leads to
J
∑
j=1
S
l j
(e
jω
k
)W
j
(e
jω
k
) = −P
l
(e
jω
k
), (5)
that is, the primary path of the unwanted noise is com-
pensated by the combined response of all the adaptive
filters convolved with their respective secondary paths
in time. Therefore, when the adaptive filters designed
in the ANE system fulfill (5) in steady state, the sig-
nals captured by the error sensors are expressed as
E
l
(e
jω
k
) = β
k
D
l
(e
jω
k
), (6)
for l = 1, .. .,L, j = 1,. .. ,J and k = 1, ...,K.
The parameter β
k
is the attenuation of the kth com-
ponent of the unwanted noise with respect to its orig-
inal amplitude. In Fig. 1 the parameters β
k
are gath-
ered in the vector
β
β
β =
β
1
β
2
.. . β
K
. (7)
2.2 Masking Threshold Computation
In this section we will briefly explain how the mask-
ing threshold of a sound is computed. This concept
has been previously used in (R
¨
am
¨
o et al., 2012; R
¨
am
¨
o
et al., 2013; Estreder et al., 2018) to carry out the per-
ceptual equalization of audio signals in the presence
of an unwanted ambient noise.
The simultaneous (or frequency) masking effect
occurs within the human hearing system when two
sounds are presented at the same time, one of them be-
ing the masker signal and the other the maskee signal.
This effect causes the maskee signal to be perceived
less louder than if it were presented alone (Fastl
and Zwicker, 2007; ISO Central Secretary, 2014).
Moreover, depending on the masking threshold of the
masker signal, the maskee can even get unnoticed by
the listener (Johnston, 1988; Moore, 1985).
Fig. 2 shows the block diagram (R
¨
am
¨
o et al.,
2013; Estreder et al., 2018) to estimate the masking
threshold of the mth time frame of a broadband sig-
nal r
m
(n) composed by L
s
samples. The “Spectral
Analysis” block estimates its Power Spectral Den-
sity (PSD), P
m
(k), over frequencies f
k
=
k
N
f
s
, where
k = 0, ·· · ,N/2, being N the size of the fast Fourier
transform (FFT) and f
s
= 44100 Hz the sampling rate.
In our case N = 2L
s
, being L
s
/ f
s
approximately 200
ms.
Once P
m
(k) is obtained, the “Map to Bark Scale”
block maps the frequency bins into the Bark domain
using (Zwicker and Terhardt, 1980):
ν = 13 arctan
0.76 f
1000
+ 3.5arctan
f
7500
2
, (8)
where ν denotes the index of the Bark band, ν =
1,2, .. ., N
c
, and N
c
is the number of Bark bands to
process, in our case N
c
= 25. This block obtains the
energy per Bark band as (Johnston, 1988)
G
m
(ν) =
sup(ν)
∑
k=inf(ν)
P
m
(k), ν = 1,· ·· , N
c
, (9)
where inf(ν) and sup(ν) correspond to the frequency
bin of the lower and upper boundary of the νth Bark
band, respectively.
Perceptual Active Equalization of Multi-frequency Noise
41

r
m
(n)
Map to
Bark Scale
Tonality Estimator and
Offset Function
P
m
(k)
Spreading
Function
G
m
(n)
+
S
m
(n)
O
m
(n)
T
m
(n)
+
-
Spectral
Analysis
Figure 2: Procedure to estimate the masking threshold T
m
(ν) of a time frame of a sound r
m
(n).
The “Spreading Function” block models the
masking caused by the energy of a certain Bark band
over the rest of the bands. From the set of previ-
ously proposed spreading functions (Bosi and Gold-
berg, 2012), we have used that of (Schroeder et al.,
1979). In order to compute the overall spread mask-
ing function S
m
(ν), we showed in (Estreder et al.,
2018) that a linear addition of the curves produced
by the spreading function in (Schroeder et al., 1979)
obtains similar results to the exponential addition
of (R
¨
am
¨
o et al., 2012), which has also been confirmed
in (Moore, 1985) for multi-frequency signals. There-
fore, for each Bark band ν, their masking is computed
as
S
m
(ν) =
N
c
∑
η=1
b
η
(ν), (10)
where b
η
(ν) is the masking intensity produced by
Bark band η over Bark band ν computed from their
corresponding energies (9) as in (Estreder et al.,
2018).
Regarding the lower branch of Fig. 2, it calculates
the spectral offset O
m
(ν), which models the influence
of the type of spectral content on the final masking:
if most of the energy is concentrated in a small por-
tion of the band (tone-like masking), this value will
be high, whereas if the energy is equally spread along
the band (noise-like masking), this parameter will be
low. In (Gray and Markel, 1974) the Spectral Flat-
ness Measure (SFM) is used to model the tone-like or
noise-like masking (for further details see also (John-
ston, 1988; R
¨
am
¨
o et al., 2013)). Finally the masking
threshold T
m
(ν) of time frame r
m
(n) at the νth Bark
band is estimated as
T
m
(ν) = 10
h
log
10
(S
m
(ν))−
O
m
(ν)
10
i
. (11)
3 PERCEPTUAL ACTIVE NOISE
EQUALIZER
As we stated in Section 1, our goal is to design a per-
ceptual equalizer as in (R
¨
am
¨
o et al., 2012; Estreder
et al., 2018), but with an alternative strategy: instead
of equalizing the audio signal to mask the noise, the
ambient noise will be equalized by the ANE system
of Fig. 1 in order to get masked by the audio signal.
Fig. 3 shows the block diagram of the Perceptual
Active Noise Equalizer (PANE). The subscript m in
all the signals of Fig. 3 denote the mth time frame
of duration L
s
samples. The audio signal (speech or
music) emitted by all the speakers is a(n), whereas,
according to (1), the anti-noise signal emitted by the
jth loudspeaker of the ANE is expressed as
y
β
j
(n) =
K
∑
k=1
(1 − β
k
)y
jk
(n). (12)
The values of vector β
β
β are computed in the “At-
tenuation Estimation” block according to the masking
threshold of the music and the current level of the am-
bient noise at each error sensor. The measured signal
at the lth error sensor (1) is now expressed as
e
l
(n) = d
l
(n) +
J
∑
j=1
[s
l j
(n) ∗ y
β
j
(n)] + a
l
(n)
= d
0
l
(n) + a
l
(n),
(13)
where d
0
l
(n) is the total ambient noise measured by
microphone l and
a
l
(n) = a(n) ∗
J
∑
j=1
s
l j
(n), (14)
is the resulting audio signal propagated from the J
loudspeakers to the lth microphone through the cor-
responding electroacustic paths s
l j
(n) of Fig. 1.
As said before, s
l j
(n) has been previously esti-
mated in the ANE system. Since ˜s
l j
(n) ≈ s
l j
(n), we
can obtain the estimate of the time frames of both sig-
nals, a
l
(n) and d
0
l
(n) in (13), as
˜a
l,m
(n) = a
m
(n) ∗
J
∑
j=1
˜s
l j
(n),
˜
d
0
l,m
(n) = e
l,m
(n) − ˜a
l,m
(n).
(15)
Notice that the frame of the audio signal chosen to
compute the masking threshold at the input of Fig. 3
is a
m
(n), whereas the one that will be emitted by the
loudspeakers is a
m+1
(n). In a real-time experiment as
the one presented in Section 4, the audio signal can
SIGMAP 2021 - 18th International Conference on Signal Processing and Multimedia Applications
42

Active
Noise
Equalizer
y
1,m
(n)
a
(m+1)
(n)
β
m
d
1,m
(n)a
1,m
(n) ,
~
y
J,m
(n)
.
Attenuation
Estimation
d
L,m
(n)a
L,m
(n) ,
~
β
β
.
.
.
.
.
.
.
'
'
~
~
Figure 3: Perceptual Active Noise Equalizer.
be originated from a streaming web service or a ra-
dio station, thus, the masking threshold computation
must be carried out on the same audio frame that is
being reproduced (m), and its resulting β
β
β
m
will affect
the next time frame (m + 1). In case the audio sig-
nal is originated from a local memory or disk, then
the estimate ˜a
l,m
(n) can be pre-computed prior to the
reproduction, and a
m
(n) will be emitted by the loud-
speakers instead of a
m+1
(n).
Finally, the computation of attenuation vector β
β
β
m
for the PANE together with other two possible strate-
gies will be explained in the following.
3.1 Perceptual Equalization (PEQ)
The perceptual equalization (PEQ) profile is the at-
tenuation profile obtained by the “Attenuation Esti-
mation” block of the PANE shown in Fig. 3. Con-
sidering expressions (6) and (13), the noise term at
each error sensor for frequency f
k
can be expressed
as D
0
l,m
(e
jω
k
) = β
k,m
D
l,m
(e
jω
k
). Therefore, the values
of β
m,k
are estimated as:
20log
10
(β
m,k
) =
min
l
h
T
A
l,m
(ν) − G
D
0
l,m
(ν)
i
− g
k
,0
, ∀ f
k
∈ B
ν
,
(16)
where T
A
l,m
(ν) is the masking threshold of the audio
signal and G
D
0
l,m
(ν) is the energy per Bark band of the
noise signal, both referred to error sensor l and ex-
pressed in dB, and B
ν
is the bandwidth (8) of the Bark
band ν in Hertz. The parameter g
k
is an extra gain
that can be used to force the noise power to fall g
k
dB below the masking threshold of the audio signal.
This value is usually set to 2 −3 dB in practice to take
into account the power variations of the audio signal
within the time of a frame. Nevertheless, g
k
can also
be considered as a control parameter that can shape
the noise PSD according to the user preferences.
Notice that the strategy stated in (16) computes
β
m,k
as the minimum value considering all the error
sensors. An alternative strategy could be to compute
the attenuation for each sensor as 20 log
10
(β
m,k
(l)) =
h
T
A
l,m
(ν) − G
D
0
l,m
(ν)
i
− g
k
and then compute β
m,k
as
their average over l. Additional strategies or con-
straints can be used depending on the music genre and
the locations of the error sensors with respect to the
noise source.
3.2 Hearing Threshold (HT)
The hearing threshold (HT) profile aims to force the
noise power to remain below the standard curve of the
human hearing threshold established in (ISO Central
Secretary, 2014). Therefore, the values of β
m,k
are
estimated as:
20log
10
(β
m,k
) =
min
l
L
T H
(e
jω
k
) − G
D
0
l,m
(e
jω
k
),0
,
(17)
where L
T H
(e
jω
k
) is the value in dB of the hearing
threshold at frequency f
k
and G
D
0
l,m
(e
jω
k
) is the same
noise term that in (16), but expressed in the frequency
domain.
3.3 Full Cancellation (FC)
The main objective of the full cancellation (FC) pro-
file is to cancel the noise, or at least attenuate it as
much as possible regardless the existence of the audio
signal. Therefore,
β
m,k
= 0 , ∀m, k (18)
4 REAL-TIME EXPERIMENT
A multi-channel PANE system has been built in the
listening room located at the Audio Lab
2
of the Insti-
tute of Telecommunications and Multimedia Applica-
tions (iTEAM) of the Technical University of Valen-
cia. Fig. 4 shows a picture of the 2 × 2 multi-channel
system formed by L = 2 microphones acting as error
sensors, and J = 2 loudspeakers placed as if they were
mounted at the headrest sides of a car seat. A third
loudspeaker (not shown in the picture), placed oppo-
2
https://gtac.webs.upv.es/
Perceptual Active Equalization of Multi-frequency Noise
43
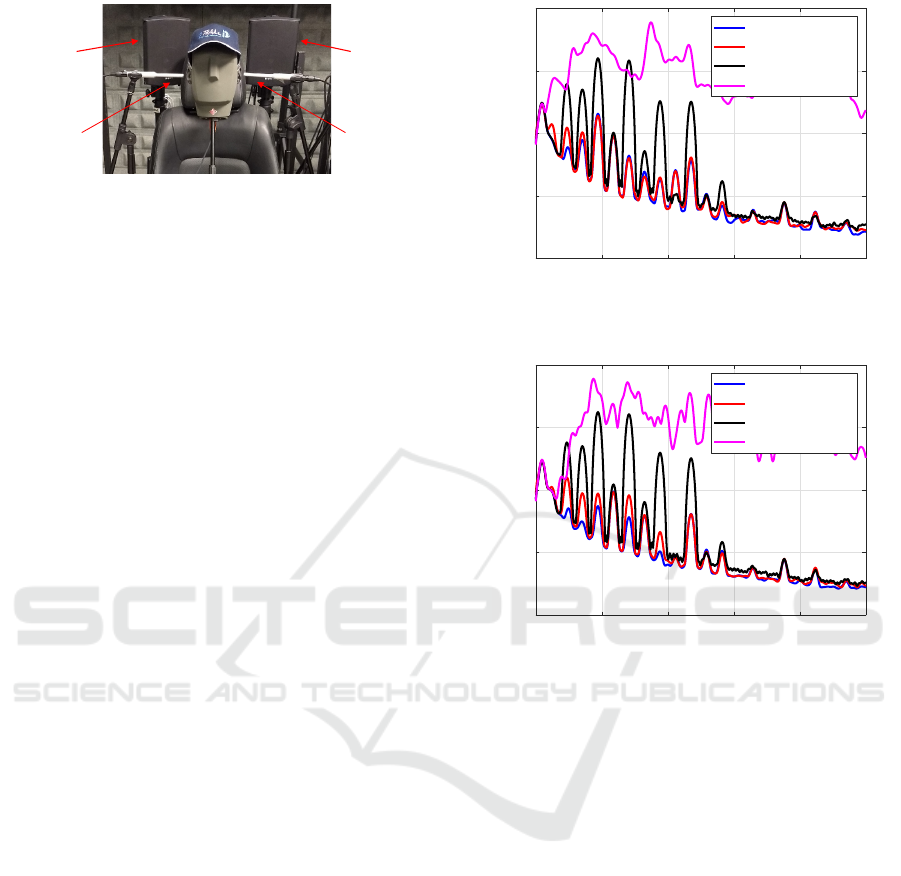
MIC #2
error signal
e
2
(n)
MIC #1
error signal
e
1
(n)
SPK #1
anti-noise
signal y
1
(n)
SPK #2
anti-noise
signal y
2
(n)
Figure 4: ANE Prototype mounted in the iTEAM Audio
Lab.
site to the seat, was used to generate the unwanted
noise formed by K = 11 frequency components such
that f
k
= (k + 1) · 47.05 Hz, k = 1, ...,11, i.e., being
its last frequency f
11
= 564.6 Hz.
A computer equipped with an Intel i7-8700 pro-
cessor and 32 GB of RAM has been used to run
the algorithms in real-time. The signal processing
is entirely computed by Matlab 2018b, whereas its
audio processing toolbox communication drives the
record and generation of signals through a Roland
Octa-Capture soundcard. The sample rate was 44100
Hz. The microphones are the Behringer ECM8000
model, the loudspeaker for the primary noise is an
Event Project Studio 6 and the two loudspeakers of
the ANE system are model SDQ5P from Apart.
4.1 Calibration and Estimation of
Secondary Paths
The masking threshold computation needs a precise
calibration of the whole audio system previous to
carry out the experiments. Firstly we have calibrated
both microphones with the aid of a pistonphone sig-
nal (Frederiksen, 2008). Secondly, we have estimated
the secondary paths, s
l j
(n), l, j = 1, 2, from each
loudspeaker to each microphone using a maximum
length sequence (MLS) signal (Vanderkooy, 1994) of
16384 samples. The estimated secondary paths have
been trimmed to a length of 4096 coefficients, keep-
ing the 99.95% of their total energy. Finally, every
estimated ˜s
l j
(n) has been normalized according to the
real SPL of the corresponding measured signal in mi-
crophone l. The estimated secondary paths ˜s
l j
(n) in-
clude the electroacoustic characteristics of the loud-
speakers, microphones and audio sound card plus the
room impulse response.
4.2 Experiments
In this section a study has been carried out in order
to compare the different profiles of Section 3. For the
PEQ profile a value of g
k
= 3 dB has been used for all
the frequencies.
0 200 400 600 800 1000
Frequency (Hz)
0
20
40
60
80
Power (dB SPL)
FC profile
HT profile
PEQ profile
Recorded Music
(a)
0 200 400 600 800 1000
Frequency (Hz)
0
20
40
60
80
Power (dB SPL)
FC profile
HT profile
PEQ profile
Recorded Music
(b)
Figure 5: PSD of the recorded noise at Mic #1 for the three
equalization profiles (a) when the “Latino” song is playing,
and (b) when the “Jazz” song is playing. The PSD of the
recorded song is also shown.
As audio signals, we have used two excerpts of
different musical genres. The first audio signal is a
30 s excerpt from the song “Con altura” performed
by Rosalia, J Balvin and El Guincho (2019) that we
have labelled as “Latino” song. The second audio is
an instrumental 36 s excerpt from the song “Alfon-
sina y el mar” performed by The Jazz Chamber Trio
(2005) that we have labelled as “Jazz” song. The au-
dio signals are reproduced with a level such that they
are recorded at 83 dB SPL on average, while the noise
signal is reproduced such that it is recorded at 76 dB
SPL on average.
4.3 Results and Discussion
Fig. 5 shows the PSD of noise signal d
0
1
(n) measured
at the microphone labelled as Mic #1 in Fig. 4 for
every equalization profile, and the PSD of its corre-
sponding audio excerpt, a
1
(n). All the PSDs are given
SIGMAP 2021 - 18th International Conference on Signal Processing and Multimedia Applications
44
in dB SPL. We have considered only the last 10 s of all
the signals in order to assure that the adaptive filters
W
j
(z) of the ANE system of Fig. 1 have converged.
Although the results are only referred to Mic #1, the
noise and music PSDs measured at Mic #2 were very
similar. The frequency is represented only from 0 Hz
to 1 kHz in order to focus on the part of the spectrum
where the noise is present, being its last component
located at f
11
= 564.6 Hz.
As expected, the profile that provides a lower
recorded noise power for both music signals is the FC,
whose strategy is to cancel the noise in all the frequen-
cies. Regarding the HT profile in Fig. 5, it presents
a similar profile for both “Latino” and “Jazz” sig-
nals, with slight variations for the components around
200 Hz due to experimental variations. Compared to
the FC profile, it allows for more noise content at the
lowest frequencies where the human hearing system
is less sensitive.
Regarding the PEQ profile in Fig. 5, the amount
of noise power recorded at the error sensor is in the
range of 10 − 20 dB higher than the HT profile for
most of the components and for both audio signals.
Comparing the PEQ noise curve to the music PSD,
it can be appreciated how the PEQ is far below the
music in some frequencies, but not in all of them.
This is due to the fact that their attenuation values,
β
β
β
m
, are designed with respect to the masking thresh-
old of the music, not with respect to its PSD. The
masking threshold is computed through a non-linear
process over the music PSD as Fig. 2 describes, and
it is represented in the Bark domain, thus, compar-
ing the music masking threshold with the noise PSD
would have no sense. Nevertheless, from the PEQ
curves in Fig. 5, we can state that the PEQ strat-
egy achieves its goal of actively equalizing the am-
bient noise to get masked by the music. All the sig-
nals involved in this experiment have been saved as
“wav” files and are available to be listened at http:
//gpinyero.webs.upv.es/Experiments-sigmap2021/.
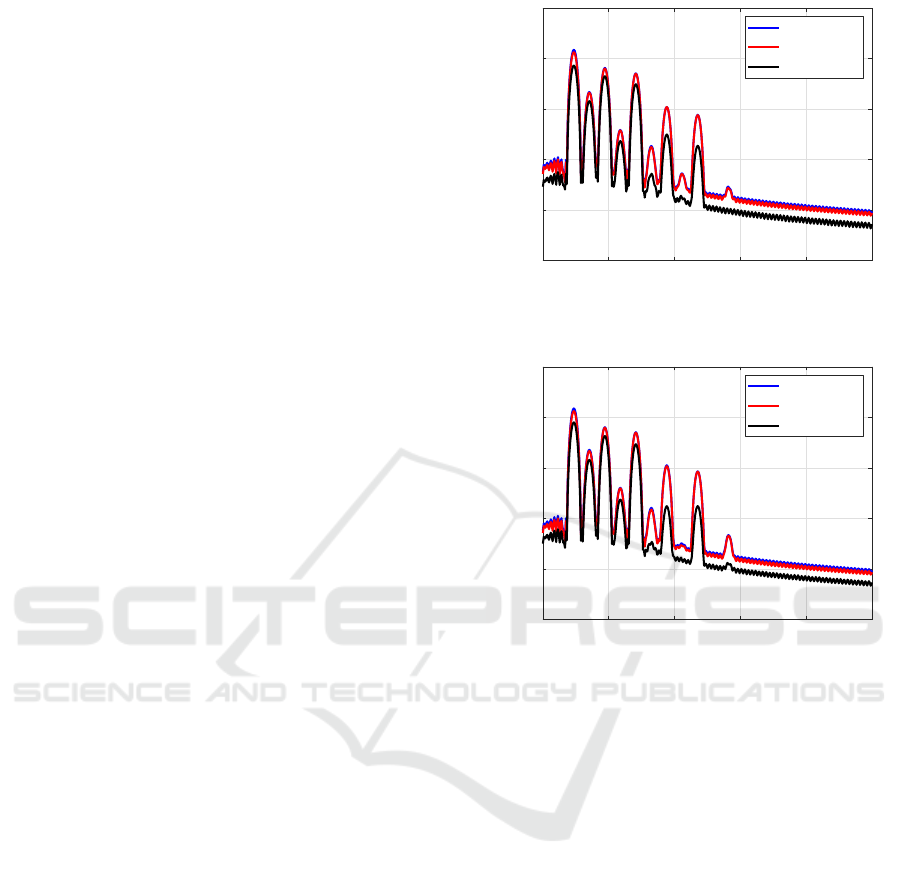
Fig. 6, by contrast, shows the PSDs of the anti-
noise signal y
β
1
(n) emitted by the speaker labelled as
Spk #1 in Fig. 4. As in Fig. 5, the curves represent the
PSD considering only the last 10 s of the correspond-
ing signals. The power is represented in dB full scale
(FS), where FS means that the power level is referred
to a signal amplitude range limited to [−1,1].
It can be appreciated that FC and HT profiles emit
the same power for all the frequencies, although the
noise power received at the error sensors shown in
Fig. 5 is higher for HT in most of the frequency com-
ponents. Therefore, a certain relaxation in the noise
cancellation strategy apparently does not correspond
to the same amount of anti-noise power saved by the
0 200 400 600 800 1000
Frequency (Hz)
-120
-100
-80
-60
-40
-20
Power (dB FS)
FC profile
HT profile
PEQ profile
(a)
0 200 400 600 800 1000
Frequency (Hz)
-120
-100
-80
-60
-40
-20
Power (dB FS)
FC profile
HT profile
PEQ profile
(b)
Figure 6: PSD of the anti-noise signal emitted by Spk #1 for
the three equalization profiles (a) when the “Latino” song is
playing, and (b) when the “Jazz” song is playing.
ANE system. Notice that Fig. 5 represents the PSD
of d
0
1
(n) = d
1
(n)+
∑
J
j=1
[s
1 j
(n)∗ y
β
j
(n)] in (13), which
depends on the level of the ambient noise captured at
Mic #1, d
1
(n), and the combined response of the anti-
noise signals, y
β
j
(n), j = 1,2, propagated through their
corresponding secondary paths, s
1 j
(n). Therefore, it
can be thought that, due to particular experimental
conditions, a minimum anti-noise power is needed to
actively affect the undesired ambient noise.
Regarding the curve of the PEQ profile in Fig. 6,
The anti-noise PSD is only 3 − 5 dB lower than HT
PSD for all the components below 300 Hz. How-
ever, for the components above 300 Hz, the saved
power reaches significant values around 10 dB for the
“Latino” song and 15 dB for the “Jazz” song. This
is a relevant result for our proposed PANE scheme,
since the anti-noise emitted within a reduced room, as
a car cabin, propagates all over the space and can neg-
atively enhance the ambient noise at positions differ-
Perceptual Active Equalization of Multi-frequency Noise
45

ent from the seat where the noise is being controlled.
In this sense, any reduction on the amount of energy
noise emitted by the secondary sources would help to
actively control the noise over multiple regions within
a room (Zhang et al., 2020).
Finally, Tables 1 and 2 show the Mean Square Er-
ror (MSE) and the Perceptual Evaluation of speech
quality (PESQ) values of the recorded audio signal at
Mic #1 respectively, being the reference signal in both
cases the audio excerpt recorded at Mic #1 when the
ambient noise is not present. Apart from the results
obtained by the three equalization strategies (FC, HT,
PEQ), the results obtained when no noise equalization
is carried out are presented in the row labelled “ANE-
OFF”.
The MSE is an objective measure whereas the
PESQ is intended to measure the subjective quality of
a speech signal through an index ranging from 0.5 to
4.5 (ITU-T, 2001). Comparing the PESQ to the Mean
Opinion Score (MOS) that ranges from 1 to 5, a PESQ
value of 4.5 can be considered of “excellent” quality,
whereas PESQ values below 3 are usually considered
“fair” for speech communications, but “poor” for au-
dio reproduction. Nevertheless, although the PESQ is
not validated for other applications than speech com-
munication (ITU-T, 2001), it is widely used in many
speech and audio applications as echo cancellation,
audio coding and speech enhancement.
Table 1: MSE of the recorded audio signal at Mic #1.
Latino Jazz
FC -27.3 dB -28.84 dB
HT -27.8 dB -28.3 dB
PEQ -15.13 dB -15.75 dB
ANE-OFF -5.59 dB -6.93 dB
Table 2: PESQ of the recorded audio signal at Mic #1.
Latino Jazz
FC 4.43 4.49
HT 4.41 4.48
PEQ 3.51 4.17
ANE-OFF 2.86 3.63
Table 1 shows that the FC and HT profiles achieve
an MSE around −27 dB, whereas Table 2 shows that
their corresponding PESQ values are close to 4.5,
meaning that the audio signals are perceived as if
no ambient noise were present. On the other hand,
the PEQ profile achieves PESQ values of 3.5 for
the “Latino” song and 4.17 for the “Jazz” song, al-
though their respective MSE values are both 12 − 13
dB higher than their corresponding HT values. Never-
theless, the PEQ profile presents a relevant reduction
of 9 − 10 dB of the MSE with respect to the “ANE-
OFF” condition, and a “Good / Excellent” quality in
the PESQ scale.
As a final remark, the results here obtained for the
PEQ profile, even if they are related to the particu-
lar conditions of the experimental study, provide very
interesting insights regarding the novel PANE system
shown in Fig. 3:
1. The PEQ can be implemented in real-time without
any additional latency on the audio reproduced by
the entertainment system.
2. The PEQ obtains a “Good / Excellent” audio qual-
ity compared to the same audio signals measured
in absence of the ambient noise.
3. The PEQ achieves a significant reduction in the
anti-noise power emitted by the loudspeakers, al-
though the amount of saved power depends on the
particular frequency range considered.
4. The PEQ is a versatile approach that allows to ex-
change the amount of ambient noise power mea-
sured at the microphones with the amount of anti-
noise power emitted by the loudspeakers, just
by controlling the parameter g
k
in the design of
β
k
(16): the more the value of g
k
is increased, the
more the PEQ profile get close to HT or FC pro-
files.
5 CONCLUSIONS
In this paper a novel perceptual active noise equalizer
(PANE) has been presented. The PANE intends to re-
duce the power of a multi-frequency ambient noise in
such a way that it cannot be perceived when a music
signal is present thanks to the masking effect of the
human hearing system. A real-time experiment has
been presented and the PANE performance has been
compared to other strategies of the ANE system as the
so-called full cancellation (FC) and hearing threshold
(HT) profiles. Although the measured noise power
level is higher for the PEQ profile, the emitted anti-
noise power is lower compared to HT and FC pro-
files. This performance leads to a reduction of noise
pollution in the room and a lower power consump-
tion of the system loudspeakers. In addition, the PEQ
profile is a versatile approach that can reduce the per-
ceived noise as much as the user decides, reaching
the same performance than the HT or FC profiles. Fi-
nally, the experiment presented in this paper has vali-
dated the PANE system as a real-time versatile alter-
native to the classic active noise cancellation systems
for multi-frequency noise. Further research is being
carried out in our laboratory to extend the PEQ to the
SIGMAP 2021 - 18th International Conference on Signal Processing and Multimedia Applications
46

case of broadband noises, as road and wind noises in
cars.
ACKNOWLEDGEMENTS
This work has been partially supported by EU
together with Spanish Government through RTI2018-
098085-BC41 (MCIU/AEI/FEDER) and RED2018-
102668-T, and Generalitat Valenciana through
PROMETEO/2019/109.
REFERENCES
Bosi, M. and Goldberg, R. (2012). Introduction to digi-
tal audio coding and standards. Springer Science &
Business Media.
Brandenburg, K. and Johnston, J. (1990). Second gener-
ation perceptual audio coding: the hybrid code. In
Audio Engineering Society Convention 88.
Doclo, S. (2016). Active noise reduction method using per-
ceptual masking, Patent US20110026724A1.
Donley, J., Ritz, C., and Kleijn, W. (2016). Improving
speech privacy in personal sound zones. In 2016 IEEE
Intl. Conf. on Acoustics, Speech and Signal Proc.,
pages 311–315.
Estreder, J., Pi
˜
nero, G., Aguirre, F., de Diego, M., and Gon-
zalez, A. (2018). On perceptual audio equalization
for multiple users in presence of ambient noise. In
2018 IEEE 10th Sensor Array and Multichannel Sig-
nal Proc. Workshop (SAM), pages 445–449.
Fastl, H. and Zwicker, E. (2007). Psychoacoustics. Springer
Berlin Heidelberg, Berlin, Heidelberg.
Fletcher, H. (1940). Auditory patterns. Reviews of modern
physics, 12(1):47.
Frederiksen, E. (2008). Microphone calibration. In Hand-
book of Signal Processing in Acoustics, pages 1293–
1312. Springer New York, New York, NY.
Gonzalez, A., de Diego, M., Ferrer, M., and Pi
˜
nero, G.
(2006). Multichannel active noise equalization of in-
terior noise. IEEE Trans. on Audio, Speech and Lan-
guage Proc., 14(1):110–122.
Gray, A. and Markel, J. (1974). A spectral-flatness measure
for studying the autocorrelation method of linear pre-
diction of speech analysis. IEEE Trans. on Acoustics,
Speech, and Signal Processing, 22(3):207–217.
Ho, C.-Y., Shyu, K.-K., Chang, C.-Y., and Kuo, S. M.
(2020). Efficient narrowband noise cancellation sys-
tem using adaptive line enhancer. IEEE/ACM Trans.
on Audio, Speech, and Language Proc., 28:1094–
1103.
ISO Central Secretary (2014). Acoustics – normal equal-
loudness-level contours. Standard, International Or-
ganization for Standardization.
ITU-T (2001). Perceptual evaluation of speech quality
(PESQ): An objective method for end-to-end speech
quality assessment of narrow-band telephone net-
works and speech codecs. ITU-T Recommendation
P.862.
Johnston, J. (1988). Transform coding of audio signals us-
ing perceptual noise criteria. IEEE Journal on Se-
lected Areas in Communications, 6(2):314–323.
Kuo, S. and Ji, M. (1995). Development and analysis of an
adaptive noise equalizer. IEEE Trans. on Speech and
Audio Proc., 3(3):217–222.
Kuo, S. and Tsai, J. (1994). Residual noise shaping tech-
nique for active noise control systems. The Journal of
the Acoustical Society of America, 95(3):1665–1668.
Moore, B. (1985). Additivity of simultaneous masking, re-
visited. The Journal of the Acoustical Society of Amer-
ica, 78(2):488–494.
Mosquera-S
´
anchez, J., Sarrazin, M., Janssens, K.,
de Oliveira, L., and Desmet, W. (2018). Multiple
target sound quality balance for hybrid electric pow-
ertrain noise. Mechanical Systems and Signal Proc.,
99:478–503.
Pickles, J. (2012). An introduction to the physiology of
hearing. Emerald Group Pub Bingley, Bingley, UK,
4th ed. edition.
R
¨
am
¨
o, J., V
¨
alim
¨
aki, V., Alanko, M., and Tikander, M.
(2012). Perceptual frequency response simulator for
music in noisy environments. In AES Conference:
45th Intl. Conf.: Applications of Time-Frequency
Proc. in Audio.
R
¨
am
¨
o, J., V
¨
alim
¨
aki, V., and Tikander, M. (2013). Percep-
tual headphone equalization for mitigation of ambient
noise. In 2013 IEEE Int. Conf. on Acoustics, Speech
and Signal Proc., pages 724–728.
Schroeder, M., Atal, B., and Hall, J. (1979). Optimizing
digital speech coders by exploiting masking proper-
ties of the human ear. The Journal of the Acoustical
Society of America, 66(6):1647–1652.
V
¨
alim
¨
aki, V. and Reiss, J. (2016). All about audio equaliza-
tion: Solutions and frontiers. Applied Sciences, 6(5).
Vanderkooy, J. (1994). Aspects of MLS measuring systems.
J. Audio Eng. Soc, 42(4):219–231.
Wang, T., Gan, W.-S., and Chong, Y.-K. (2012). Psy-
choacoustic active noise control system with auditory
masking. In Proc. 2012 Asia Pacific Signal and Infor-
mation Proc. Assoc., pages 1–6.
Wang, Y., Feng, T., Wang, X., Guo, H., and Qi, H. (2018).
An improved LMS algorithm for active sound-quality
control of vehicle interior noise based on auditory
masking effect. Mechanical Systems and Signal Pro-
cessing, 108:292–303.
Zhang, J., Sun, H., Samarasinghe, P. N., and Abhayapala,
T. D. (2020). Active noise control over multiple re-
gions: Performance analysis. In 2020 IEEE Int. Conf.
on Acoustics, Speech and Signal Proc. (ICASSP),
pages 8409–8413.
Zwicker, E. and Terhardt, E. (1980). Analytical expressions
for critical-band rate and critical bandwidth as a func-
tion of frequency. The Journal of the Acoustical Soci-
ety of America, 68(5):1523–1525.
Perceptual Active Equalization of Multi-frequency Noise
47
