Hyperspectral Methods in Microscopy Image Analysis: A Survey
Shirin Nasr-Esfahani
1 a
, Venkatesan Muthukumar
2
, Emma E. Regentova
2
, Kazem Taghva
1
and Mohamed B. Trabia
3
1
Department of Computer Science, University of Nevada, Las Vegas, U.S.A.
2
Department of Electrical and Computer Engineering, University of Nevada, Las Vegas, U.S.A.
3
Department of Mechanical Engineering, University of Nevada, Las Vegas, U.S.A.
Keywords:
Biology, Confocal, Dark-field, Fluorescence, Hyperspectral Microscope Imaging (HMI), Medicine.
Abstract:
Hyperspectral imaging (HSI) has found applications in remote sensing, agriculture, medicine, and biology.
HSI acquires a three-dimensional dataset called hypercube, with two spatial dimensions and one spectral di-
mension. Hyperspectral microscope imaging (HMI) is an emerging imaging spectroscopy technology, which
combines the advantages of HSI with microscopic imaging; HSI provides rapid, nondestructive, and chemical
free data analysis, whereas a microscope can be used to study microstructure of a sample such as nanoparti-
cles. Integration of HSI and microscopy, results in nondestructive evaluation using both spatial and spectral
information along with analysis at the molecular or cellular level. The aim of the survey is an overview of the
recent applications for HMI in medicine and biology fields.
1 INTRODUCTION
Microscopic image processing has been an essen-
tial part of advancements and discoveries in biology,
chemistry, medicine, and other related fields. One ex-
ample is successful completion of the human genome
sequencing project (Wu et al., 2008). It plays a crit-
ical role in cancer diagnosis and prognosis process-
ing large amount of image data that when processed
manually could be nor accurate and even impossible
(time-lapse cell tracking) to process manually.
Hyperspectral imaging (HSI) has been known
and widely utilized for many years as a rapid non-
destructive technique. It is based on acquiring for
every spatial pixel spectral responses in more than
a hundred contiguous spectral bands, in a single
observation, from the visible and near-infrared, in-
frared, mid-infrared, and thermal infrared regions
of the electromagnetic spectrum (from 400nm up to
100µ m). Henceforth, the hyperspectral technology
has been implemented in various fields including re-
mote sensing, food and agriculture, medical science,
art, history, forensic science and document process-
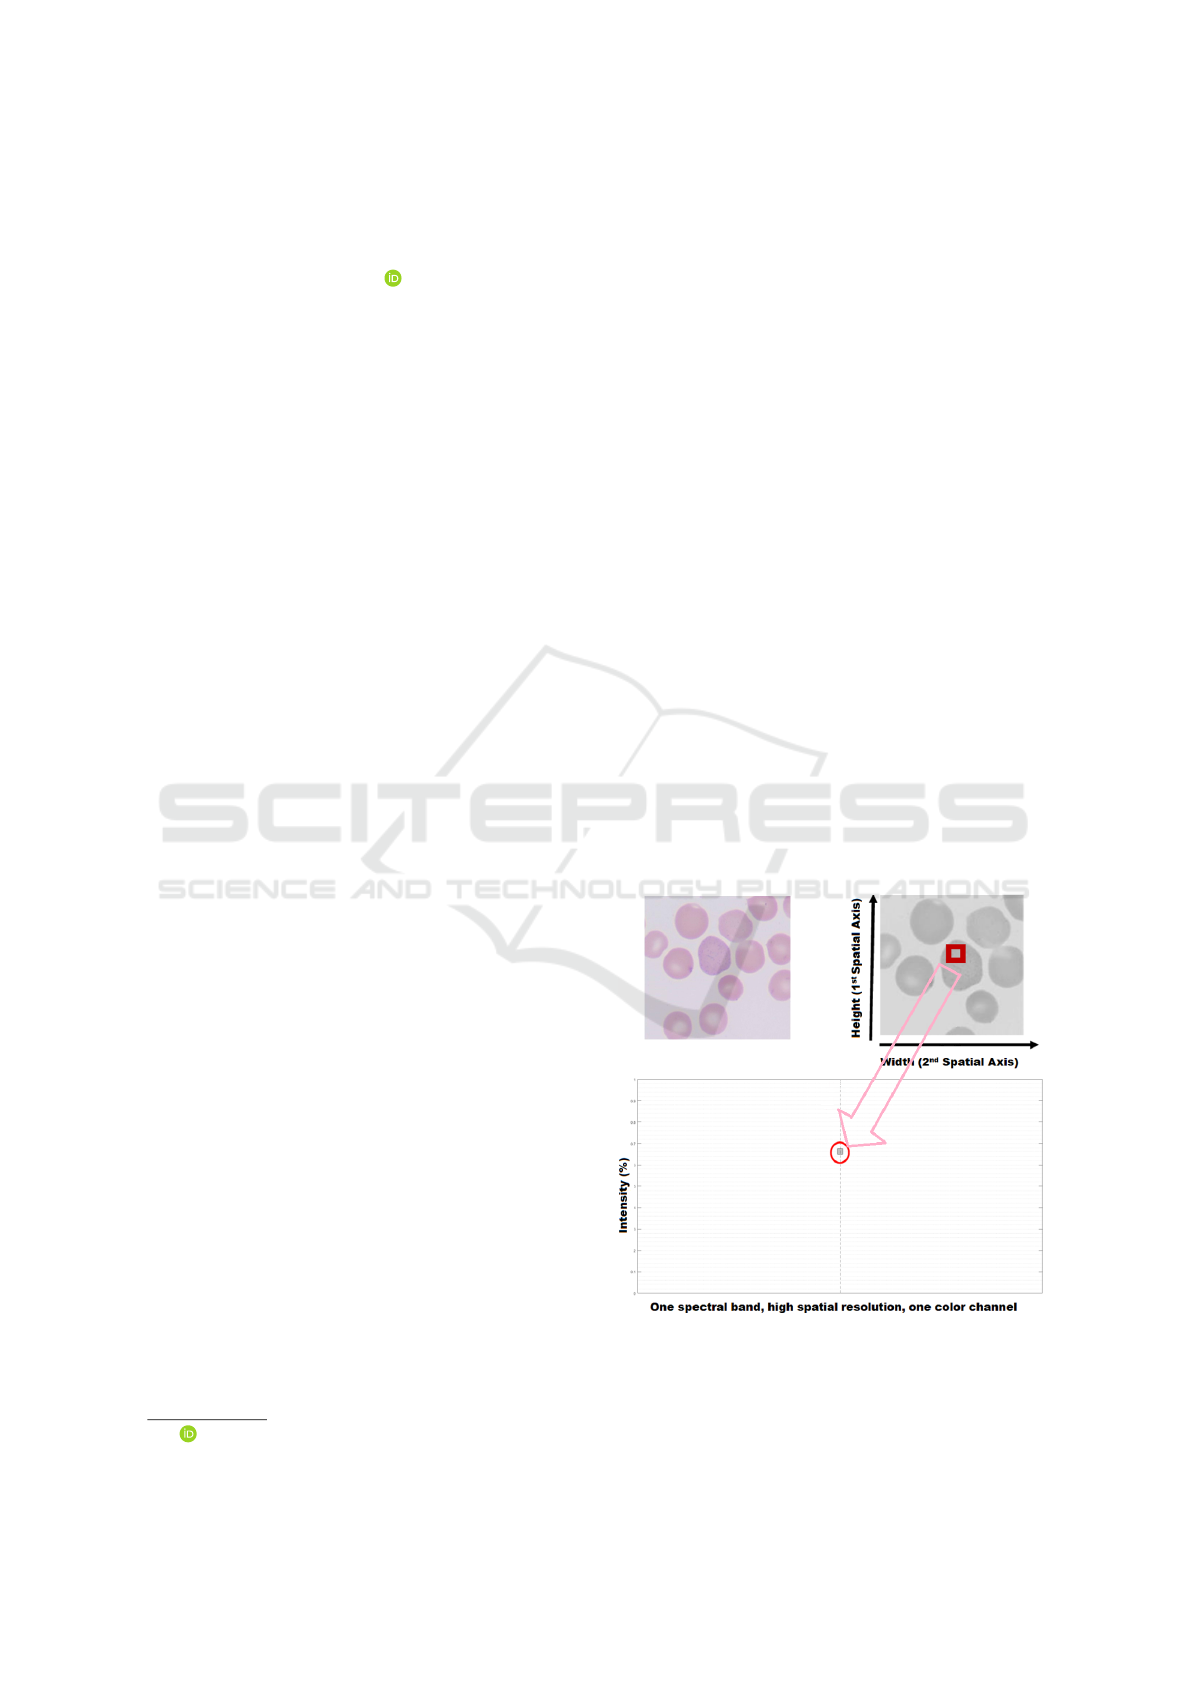
ing. Comparing with monochrome or RGB images
which have only one- (Figure 1) or three-color chan-
nels (Figure 2), hyperspectral images can have sev-
eral hundred spectral bands. A hyperspectral image
a
https://orcid.org/0000-0002-8260-1592
denotes a 3D cube, where height and width are con-
sidered as two spatial dimensions, and λ (the number
of spectral bands) represents the spectral dimension
(Figure 3).
Figure 1: top left: color image, top right: monochrome im-
age, bottom : intensity diagram.
Recently, hyperspectral microscopy is emerg-
ing as a powerful technology that has found many
Nasr-Esfahani, S., Muthukumar, V., Regentova, E., Taghva, K. and Trabia, M.
Hyperspectral Methods in Microscopy Image Analysis: A Survey.
DOI: 10.5220/0010646701110119
In Proceedings of the 18th International Conference on Signal Processing and Multimedia Applications (SIGMAP 2021), pages 111-119
ISBN: 978-989-758-525-8
Copyright
c
2021 by SCITEPRESS – Science and Technology Publications, Lda. All rights reserved
111
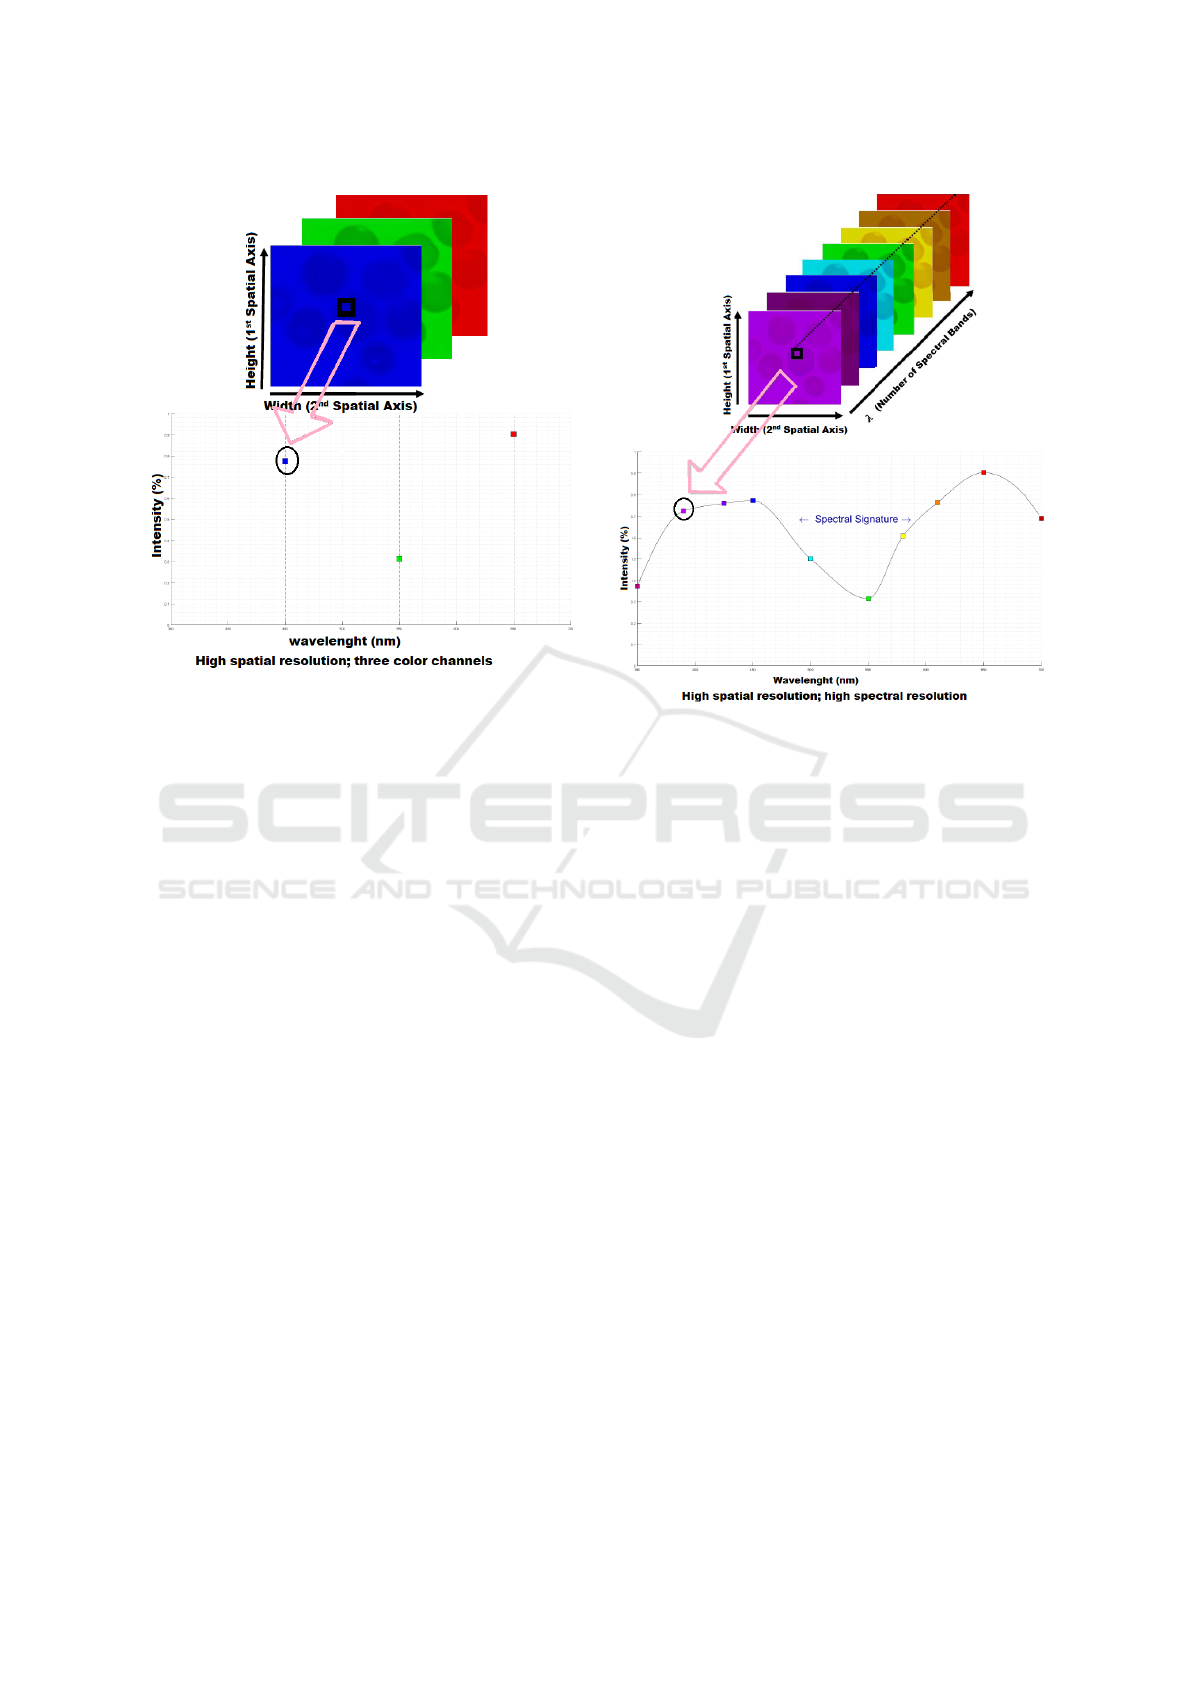
Figure 2: top: RGB data cube, bottom: intensity diagram.
biomedical and other applications including disease
diagnosis, nanotechnology research, microorganism
detection, microscopic contaminants analysis. It is
the result of combining conventional microscope sys-
tems and spectroscopy technology to collect both high
spatial and spectral information. Although being very
similar to conventional optical microscope images,
HSI microscope images have the complete reflectance
spectral response for each pixel in the spatial do-
main which enables non-destructive measurements.
The first development of a hyperspectral microscope
imaging system, integration of an imaging spectrom-
eter and an epifluorescence microscope, was used to
classify spleen cells of a Balb/c mouse, (Tsurui et al.,
1999). Two years later, by combining a standard
epifluorescence microscope and an imaging spectro-
graph, (Schultz et al., 2001) developed a prototype
of a hyperspectral imaging microscope to capture and
identify a complete emission spectrum from a micro-
scope slide, during a single-pass evaluation.The ma-
jor problem of both above-mentioned systems was
their small fields of view. To solve this issue, (Con-
stantinou et al., 2009) integrated a confocal scanning
microscope with a prototype hyperspectral imager to
capture the entire slide image. Since then, an exten-
sive research and development has been conducted
on HSI microscope technology. The use of machine
learning for generating, manipulating, and analysis of
high volumes of data at faster rate, has advanced the
technology significantly.
Figure 3: top: hyperspectral data cube, bottom: spectral
signature.
The purpose of this paper is to provide a sum-
mary of research on the subject in recent years (2016
-2021). HMI instruments are presented in section 2.
Application areas of the HMI in medicine and biology
fields are discussed in section 3, and section 4 con-
cludes the paper. Finally, all acronyms used in this
manual are listed in the Appendix.
2 INSTRUMENTS
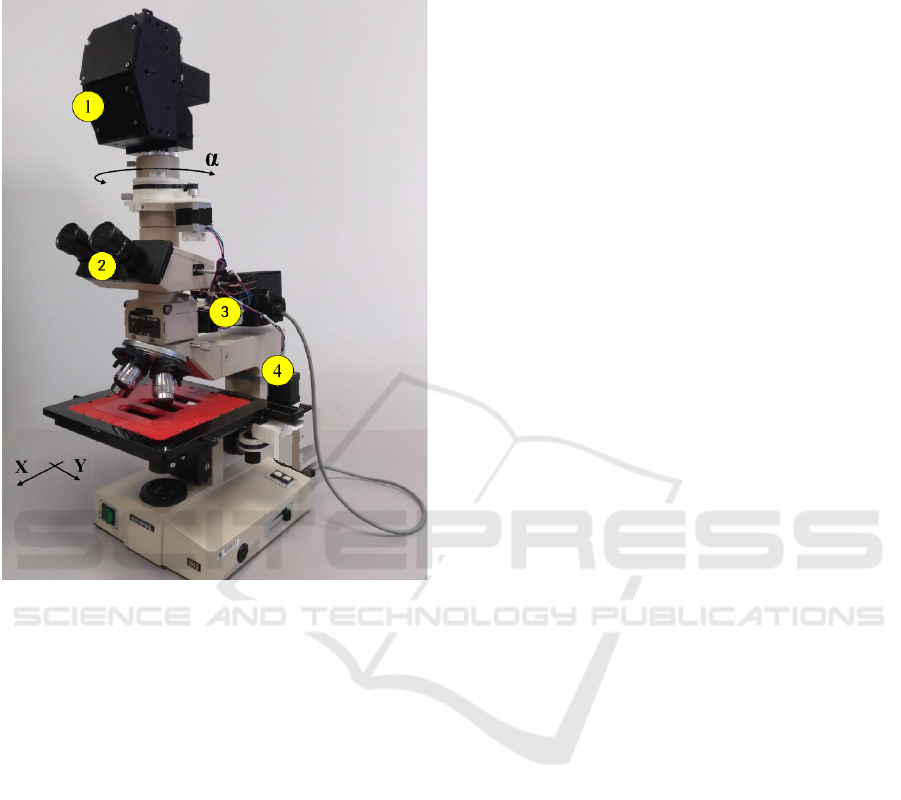
A typical HMI system consists of two parts: the opti-
cal and the mechanical subsystems. The optical sub-
system includes: (1) hyperspectral camera and (2)
a microscope, while the mechanical section is com-
posed of (3) a controller of the mechanical system and
(4) a stepper motor for stage movement control (Fig-
ure 4). Point scanning, and line scanning are among
major methods for acquiring hyperspectral images. A
point scanning hyperspectral camera can measure a
spectrum for each pixel at a time. To construct a
whole image, the sample should be re-positioned in
both x and y direction. The hyperspectral camera
shown in figure 4, is an example of point-scan imager
that the stage can move in both X and Y directions
(horizontal directions). A line-scan imager collects
data, one vertical line at a time. The stage movement
is only in one direction (left to right or right to left).
SIGMAP 2021 - 18th International Conference on Signal Processing and Multimedia Applications
112
To create two spatial dimensions, multiple lines are
assembled to form a complete image. The stepper
motor electronically controls stage’s movement.
Figure 4: The microscopic hyperspectral imaging system
(Ortega et al., 2019).
A microscope can acquire information about the
microstructure of a sample. Microscope types used
with HMI technology are fluorescence, confocal, and
dark field.
The fluorescence microscopy uses the fact that
light incident on molecule is absorbed and then emit-
ted in a different color, a process known as fluores-
cence. Being more sensitive, fluorescence micro-
scopes have gained several advantages over the re-
flected or transmitted ones. Often, it is possible to
attach fluorescent molecules to specific parts of the
specimen, making them the only visible ones in the
microscope .
The confocal microscope acts like a fluorescence
microscope, but instead of illuminating the whole
sample at the same time, it illuminates by passing
light through a defined point at specific depth, and
thus produces high resolution 3D images of the sam-
ple (Semwogerere and Weeks, 2005).
Dark-field microscope has the advantage of be-
ing a background-free which provides high sensitiv-
ity and a large signal-to-noise ratio. The un-scattered
light path and its reflection from the surface is ex-
cluded from the angular range of signal detection,
which causes flat surfaces to appear dark. This tech-
nology is usually utilized in imaging of live and un-
stained biological samples. Although producing the
high quality images, dark-field microscope provides
low light levels seen in the final image. Therefore, the
sample must be very strongly illuminated which can
damage the specimen (Harutyunyan et al., 2010).
3 HMI APPLICATIONS
Combining the advantages of hyperspectral technol-
ogy with microscopic imaging, the two past decades
have witnessed a growth of research interest in HMI
technology in numerous areas. Unlike conventional
microscope images, HMIs have a high spectral res-
olution which enables them to provide rapid, non-
destructive, and chemical-free evaluation methods.
This section briefly highlights applications of HMI in
medicine and biology.
3.1 Medicine
The HMI has been the fastest-growing and of a high-
demand in the medicine field where it has emerged as
a potential tool for non-invasive and accurate disease
diagnosis as well as treatment monitoring. It is of-
ten utilized for various tasks, including object identi-
fication or detection, visualization, classification, and
feature extraction or measurement.
To increases the chances of survival of patients,
early diagnosis of a fatal disease is an essential key
to treat it. For example, many cancer types can be
treated with a high chance of cure at early stages,
but late diagnosis makes the treatment difficult or im-
possible. To overcome the difficulties of traditional
inspection, automated visual inspection systems can
assist in identifying suspicious region in real-time
that can significantly increase the precision as well as
the treatment’s accuracy. HMI systems have shown
their potential as an alternative imaging technology in
identification or detection cells or tissues with high
sensitivity and specificity.
Table 1 summarizes various implemented ap-
plication examples, in terms of image data (or-
gans/specimens), spectral range measured in nanome-
ter (nm), spatial resolution (RES) in micrometer (µm),
microscope type, and research achievement.
Although pathology diagnosis is important, con-
ventional methods of pathology analysis important
for diagnosis, usually require numerous laborious,
time consuming procedures such as freezing, slicing,
Hyperspectral Methods in Microscopy Image Analysis: A Survey
113

Table 1: Summary of key variables for object detection or
identification in hyperspectral microscopy images.
Author,
Year
Data Spectral
Range
Spatial
RES
Micro-
scope
Achievement
(Ben Ami
et al.,
2016)
RPE
420-
720
-
fluo-
rescence
retinal health
& disease
investigation
(Leavesley
et al.,
2016)
colore-
ctal
tissue
390-
450
-
fluo-
rescence
early
cancer
detection
(Seo
et al.,
2016)
five
Staphy
lococcus
species
450 -
800
-
dark
field
Staphy
lococcus
species
identification
(Wang
et al.,
2016)
cervical
tissue
500 -
900
6.43 fluo-
rescence
early
cancer
detection
(cellular&
tissue)
(Graus
et al.,
2017)
peri-
pheral
blood
500 –
850
- fluo-
rescence
Candida
species
early& accu-
rate
identification
(Michael
et al.,
2017)
mouse
brain
tissue
-
0.47 fluo-
rescence
early
Alzheimer
detection
(Nystr
¨
om
et al.,
2017)
mouse
brain
tissue
490 -
586
-
confocal
Amyloid
deposits
detection
in tissue
(Palombo
et al.,
2018)
transge-
nic
mouse
brain
tissue
-
2 - 8 confocal early
Alzheimer
detection
(Wang
et al.,
2018)
rat bile
duct
carci-
noma
550 -
1000
- -
liver
tumor
analysis
(Yuan
et al.,
2018)
colon
tissue
400 -
1000
6450
-
early
cancer
detection
(Mahbub
et al.,
2019)
articular
cartilage
tissue
400 -
900
-
fluo-
rescence
treatment
effects
detection
(Paugh
et al.,
2019)
eyelid
tissue
expressed
human
meibum
2800-
3050
(cm
−
1)
0.46
fluo-
rescence
protein lipid
compositional
detection
(Song
et al.,
2019)
ALK
P/N
lung
cancer
tissue
550 -
1000
3 -
early
lung
cancer
detection
(Wei
et al.,
2019)
renal
biopsy
tissue
400 -
1000
-
fluo-
rescence
membranous
nephropathy
detection
Author,
Year
Data Spectral
Range
Spatial
RES
Micro-
scope
Achievement
(Liu et al.,
2020)
mouse’s ear
skin
400 -
720
6 photo-
acoustic
early stage
cutaneous
cancers
detection
(Laimer
et al.,
2021)
FFPE tissue
450-
900
0.116 fluo-
rescence
amalgam
tattoos&other
pigmented in-
traoral lesions
identification
(Liu et al.,
2021)
normal
hepatic &
hepatic
carcinomas tis-
sue
450-
720
- fluo-
rescence
hepatic
carcinoma
cells
identification
hematoxylin and eosin staining, and manual analysis
which makes the diagnostic procedure much harder.
While healthy and normal cells or tissues are gener-
ally easier to distinguish, differentiating benign and
malignant ones is challenging. The accurate differ-
entiation depends on the experience of the histologi-
cal specialist. For example, to avoid unnecessary tis-
sue resection during surgery, tumor margins need to
be determined precisely. To reduce this burden, non-
invasive, rapid, and image-based classification system
are highly demanded. A microscope paired with hy-
perspectral imaging (HSI), has been shown to pro-
vide significant performance and promising results
for classification task.
Table 2 summarizes examples of classification
models, with key information on features.
Table 2: Summary of key variables of hyperspectral mi-
croscopy images classification.
Author,
Year
Data
Spectral
Range
Spatial
RES
Micro-
scope
Classification
Achievement
(Deal
et al.,
2016)
Sprague
Dawley
rat
360-
600
-
fluo-
rescence
hepatic carci-
noma cells
(Thatcher
et al.,
2016)
skin
tissue
400-
1000
1-10 fluo-
rescence
burn
injuries skin
(Alfonso-
Garc
´
ıa
et al.,
2017)
pooled
meibum
2800
-3050
(cm
−
1)
0.46 fluo-
rescence
human
expressed
meibum spec-
tral
reference
(Bertani
et al.,
2017)
PBMC 500-
1000
1.95 epifluo-
rescence
M1/M2 polar-
ized human
macrophages
(Chen
et al.,
2019)
human
ovarian
cells
470-
900
-
fluo-
rescence
live& dead
human ovar-
ian
cancer cells
SIGMAP 2021 - 18th International Conference on Signal Processing and Multimedia Applications
114

Table 2: Summary of key variables of hyperspectral mi-
croscopy images classification (cont.).
Author,
Year
Data
Spectral
Range
Spatial
RES
Micro-
scope
Classification
Achievement
(Duan
et al.,
2019)
blood
cells
- - -
Leukocyte
(Ogi
et al.,
2019)
human
neural
stem cells
470-
900
3.65
-
neuronal cells
(Septiana
et al.,
2019)
human
pancreas
tissue
350-
1100
-
optical elastic & col-
lagen
fibers
(Bengs
et al.,
2020)
suspicious
&healthy
area
multi-
spectral
endoscopic
videos
430-
680
-
optical in-vivo head
&
neck
tumor type
(de Lu-
cena
et al.,
2020)
epithelial
tissue
900-
2500
1900
-
skin tumor
(Huang
et al.,
2020)
blood
cells
400-
720
- -
blood cells
(Wang
et al.,
2020a)
HCC
biopsy
400-
720
-
multi-
photon
HCC
(Lv
et al.,
2021)
renal
biopsy
tissue
400-
1000
-
optical Membranous
Nephropathy
(Sun
et al.,
2021)
bile duct
tissue
550-
1000
- -
CC
The HSI has the advantage of acquiring spectrally
encoded information that can be utilized for disease
diagnosis purposes and surgery guidance in different
ways, such as contrast enhancement for visualization
or segmentation tasks, and virtually staining a tissue
or an organ without any chemical involvement.
The summary of the related studies is presented in
Table 3.
Extracting valuable information in medical im-
ages to identify the hidden pattern or subtle relation-
ship is a valuable task that leads to special medical
knowledge discovery that is critical to the accuracy of
diagnosis and treatment. Hyperspectral imaging tech-
nology is a promising technology to assist in feature
extraction and measurement tasks.
Relevant studies are reviewed in Table 4.
Table 3: Summary of key variables in hyperspectral micro-
scopic data visualization.
Author,
Year
Data
Spectral
Range
Spatial
RES
Micro-
scope
Achievement
(Lin et al.,
2016)
Phantom
& ex-
vivo
tissue
- - -
tissue surface
imaging
(Pichette
et al.,
2016)
in-vivo
brain
tissue
480 -
650
5.5
neuro-
surgical
brain hemo-
dynamic
behavior
visulaization
(Sen et al.,
2016)
in-vivo
blood
cells &
vessels
(mouse’s
retina)
800 -
1000
2 dark
field
increasing
leukocytes
OCT contrast
(Zhang
et al.,
2016)
H&E
stained
breast
cancer
tissue
400 -
700
1.12 lens-
free
high
resolution
,accurate
color
reproduction
(Bayramoglu
et al.,
2017)
mouse
lung
tissue
500 -
1000
- -
virtual stain-
ing
(Li et al.,
2017)
in-vivo
retinal
tissue
(long-
Evans)
460 -
630
5.5
com-
mercial
rodent retina
color recov-
ery & vessel
contrast
enhancement
Table 4: Summary of key variables of feature extraction and
measurement tasks in hyperspectral microscope images.
Author,
Year
Data
Spectral
Range
Spatial
RES
Micro-
scope
Achievement
(Li et al.,
2017)
in-vivo
retinal
tissue
(long-
Evans)
460 -
630
5.5
comm-
ercial
retinal
oxygen
saturation
measurement
(Dey et al.,
2019)
ex vivo
retina tis-
sue
400 –
750
-
fluore-
scence
autofluorescent
substances fea-
ture extraction
(Brouwer de
Koning
et al.,
2021)
OSCC
- - -
deep resection
oral cancer
margin
assessment
3.2 Biology
One of the major applications of hyperspectral tech-
niques is within biology that has been found to be ef-
fective in matching between spectral signatures and
the nature or evolution on many different types of
cells. It is also a powerful tool in identification of
chemical compositions of complex samples such as
cell lysates or bio-fluids. In addition, microscopes are
Hyperspectral Methods in Microscopy Image Analysis: A Survey
115

essential for the analysis of small living organisms,
mapping of proteins and genes, or cellular interac-
tions and pathways. Therefore, using hyperspectral
imaging methods in combination with microscopy,
presents a great potential for biological samples anal-
ysis.
Table 5 summarizes recent research achievements
in this area.
Table 5: Summery of some biological applications of hy-
perspectral microscope imaging techniques.
Author,
Year
Data
Spectral
Range
Spatial
RES
Micro-
scope
Achievement
(Annamdevula
et al., 2016)
-
-
420 -
724
-
confocal 3D FRET
measurement
(Bradley
et al., 2016)
mouse
oocytes
& pre-
implant-
ation
embryos
> 900 0.1 confocal
quantitative im-
ages of
lipids in
live mouse
oocytes &
earlyembryos
(Cui et al.,
2016)
HeLa,
MCF7,
SKBR3
cells
300 -
700
5 - 10 dark
field
SE-cell optical
clearing
methodology
(Holzinger
et al., 2016)
Chloro-
phyta&
Charo-
phyta
400 -
900
-
epifluo-
rescence
different genera
determination
(Misra et al.,
2016)
-
400 -
1000
-
dark
field
prodrug-
passivated car-
bon
nanoparticle
synthesis
(Rebner et al.,
2016)
peri-
pheral
lympho-
cyte
cultures
400 -
1000
-
dark
field
characterising
unstained
human
metaphase
chromosomes
(Bae et al.,
2019)
Staphy
lococcus
aureus
680 -
1300
0.3125
SRS interplay be-
tween
vancomycin &
biofilm
components dy-
namic
visualization
(Barnhart-
Dailey et al.,
2019)
cyano-
bacterial
500 -
800
-
confocal tolyporphins &
unusual
tetrapyrroles
cellular
localization
(Fu et al.,
2019)
living
HeLa
cells
200 -
1100
-
selfref-
lectance
living cel-
lular nano-
architecture
labelfree CT
(Wang et al.,
2020b)
E.coli in
LB
400 -
1000
2 - 6 confocal monitoring
Escherichia
coli biofilms
formation
Author,
Year
Data
Spectral
Range
Spatial
RES
Micro-
scope
Achievement
(Nahmad-
Rohen
et al.,
2020)
DOPC,
SPH &
CHOL
Ternary
mixture
2700-
3100
(cm
−
1)
0.1 epifluo-
rescence
lipid
partitioning
in SE planar
membrane
bilayers
visualization
(Farr
et al.,
2021)
human
dermal
fibrob-
lasts
- -
SEM
sterilization
effect
analysis on bio-
material
surfaces
4 CONCLUSIONS
HMI systems integrate the advantage of conventional
spectroscopy imaging and microscopy techniques to
provide relevant information of samples at the molec-
ular or cellular level by providing spatial and spectral
information simultaneously. Therefore, HMI tools
show great potential in nondestructive evaluation as
well as object identification or classification. How-
ever, microscopic image analysis is a laborious and
error-prone task that is too complex to be performed
manually.
Despite the above achievements, there are still many
challenges to be overcome in order to to utilize the
full potential of HMI in biomedical applications. Data
collection is one of the major challenges. In addi-
tion, models established based on a certain HMI sys-
tem cannot be easily adopted by another one. Finally,
HMI technology is more expensive than other conven-
tional equipments due to its high spatial and spectral
resolutions
The presented survey summarizes the key features
of HMIs systems and their applications in medical
and biology fields. The analysis of the research work
demonstrates that HMI has broad applications rang-
ing from laboratory tasks to clinical studies, yet the
future research is still needed to make this technology
more efficient and accessible.
REFERENCES
Alfonso-Garc
´
ıa, A., Paugh, J., Farid, M., Garg, S., Jester, J.,
and Potma, E. (2017). A machine learning framework
to analyze hyperspectral stimulated Raman scatter-
ing microscopy images of expressed human meibum:
HsSRS microscopy and machine learning analysis of
human meibum. Journal of Raman Spectroscopy,
48(6):803–812.
Annamdevula, N. S., Sweat, R., Britain, A., Rich, T. C.,
and Leavesley, S. J. (2016). Hyperspectral Imaging
SIGMAP 2021 - 18th International Conference on Signal Processing and Multimedia Applications
116

Approaches for Measuring Three-Dimensional FRET.
The FASEB Journal, 30(S1):969.27–969.27.
Bae, K., Zheng, W., Ma, Y., and Huang, Z. (2019). Real-
Time Monitoring of Pharmacokinetics of Antibiotics
in Biofilms with Raman-Tagged Hyperspectral Stim-
ulated Raman Scattering Microscopy. Theranostics,
9(5):1348–1357.
Barnhart-Dailey, M., Zhang, Y., Zhang, R., Anthony, S. M.,
Aaron, J. S., Miller, E. S., Lindsey, J. S., and Tim-
lin, J. A. (2019). Cellular localization of tolyporphins,
unusual tetrapyrroles, in a microbial photosynthetic
community determined using hyperspectral confocal
fluorescence microscopy. Photosynthesis Research,
141(3):259–271.
Bayramoglu, N., Kaakinen, M., Eklund, L., and Heikkila, J.
(2017). Towards Virtual H&E Staining of Hyperspec-
tral Lung Histology Images Using Conditional Gen-
erative Adversarial Networks. In 2017 IEEE Inter-
national Conference on Computer Vision Workshops
(ICCVW), pages 64–71, Venice, Italy. IEEE.
Ben Ami, T., Tong, Y., Bhuiyan, A., Huisingh, C.,
Ablonczy, Z., Ach, T., Curcio, C. A., and Smith,
R. T. (2016). Spatial and Spectral Characterization
of Human Retinal Pigment Epithelium Fluorophore
Families by Ex Vivo Hyperspectral Autofluorescence
Imaging. Translational Vision Science & Technology,
5(3):5.
Bengs, M., Gessert, N., Laffers, W., Eggert, D., Wester-
mann, S., Mueller, N. A., Gerstner, A. O. H., Betz, C.,
and Schlaefer, A. (2020). Spectral-spatial Recurrent-
Convolutional Networks for In-Vivo Hyperspectral
Tumor Type Classification. In Martel, A. L., Abol-
maesumi, P., Stoyanov, D., Mateus, D., Zuluaga,
M. A., Zhou, S. K., Racoceanu, D., and Joskow-
icz, L., editors, Medical Image Computing and Com-
puter Assisted Intervention – MICCAI 2020, volume
12263, pages 690–699. Springer International Pub-
lishing, Cham. Series Title: Lecture Notes in Com-
puter Science.
Bertani, F. R., Mozetic, P., Fioramonti, M., Iuliani, M., Ri-
belli, G., Pantano, F., Santini, D., Tonini, G., Trom-
betta, M., Businaro, L., Selci, S., and Rainer, A.
(2017). Classification of M1/M2-polarized human
macrophages by label-free hyperspectral reflectance
confocal microscopy and multivariate analysis. Sci-
entific Reports, 7(1):8965.
Bradley, J., Pope, I., Masia, F., Sanusi, R., Langbein, W.,
Swann, K., and Borri, P. (2016). Quantitative imag-
ing of lipids in live mouse oocytes and early em-
bryos using CARS microscopy. Development, page
dev.129908.
Brouwer de Koning, S. G., Schaeffers, A. W. M. A., Schats,
W., van den Brekel, M. W. M., Ruers, T. J. M., and
Karakullukcu, M. B. (2021). Assessment of the deep
resection margin during oral cancer surgery: A sys-
tematic review. European Journal of Surgical Oncol-
ogy: The Journal of the European Society of Surgical
Oncology and the British Association of Surgical On-
cology.
Chen, H., Ho, B., Wang, H., Tan, S. H., Zhao, C.-X.,
Nguyen, N.-T., Gao, Y., and Zhou, J. (2019). Auto-
matic Live and Dead Cell Classification via Hyper-
spectral Imaging. In 2019 10th Workshop on Hyper-
spectral Imaging and Signal Processing: Evolution
in Remote Sensing (WHISPERS), pages 1–5, Amster-
dam, Netherlands. IEEE.
Constantinou, P., Dacosta, R., and Wilson, B. (2009). Ex-
tending immunofluorescence detection limits in whole
paraffin-embedded formalin fixed tissues using hyper-
spectral confocal fluorescence imaging. Journal of
Microscopy, 234(2):137–146.
Cui, Y., Wang, X., Ren, W., Liu, J., and Irudayaraj, J.
(2016). Optical Clearing Delivers Ultrasensitive Hy-
perspectral Dark-Field Imaging for Single-Cell Eval-
uation. ACS Nano, 10(3):3132–3143.
de Lucena, D. V., da Silva Soares, A., Coelho, C. J.,
Wastowski, I. J., and Filho, A. R. G. (2020). Detection
of Tumoral Epithelial Lesions Using Hyperspectral
Imaging and Deep Learning. In Krzhizhanovskaya,
V. V., Z
´
avodszky, G., Lees, M. H., Dongarra, J. J.,
Sloot, P. M. A., Brissos, S., and Teixeira, J., editors,
Computational Science – ICCS 2020, pages 599–612,
Cham. Springer International Publishing.
Deal, J. A., Favreau, P., Weber, D., Rich, T., and Leaves-
ley, S. (2016). Potential of Hyperspectral Imaging for
Label-free Tissue and Pathology Classification. The
FASEB Journal, 30(S1).
Dey, N., Hong, S., Ach, T., Koutalos, Y., Curcio, C. A.,
Smith, R. T., and Gerig, G. (2019). Tensor decom-
position of hyperspectral images to study autofluores-
cence in age-related macular degeneration. Medical
Image Analysis, 56:96–109.
Duan, Y., Wang, J., Hu, M., Zhou, M., Li, Q., Sun, L.,
Qiu, S., and Wang, Y. (2019). Leukocyte classifica-
tion based on spatial and spectral features of micro-
scopic hyperspectral images. Optics & Laser Tech-
nology, 112:530–538.
Farr, N., Thanarak, J., Sch
¨
afer, J., Quade, A., Claeyssens,
F., Green, N., and Rodenburg, C. (2021). Understand-
ing Surface Modifications Induced via Argon Plasma
Treatment through Secondary Electron Hyperspectral
Imaging. Advanced Science, 8(4):2003762.
Fu, R., Su, Y., Wang, R., Lin, X., Jiang, K., Jin, X.,
Yang, H., Ma, L., Luo, X., Lu, Y., and Huang,
G. (2019). Label-free tomography of living cellular
nanoarchitecture using hyperspectral self-interference
microscopy. Biomedical Optics Express, 10(6):2757.
Graus, M. S., Neumann, A. K., and Timlin, J. A. (2017).
Hyperspectral fluorescence microscopy detects aut-
ofluorescent factors that can be exploited as a diagnos-
tic method for Candida species differentiation. Jour-
nal of Biomedical Optics, 22(1):016002.
Harutyunyan, H., Palomba, S., Renger, J., Quidant, R.,
and Novotny, L. (2010). Nonlinear Dark-Field Mi-
croscopy. Nano Letters, 10(12):5076–5079. Pub-
lisher: American Chemical Society.
Holzinger, A., Allen, M. C., and Deheyn, D. D. (2016).
Hyperspectral imaging of snow algae and green algae
from aeroterrestrial habitats. Journal of Photochem-
istry and Photobiology B: Biology, 162:412–420.
Huang, Q., Li, W., Zhang, B., Li, Q., Tao, R., and Lovell,
N. H. (2020). Blood Cell Classification Based on Hy-
perspectral Imaging With Modulated Gabor and CNN.
Hyperspectral Methods in Microscopy Image Analysis: A Survey
117

IEEE Journal of Biomedical and Health Informatics,
24(1):160–170.
Laimer, J., Bruckmoser, E., Helten, T., Kofler, B., Zel-
ger, B., Brunner, A., Zelger, B., Huck, C. W., Tap-
pert, M., Rogge, D., Schirmer, M., and Pallua, J. D.
(2021). Hyperspectral imaging as a diagnostic tool to
differentiate between amalgam tattoos and other dark
pigmented intraoral lesions. Journal of Biophotonics,
14(2).
Leavesley, S. J., Walters, M., Lopez, C., Baker, T., Favreau,
P. F., Rich, T. C., Rider, P. F., and Boudreaux, C. W.
(2016). Hyperspectral imaging fluorescence excita-
tion scanning for colon cancer detection. Journal of
Biomedical Optics, 21(10):104003.
Li, H., Liu, W., Dong, B., Kaluzny, J. V., Fawzi, A. A., and
Zhang, H. F. (2017). Snapshot hyperspectral retinal
imaging using compact spectral resolving detector ar-
ray. Journal of Biophotonics, 10(6-7):830–839.
Lin, J., Clancy, N. T., Sun, X., Qi, J., Janatka, M., Stoy-
anov, D., and Elson, D. S. (2016). Probe-Based
Rapid Hybrid Hyperspectral and Tissue Surface Imag-
ing Aided by Fully Convolutional Networks. In
Ourselin, S., Joskowicz, L., Sabuncu, M. R., Unal,
G., and Wells, W., editors, Medical Image Computing
and Computer-Assisted Intervention - MICCAI 2016,
volume 9902, pages 414–422. Springer International
Publishing, Cham. Series Title: Lecture Notes in
Computer Science.
Liu, K., Lin, S., Zhu, S., Chen, Y., Yin, H., Li, Z., and Chen,
Z. (2021). Hyperspectral microscopy combined with
DAPI staining for the identification of hepatic carci-
noma cells. Biomedical Optics Express, 12(1):173.
Liu, N., Chen, Z., and Xing, D. (2020). Integrated photoa-
coustic and hyperspectral dual-modality microscopy
for co-imaging of melanoma and cutaneous squamous
cell carcinoma in vivo. Journal of Biophotonics,
13(8).
Lv, M., Li, W., Tao, R., and Lovell, N. H. (2021). Spatial-
Spectral Density Peaks-Based Discriminant Analysis
for Membranous Nephropathy Classification Using
Microscopic Hyperspectral Images. IEEE Journal of
Biomedical and Health Informatics, pages 1–1.
Mahbub, S. B., Guller, A., Campbell, J. M., Anwer, A. G.,
Gosnell, M. E., Vesey, G., and Goldys, E. M. (2019).
Non-Invasive Monitoring of Functional State of Ar-
ticular Cartilage Tissue with Label-Free Unsupervised
Hyperspectral Imaging. Scientific Reports, 9(1):4398.
Michael, R., Lenferink, A., Vrensen, G. F. J. M., Gelpi, E.,
Barraquer, R. I., and Otto, C. (2017). Hyperspectral
Raman imaging of neuritic plaques and neurofibril-
lary tangles in brain tissue from Alzheimer’s disease
patients. Scientific Reports, 7(1):15603.
Misra, S. K., Ostadhossein, F., Daza, E., Johnson, E. V.,
and Pan, D. (2016). Hyperspectral Imaging Offers Vi-
sual and Quantitative Evidence of Drug Release from
Zwitterionic-Phospholipid-Nanocarbon When Con-
currently Tracked in 3D Intracellular Space. Advanced
Functional Materials, 26(44):8031–8041.
Nahmad-Rohen, A., Regan, D., Masia, F., McPhee, C.,
Pope, I., Langbein, W., and Borri, P. (2020). Quanti-
tative Label-Free Imaging of Lipid Domains in Single
Bilayers by Hyperspectral Coherent Raman Scatter-
ing. Analytical Chemistry, 92(21):14657–14666.
Nystr
¨
om, S., B
¨
ack, M., Nilsson, K. P. R., and Ham-
marstr
¨
om, P. (2017). Imaging Amyloid Tissues
Stained with Luminescent Conjugated Oligothio-
phenes by Hyperspectral Confocal Microscopy and
Fluorescence Lifetime Imaging. Journal of Visualized
Experiments, (128):56279.
Ogi, H., Moriwaki, S., Kokubo, M., Hikida, Y., and Itoh, K.
(2019). Label-free classification of neurons and glia in
neural stem cell cultures using a hyperspectral imag-
ing microscopy combined with machine learning. Sci-
entific Reports, 9(1):633.
Ortega, S., Guerra, R., Diaz, M., Fabelo, H., Lopez, S., Cal-
lico, G. M., and Sarmiento, R. (2019). Hyperspec-
tral Push-Broom Microscope Development and Char-
acterization. IEEE Access, 7:122473–122491.
Palombo, F., Masia, F., Mattana, S., Tamagnini, F., Borri, P.,
Langbein, W., and Fioretto, D. (2018). Hyperspectral
analysis applied to micro-Brillouin maps of amyloid-
beta plaques in Alzheimer’s disease brains. The Ana-
lyst, 143(24):6095–6102.
Paugh, J. R., Alfonso-Garcia, A., Nguyen, A. L., Suhalim,
J. L., Farid, M., Garg, S., Tao, J., Brown, D. J., Potma,
E. O., and Jester, J. V. (2019). Characterization of
expressed human meibum using hyperspectral stimu-
lated Raman scattering microscopy. The Ocular Sur-
face, 17(1):151–159.
Pichette, J., Laurence, A., Angulo, L., Lesage, F.,
Bouthillier, A., Nguyen, D. K., and Leblond, F.
(2016). Intraoperative video-rate hemodynamic re-
sponse assessment in human cortex using snapshot hy-
perspectral optical imaging. Neurophotonics, 3(04):1.
Rebner, K., Ostertag, E., and Kessler, R. W. (2016). Hyper-
spectral backscatter imaging: a label-free approach to
cytogenetics. Analytical and Bioanalytical Chemistry,
408(21):5701–5709.
Schultz, R. A., Nielsen, T., Zavaleta, J. R., Ruch, R., Wyatt,
R., and Garner, H. R. (2001). Hyperspectral imaging:
A novel approach for microscopic analysis. Cytome-
try, 43(4):239–247.
Semwogerere, D. and Weeks, E. R. (2005). G. Wnek,
G. Bowlin (Eds.), Encyclopedia of Biomaterials and
Biomedical Engineerin. Taylor and Francis, New
York.
Sen, D., SoRelle, E. D., Liba, O., Dalal, R., Paulus, Y. M.,
Kim, T.-W., Moshfeghi, D. M., and de la Zerda,
A. (2016). High-resolution contrast-enhanced opti-
cal coherence tomography in mice retinae. Journal
of Biomedical Optics, 21(06):1.
Seo, Y., Park, B., Hinton, A., Yoon, S.-C., and Lawrence,
K. C. (2016). Identification of Staphylococcus species
with hyperspectral microscope imaging and classifi-
cation algorithms. Journal of Food Measurement and
Characterization, 10(2):253–263.
Septiana, L., Suzuki, H., Ishikawa, M., Obi, T., Kobayashi,
N., Ohyama, N., Ichimura, T., Sasaki, A., Wihardjo,
E., and Andiani, D. (2019). Elastic and collagen fibers
discriminant analysis using H&E stained hyperspec-
tral images. Optical Review, 26(4):369–379.
Song, J., Hu, M., Wang, J., Zhou, M., Sun, L., Qiu, S., Li,
Q., Sun, Z., and Wang, Y. (2019). ALK positive lung
SIGMAP 2021 - 18th International Conference on Signal Processing and Multimedia Applications
118

cancer identification and targeted drugs evaluation us-
ing microscopic hyperspectral imaging technique. In-
frared Physics & Technology, 96:267–275.
Sun, L., Zhou, M., Li, Q., Hu, M., Wen, Y., Zhang, J., Lu,
Y., and Chu, J. (2021). Diagnosis of cholangiocar-
cinoma from microscopic hyperspectral pathological
dataset by deep convolution neural networks. Meth-
ods.
Thatcher, J. E., Squiers, J. J., Kanick, S. C., King, D. R., Lu,
Y., Wang, Y., Mohan, R., Sellke, E. W., and DiMaio,
J. M. (2016). Imaging Techniques for Clinical Burn
Assessment with a Focus on Multispectral Imaging.
Advances in Wound Care, 5(8):360–378.
Tsurui, H., Lerner, J. M., Takahashi, K., Hirose, S., Mitsui,
K., Okumura, K., and Shirai, T. (1999). Hyperspectral
imaging of pathology samples. pages 273–281, San
Jose, CA.
Wang, C., Zheng, W., Bu, Y., Chang, S., Zhang, S., and Xu,
R. X. (2016). Multi-scale hyperspectral imaging of
cervical neoplasia. Archives of Gynecology and Ob-
stetrics, 293(6):1309–1317.
Wang, J., Hu, M., Zhou, M., Sun, L., and Li, Q. (2018). Seg-
mentation of Pathological Features of Rat Bile Duct
Carcinoma from Hyperspectral Images. In 2018 11th
International Congress on Image and Signal Process-
ing, BioMedical Engineering and Informatics (CISP-
BMEI), pages 1–5, Beijing, China. IEEE.
Wang, R., He, Y., Yao, C., Wang, S., Xue, Y., Zhang, Z.,
Wang, J., and Liu, X. (2020a). Classification and
Segmentation of Hyperspectral Data of Hepatocellular
Carcinoma Samples Using 1-D Convolutional Neural
Network. Cytometry Part A, 97(1):31–38.
Wang, Y., Reardon, C. P., Read, N., Thorpe, S., Evans,
A., Todd, N., Van Der Woude, M., and Krauss, T. F.
(2020b). Attachment and antibiotic response of early-
stage biofilms studied using resonant hyperspectral
imaging. npj Biofilms and Microbiomes, 6(1):57.
Wei, X., Tu, T., Zhang, N., Yang, Y., Li, W., and Li, W.
(2019). Membranous Nephropathy Identification Us-
ing Hyperspectral Microscopic Images. In Lin, Z.,
Wang, L., Yang, J., Shi, G., Tan, T., Zheng, N., Chen,
X., and Zhang, Y., editors, Pattern Recognition and
Computer Vision, pages 173–184, Cham. Springer In-
ternational Publishing.
Wu, Q., Merchant, F. A., and Castleman, K. R., edi-
tors (2008). Microscope image processing. Else-
vier/Academic Press, Amsterdam ; Boston.
Yuan, X., Zhang, D., Wang, C., Dai, B., Zhao, M., and
Li, B. (2018). Hyperspectral Imaging and SPA–LDA
Quantitative Analysis for Detection of Colon Cancer
Tissue. Journal of Applied Spectroscopy, 85(2):307–
312.
Zhang, Y., Wu, Y., Zhang, Y., and Ozcan, A. (2016). Color
calibration and fusion of lens-free and mobile-phone
microscopy images for high-resolution and accurate
color reproduction. Scientific Reports, 6(1):27811.
APPENDIX
Acronyms
AMD age-related macular degeneration
CC cholangiocarcinoma
CT computed tomography
CHOL cholesterol
E.coli escherichia coli
DOPC dioleoylphosphatidylcholine
FFPE formalin-fixed paraffin-embedded
FRET f
¨
orster resonance energy transfer
H&E hematoxylin and eosin stain
HCC hepatocellular carcinoma
HeLa henrietta lacks
HMI hyperspectral microscope imaging
HSI hyperspectral imaging
LB luria-bertani
MCF7 Michigan cancer foundation-7
OCT optical coherence tomography
OSCC oral squamous cell carcinoma
PBMC peripheral blood mononuclear cells
P/N positive and negative
RES resolution
RPE retinal pigment epithelium
SEM scanning electron microscope
SE single
SRS stimulated raman scatering
SPH sphingomyelin
TP tolyporphins
Hyperspectral Methods in Microscopy Image Analysis: A Survey
119
