DigiMove Analysis for Manufacturing SMEs to Identify Their
Current Status and next Digitalisation Steps
Leila Saari
1a
, Risto Kuivanen
2b
and Jyrki Poikkimäki
2c
1
VTT Technical Research Centre of Finland Ltd, Kaitoväylä 1, Oulu, Finland
2
VTT Technical Research Centre of Finland Ltd, Visiokatu 4, Tampere, Finland
Keywords: Manufacturing SME, Digital Transformation, beyond Industry 4.0, Digitalisation.
Abstract: The digitalisation level of Finnish manufacturing companies must be improved in order to remain in Finland
and keep the manufacturing industry competitive. Digitalisation was found to have a positive correlation with
the business result. This was discovered by analysing the digitalisation level of 43 manufacturing companies
in Finland. The analysis was performed with the DigiMove matrix, which contains the following six
digitalisation subjects: i) Manufacturing, ii) Products and services, iii) Digital skills of production staff, iv)
Foresight, v) Customer interface, and vi) Administrative functions. It also contains five maturity levels: i)
General, ii) Improved, iii) Advanced, iv) Forerunner, and v) Future opportunity. Each cell in the matrix
contains the description of the expected digital solutions to be used and implemented. These descriptions were
discussed in detail with each company in the workshop, and their actual level of digitalisation was jointly
defined. In addition to the instant analysis map created in the workshop, each company also received
recommendations for their next digitalisation steps within a week. Subsequently, 43 DigiMove statistical
analyses were conducted with the companies’ public financial data, and a positive correlation was found
between digitalisation and the financial result.
1 INTRODUCTION
Digital transformation is sweeping across the globe,
much like the current pandemic, and is affecting the
manufacturing industry, too. It is evident that the
manufacturing industry shall and will proceed
towards Industry 4.0 and beyond. Digitalisation of the
manufacturing industry is developing from the
manual data management of single companies to
intelligent data processing and analytics in partner
networks enriched by the capabilities of artificial
intelligence (Heilala et al., 2020). The long-term
digitalisation goal for the manufacturing industry is
for digitalisation to support all manufacturing
processes and enable safe and transparent
collaboration within a partner network. The European
Union (EU) promotes a twin transition of the
industry, combining both green values and
digitalisation goals (Paasi et al., 2020) (European
Comission, 2021).
a
https://orcid.org/0000-0001-6789-3497
b
https://orcid.org/0000-0002-3491-8915
c
https://orcid.org/0000-0001-9128-3576
The digitalisation level of Finnish manufacturing
companies must be improved in order to remain in
Finland and keep the industry competitive.
Manufacturing is considered a technology industry by
the association of Technology Industries of Finland.
According to its statistics the technology industry
provides direct employment to approximately
313,000 people and indirect employment to about
660,000 people, and it represents over 50% of
Finland’s exports. In Finland, all companies’ export
of goods was about €65 billion in 2019. The share of
SMEs amounted to €9.4 billion, or 15%, of this total.
SMEs are responsible approximately 17% of the
technology industry’s export of goods (Technology
Industries of Finland, 2021).
Saari, L., Kuivanen, R. and Poikkimäki, J.
DigiMove Analysis for Manufacturing SMEs to Identify Their Current Status and next Digitalisation Steps.
DOI: 10.5220/0010642200003062
In Proceedings of the 2nd International Conference on Innovative Intelligent Industrial Production and Logistics (IN4PL 2021), pages 59-66
ISBN: 978-989-758-535-7
Copyright
c
2021 by SCITEPRESS – Science and Technology Publications, Lda. All rights reserved
59

2 RELATION TO THE EXISTING
THEORIES AND WORK
In this section, we will briefly look at the process of
digital transformation, maturity models and the
digitalisation issues within small and medium sized
enterprises (SMEs).
2.1 Digital Transformation
Digital transformation (DT) is a continuous
technology-driven change process of both companies
and the society as a whole (Ebert & Duarte, 2018). It
includes the changes in roles, ways of working and
business offerings caused by adoption of digital
technologies either in the company or in the operation
environment. DT indicates changes occurring within
several areas: i) process, ii) organisation, iii) business
domain, and iv) society (Parviainen et al., 2017).
2.2 Maturity Models
Maturity has become a popular measure to evaluate
the capabilities of an entity since the Capability
Maturity Model (CMM) was proposed, and it has
been proven in practice (Paulk et al., 1993) (Wendler,
2012). In CMMs, there are five maturity levels:
Initial, Managed, Defined, Quantitatively Managed
and Optimising. Maturity models have a long history,
and many models applied to various topics can be
found in the literature. With regard to digital
transformation, there are over 20 maturity models
available (Teichert, 2019).
The VTT Technical Research Centre of Finland
Ltd (VTT) alone has developed three maturity tools
that are available for self-assessment for non-
commercial use. The tools are: DigiMaturity (Leino
et al., 2017), AI maturity (Saari et al., 2019) and
ManuMaturity (Saari et al., 2021). These tools help to
form an understanding of the concept in question and
assess current readiness and performance. Also, an
immediate result graph illustrates the present state
and identifies potential development needs.
In addition to the ManuMaturity tool, there are
several other maturity tools developed for Industry
4.0 and the manufacturing industry (Liebrecht et al.,
2021; Rauch et al., 2020) as well as applications
especially for SMEs and micro-sized enterprises
(Kuusisto et al., 2020).
2.3 Digitalisation and SMEs
Digital transformation provides new business
possibilities, but it also sets challenges for manufac-
turing companies. Aside from manufacturing skills,
these companies must also learn new capabilities.
Current manufacturing SMEs are struggling with
resource constraints and knowledge gaps that slow
down their digitalisation efforts and investments. The
main challenges and barriers to overcome are limited
understanding, insufficient resources and gaps in
bringing digitalisation into practice (Heilala et al.,
2020).
The ApuaDigiin.fi web service was developed to
help SMEs in proceeding with digitalisation. The
service presents a four-phase digital transformation
model, practical tools and methods for its
exploitation, company success stories and related
research results (Kääriäinen & Saari, 2020).
Franka et al. described the Industry 4.0
implementation patterns in manufacturing companies
and proposed four digitalisation domains: smart
manufacturing, smart products, smart working and
smart supply-chain. In addition to these domains,
there were general base technologies like the cloud,
the internet of things, big data and analytics. The
complexity level of implementation naturally grows
from cloud to analytics (Frank et al., 2019)
According to an SME inquiry commissioned by
VTT, less than 10% of respondents considered the
introduction of new digital systems and tools. The
inquiry was answered by 200 Finnish manufacturing
SME decision-makers. The inquiry was conducted
between November 2020 and December 2020. The
inquiry asked about the kinds of digitalisation
solutions companies already used and which of these
solutions were in the pipeline. Based on the
responses, digitalisation has already begun within
companies. However, the process has occurred at a
slower pace than desired. For example, of the control
tools, Enterprise Resource Planning (ERP) was used
by almost 90 percent of the respondents. However,
Manufacturing Executing System (MES)—
combining both factory automation and the
production control system—are used in only one out
of ten companies. Only two percent of respondents
considered introducing a MES system. This result
accurately describes the situation of digitalisation in
the Finnish manufacturing industry. The basic
systems are in use, but the actual digital leap has yet
to occur. A striking feature is that less than 10% of
respondents typically consider introducing new
systems and tools.
It is clear that SMEs need guidance and simple
tools to exploit before they can select their next
digitalisation step (Kääriäinen & Saari, 2020). In
addition to the existing maturity tools, we propose the
DigiMove matrix. DigiMove analysis provides both
IN4PL 2021 - 2nd International Conference on Innovative Intelligent Industrial Production and Logistics
60
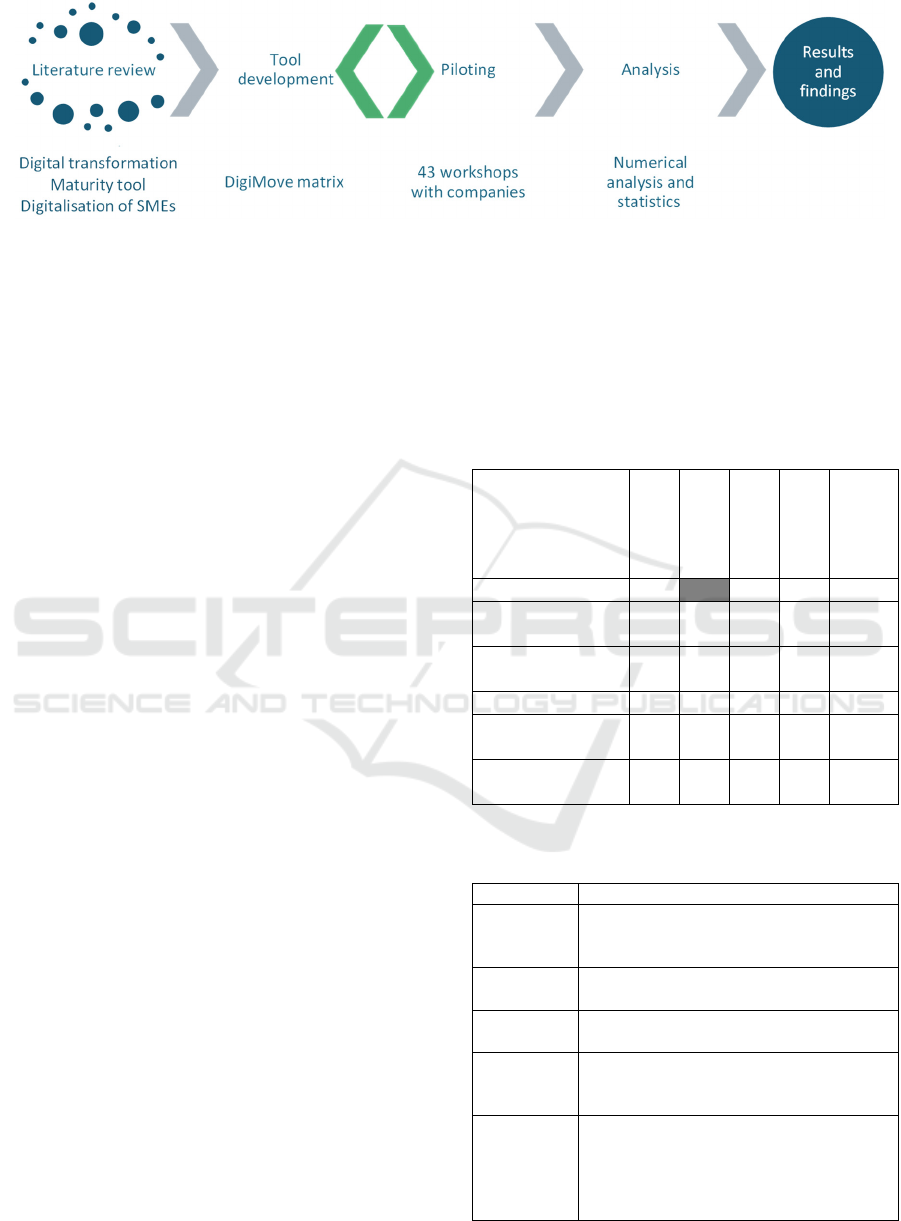
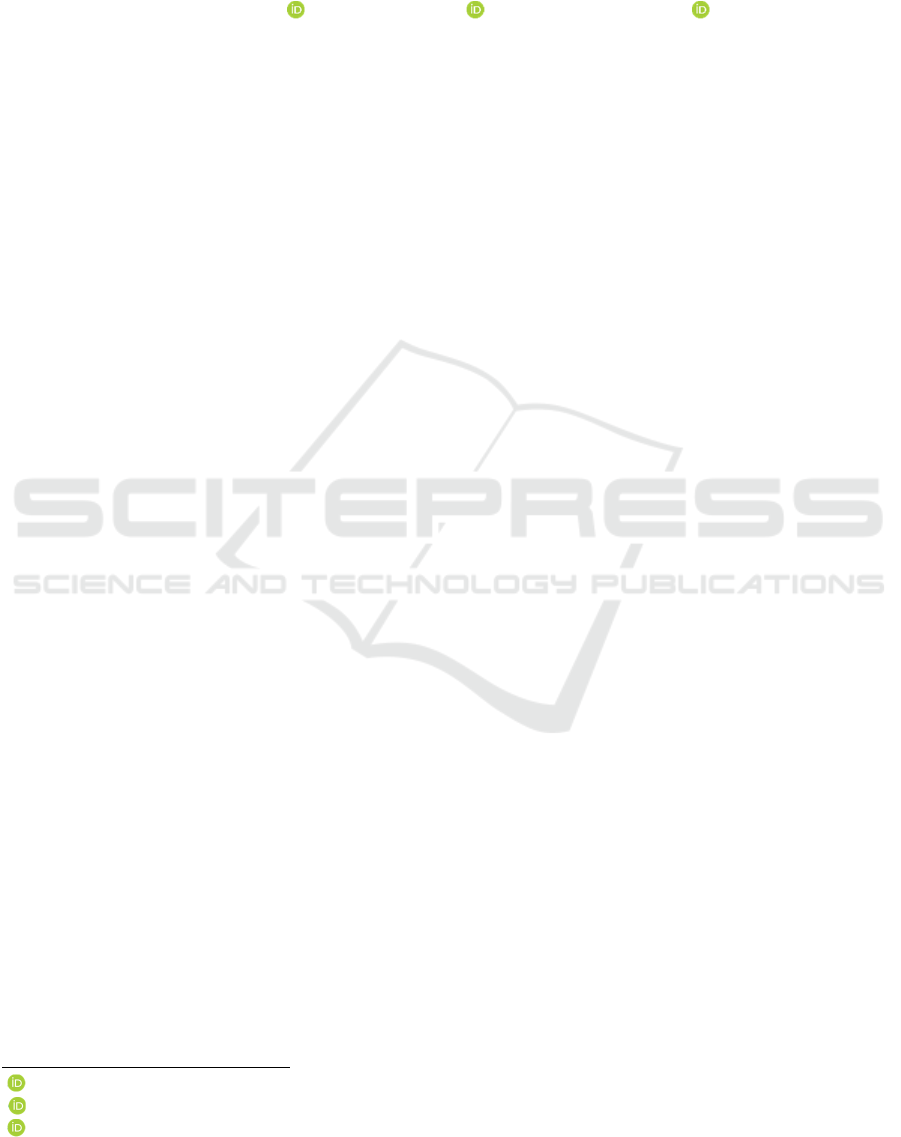
Figure 1: Research method.
the digitalisation analysis map—as maturity tools
usually do—and a customised proposal for the
company’s next steps in digitalisation.
3 RESEARCH METHOD
In this section, we describe our research method, as
shown in Figure 1. The background and a brief
literature review were previously presented in Section
2. The subtitles there were digital transformation,
maturity tools and digitalisation from the viewpoint
of SMEs. Based on the background, we proceeded
into the tool development and the result, known as the
DigiMove matrix.
After 12 company assessment experiments, we
clarified our definitions to make the matrix more self-
sustainable and user-friendly. In the piloting phase, a
total of 43 Finnish SMEs completed a workshop with
us to pilot our tool and receive both their assessment
results and a unique proposal to proceed with
digitalisation. Finally the piloting results of
companies were analysed against their financial data.
The findings are presented in Section 4.
3.1 Tool Development and the
DigiMove Matrix
The DigiMove matrix is used to identify the level of
the company's current digital solutions and possible
developments in a 1.5-hour analysis workshop. The
matrix uses a five-point scale that is completed for six
digitalisation subjects. The subjects of digitalisation
are: i) Manufacturing, ii) Products and services, iii)
Digital skills of production staff, iv) Foresight, v)
Customer interface, and vi) Administrative functions.
Furthermore, the five-point maturity scale has five
levels for digitalisation: i) General, ii) Improved, iii)
Advanced, iv) Forerunner, and v) Future opportunity
(Table 1). The maturity levels and their digitalisation
features are described in more detail in Table 2.
The analysis was based on the description of
expected digital solutions to be used and implemented
for each cell in the matrix. As an example, the
description of digitalisation in the crossing of the
‘Manufacturing’ and ‘Improved’ maturity level is
displayed in Table 3.
Table 1: The dimensions of the DigiMove matrix.
Digitalisation
level / subject
General
Improved
Advanced
Forerunner
Future
opportunity
Manufacturing
Products and
services
Digital skills of
production staff
Foresight
Customer
interface
Administrative
functions
Table 2: The maturity levels of the DigiMove matrix with
description.
Level Features of di
g
italisation
General Most of the activities are manual, CNC
controlled machines are in use, standard
office
p
ro
g
rams.
Improved Production data aggregation,
optimisation, separate ERP and MES
Advanced Robotic cells, automatic operation, ERP-
enable
d
Forerunner Real-time data utilised, remote control
over the network, interoperable ERP and
MES
Future
opportunity
Production of digital twin in partner
network. Interoperable quality
management and traceability with block
chains. Reliable data transmission in the
network
(
IDS conce
p
t
)
DigiMove Analysis for Manufacturing SMEs to Identify Their Current Status and next Digitalisation Steps
61

Table 3: An example of the descriptions in the matrix:
‘Improved’ level of ‘Manufacturing’.
Separate digital manufacturing cells with CNC
machines and industrial robots
IoT sensors
Multi cell monitoring
Cell-specific 24/7 automatic operation mode
possible
Production is controlled by ERP
3.2 Piloting with the DigiMove Matrix
Piloting with companies was conducted with a total
of 43 manufacturing companies from Finland
between November 2020 and January 2021. Piloting
in this case is defined as remote workshop sessions
with one or more company representatives at a time.
The DigiMove matrix discussion took a period of
approximately 1.5 hours. Workshops were organised
remotely via Microsoft Teams.
Typically, the company representative was the
chief executive officer (CEO), the production director
or other decision-makers. Each company had a
general number of 1–3 participants. The DigiMove
matrix discussions followed the same four-item
agenda. The session began with a warm-up and an
introduction of each person and their role. Then,
facilitators clarified the purpose and the background
of the session. Next, the facilitators led the discussion
and digitalisation assessment of the company via
DigiMove matrix row-by-row. The facilitator’s role
was to lead the discussion as well as guide and
challenge the company representatives to evaluate the
company’s actual implemented digitalisation level.
The analysis was supplemented by a numeric
evaluation (0-100) describing the actual realisation of
the cells, which is proportional to its business
importance. After the session, the mutual
understanding of the digitalisation status of the
company was displayed as an analysis map. In
addition to the immediate result (numerical
evaluation of the matrix), a verbal analysis and
proposals for the next digital development steps were
provided by facilitators within a week.
The DigiMove matrix pilot project was performed
in close co-operation with VTT’s regional agent
network. VTT has 11 regional agents around Finland;
these individuals are local experts who are very
familiar with their region’s SMEs. The selected
companies are growing and internationalising,
eligible for such funding as Business Finland’s R&D
funding, have no tax debt, and are not in debt
restructuring. The sample is small but comprehensive
and accurately represents Finnish manufacturing
SMEs. Table 4 displays the key business numbers of
the pilot companies.
Table 4: The basic numbers of the analysed companies.
Number of enterprises 43
Average turnover of the previous
financial statements
€636.2 M
Aggregate result of the previous financial
statements
€24.6 M
Percentage of profit on previous financial
statements
4.1%
Growth rate of the previous 3-4 years 4%
Avera
g
e of latest
g
rowth rate 2.7%
Sum of latest total number of staff 3860
3.3 Calculation and Statistics
This section describes how the numeric values were
created and handled during the analysis. To describe
the current situation at the digitalisation level, one of
the six objects and five levels of the analysis tool was
formed so that the objects were of equal value, but the
total score of the next level always increased by one
hundred. Thus, 100 points were given in the first
level, 200 points were given in the second level, 300
points were given in the third level and so on. The
points given to the levels in the analysis were
multiplied by these coefficients and the summed
result was divided by 500. On the aforementioned
scale, the activity at the absolute ‘General’ level gives
a figure of 20 and the activity at the absolute ‘Future
possibility’ level gives a figure of 100.
Consistency in the implementation of the analyses
was ensured and the scoring was harmonised among
20 companies in the first phase of the results. The
companies were organised in a greatest-to-least order
using their respective points. Financial data on
companies over the last 3–4 years were collected
from public sources, depending on the periods
reported by the companies. Cumulative revenue,
cumulative earnings and the cumulative earnings
margin were calculated from the financial data. The
conversion rate was combined with the level of
digitalisation, and the correlation of the numbers was
calculated.
Among the 43 companies, the data showed that
there were seven companies who had achieved
exceptional results during the last 2–3 periods. Aside
from digitalisation, there were clearly other factors
behind these numbers. These factors could come in
the form of corporate acquisition, monopoly in the
customer sector, temporary economic difficulties or
recent heavy investments in basic technologies. The
results of these companies were removed from the
IN4PL 2021 - 2nd International Conference on Innovative Intelligent Industrial Production and Logistics
62
data prior to the correlation calculation. The main
conclusions are valid with 83% of the collected data.
4 FINDINGS
Based on the DigiMove analysis of 43 Finnish
manufacturing companies, the findings are split into
two topics: the digitalisation level of the Finnish
manufacturing industry and its correlation with the
business results. Furthermore, there are some
digitalisation proposals generated during the piloting;
these proposals have been generalised for this paper.
4.1 Digitalisation Level of Finnish
Manufacturing Industry
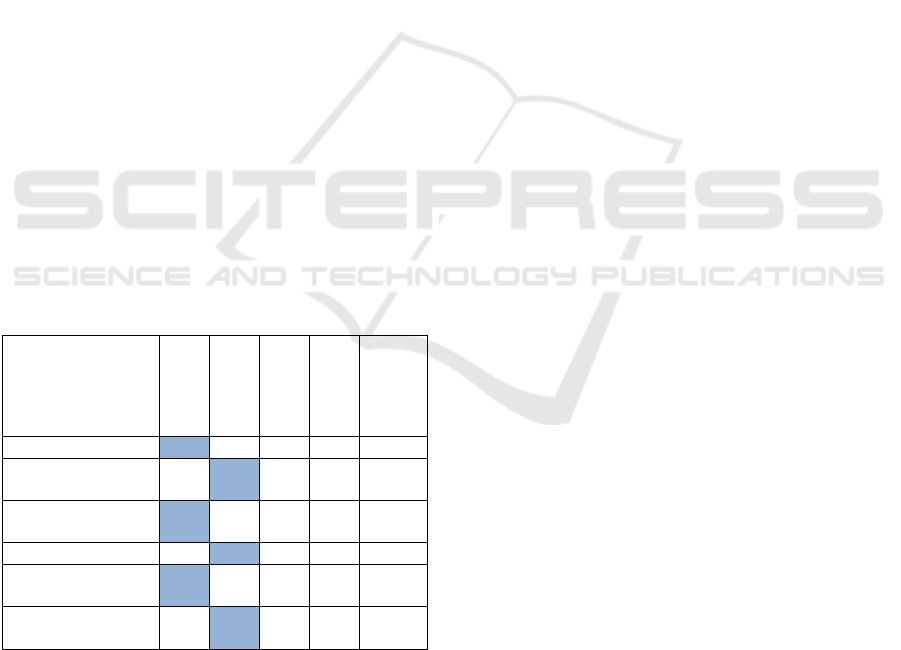
From the 43 analysed manufacturing SMEs, a
‘General’ level of digitalisation was found among
majority of the companies for the evaluation subjects
of ‘Manufacturing’ and ‘Digital skills of production
staff’ (see Table 5, where the highest share of
companies is highlighted on each row). This indicates
that most of these companies utilise manual work in
their production. This was expected with complicated
welding structures, where robotisation and
automatization are difficult to utilise, especially in
regard to small series production. It is possible,
however, to digitalise other parts of the production
process.
Table 5: Analysis summary of 43 company assessments.
Digitalisation
level / subject
General
Improved
Advanced
Forerunner
Future
opportunity
Manufacturin
g
34 31 22 12 1
Products and
services
26 41 25 7 1
Digital skills of
p
roduction staff
39 38 18 5 0
Foresight 28 36 25 9 1
Customer
interface
38 35 20 7 1
Administrative
functions
30
43 21 7 0
The ‘Customer interface’ was also evaluated to be
on the ‘General’ level. Many small companies have
only a few customers, and it is easy to communicate
with them. It is easy to forget, however, that the
changes in the market may have an extremely
dramatic effect on the future order backlog. Small
companies should never fail to look for new
customers as this maintains the resilience of the
business.
Among the analysed companies, the digitalisation
of ‘Products and services’ were developed to an
‘Improved’ level. In many cases, the SMEs did not
have their own products or a product and service
combination. Oftentimes, they were working in the
manufacturing ecosystem with bigger companies and
manufactured products. It is evident that small
companies should develop their own products to
remain as competitive in the market as possible.
Today, this translates to computer controlled features
and functions, even with relatively simple structures
and products.
Digitalisation for ‘Foresight’ translates to better
performance of supply, which is very important for
the continuity of the business. There are effective
digital means available for retrieving supply chain
information from the partners, but this information is
not shared. In the workshops, it was often mentioned
that the foresight data was not accessible to the third
and fourth tier companies of the supply chain. As a
result, other companies were following up to one-
month old predictions despite the fact that the direct,
first level suppliers could read updated foresight data
directly from the customer’s database. This broken
link in data flow weakens the productivity of the
whole network.
In the evaluations, the ‘Administrative functions’
were also in the ‘Improved’ level. In the analysing
phase of these results, it was noted that these
functions were not essential to the result of the
business.
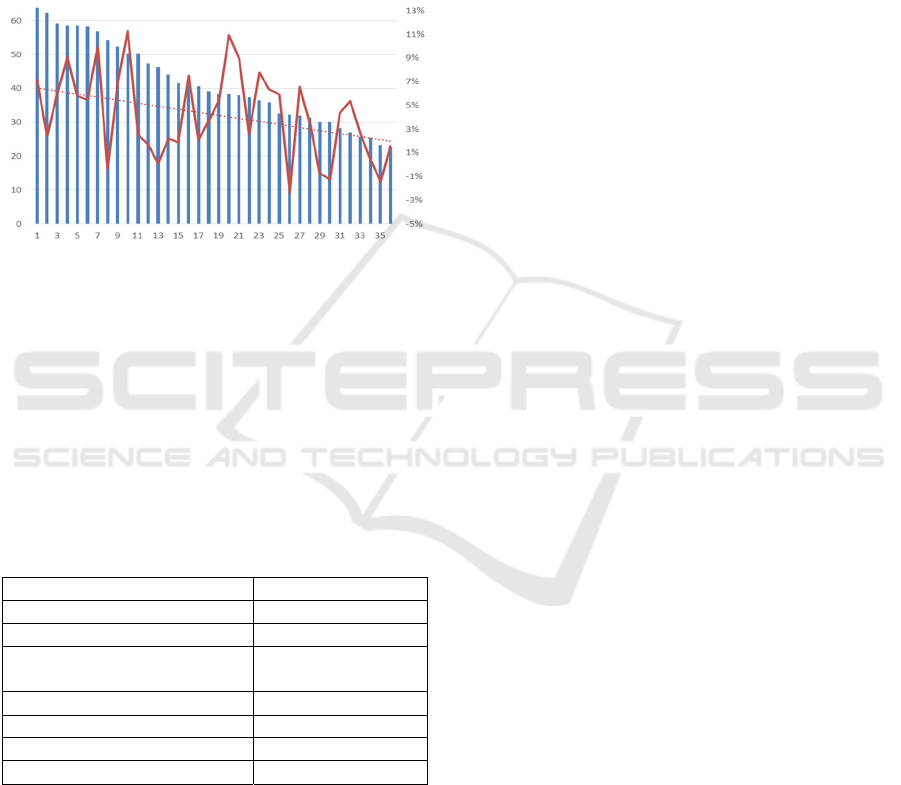
The digitalisation score of 36 assessed companies
are displayed in Figure 2. Among these 36 companies
there was none reaching the ‘Future opportunity’
level on each digitalisation subject. Two companies
reached the ‘Forerunner’ level as their average
digitalisation scored over 60. Fifteen companies
(41%) scored between 40-60, which indicates the
‘Advanced’ level. Majority, nineteen companies
scored between 20-40, indicating ‘Improved’ level of
digitalisation. This shows clearly that the
“digitalisation leap” has begun, but it remains in
infancy under the scope of manufacturing SMEs in
Finland.
4.2 Digitalisation Correlates with the
Business Result
For each of the companies, the economical result for
the previous 3–4 years—depending on the available
data—was gathered from the public sources. The
cumulative result was divided by the cumulative
DigiMove Analysis for Manufacturing SMEs to Identify Their Current Status and next Digitalisation Steps
63
turnover at the same amount of years. This average
result was compared to the scored digitalisation level
evaluated with the DigiMove matrix. This was chosen
for the reason that the latest economical result may
often include special events, investments or company
trades.
The overall digitalisation result correlates
positively with the average financial result of the
previous 3–4 years in 83% of the companies analysed
(Figure 2).
Figure 2: The overall result of the digitalisation (blue bars,
left scale) and the financial result of 36 companies (red
curve, right scale).
The highest correlation was found to be between
the financial result and the digitalisation of ‘Customer
interface’, ‘Product and services’ and ‘Digital skills
of the production staff’. Digitalisation of
‘Administrative functions’ and ‘Foresight’ was
lowest in correlation with the financial result, as
shown in Table 6.
Table 6: Correlation with the digitalisation subjects and
financial result for total 36 companies.
Correlation
Manufacturing 0.4
Products and services 0.5
Digital skills of production
staff
0.5
Foresight 0.2
Customer interface 0.5
Administrative functions 0.2
Overall 0.5
It is obvious, that digitalisation is only one factor
in competitiveness. However, it appears to be quite
significant. There were several companies in the data,
which had a relatively low level of digitalisation in
the DigiMove analysis but a high level of annual
profit in their business. The companies that achieved
the highest results in this group specialised in the
competitiveness of the product in the market or in a
narrow customer segment with almost monopoly-like
characteristics (e.g., defence industry, border guard).
The largest financial result was for a company that
specialised in a single manufacturing phase
(machining).
4.3 Digitalisation Step Proposals
In addition to the immediate analysis map, each
company also received a set of recommendations for
the next digitalisation steps. The anonymised set of
potential development actions were listed for three
digitalisation subjects: i) Manufacturing, ii) Digital
skills of the production staff, and iii) Customer
interface (Table 7).
5 CONCLUSIONS AND FURTHER
WORK
The main goal was to discover tools and processes to
help manufacturing SMEs proceed with
digitalisation. The target group is challenging due to
the key. The idea was to increase the usability of the
maturity assessment results—in addition to the status
analysis map common in maturity tools—by
providing a unique list of further digitalisation steps
to each pilot company.
The DigiMove analysis was conducted using a
matrix with six digitalisation subjects (rows) and five
maturity levels (columns). The matrix was
concretised with the description of expected digital
solutions on each cell in the matrix. A clear matrix
with facilitators made the assessment as time
effective as possible. The matrix was easy to
understand, and the work and discussions were
effective in the workshop within minutes.
The developed DigiMove analysis was piloted
with 43 manufacturing companies. The workshop
was successfully performed in a remote manner. The
evaluation session took about 1.5 hours from the
attendees. The company representatives found the use
of time useful.
The DigiMove analysis provides an analysis map
of the digitalisation level of a company, and it is
possible to compare the level with other companies.
The mean value in the scale of 20–100 was 43 with a
deviation from 23 to 64 in the evaluations (Figure 2).
This means that in the Finnish manufacturing SME
industry, the so-called digital leap is still in its
infancy.
There is a positive correlation between the
investment in digitalisation and the business results
for a large number of analysed companies.
Investments to the digitalisation of ‘Customer
IN4PL 2021 - 2nd International Conference on Innovative Intelligent Industrial Production and Logistics
64
Table 7: Potential digitalisation steps for the manufacturing SMEs.
Manufacturin
g
Di
g
ital skills of the
p
roduction staff Customer interface
Production environment
Layout development and production
cell formation
Optimisation of material flows and
manufacturing
Automation
Selection of new manufacturing
technologies utilising automation
Introduction of production automation
in manufacturing processes
Development of online monitoring of
manufacturing cells
Utilisation of IoT sensing to support
unsupervised automation
Enabling unattended automatic
operation
Robotics
Increasing robotics in machine service
and welding
Development of human-robot
interaction
Production control
Enabling co-operation between ERP
and MESs (i.e., connecting
production control directly to
machine control)
Paperless production control
Quality and traceability
Digital identification of products and
parts, quality assurance and
traceability
Marking products with bar, RFID or
QR code in production
Information work
Digitalisation of work instructions
available to everyone
Management and quality of product
information and linking of tracking
information to digitally manufactured
products
Recording changes made and hours
worked directly in the systems used
Competence
Microsoft Office365 system training
and access for everyone
Capacity building of personnel to
introduce automation or cobotics in
production
Strengthening the digitalisation skills
of employees to make better use of
the potential of manufacturing
technologies
Improving the digital capabilities of
production staff in utilising IoT
sensing
Programming of automatic machines
Teaching tracks to robots.
Remote working
Development and training of tools for
on-line monitoring of manufacturing
cells
Real-time control and monitoring of
manufacturing cells via mobile
Support schemes
Utilising the use of 3D models on a
mobile device at the installation site
Utilisation of AR welding visors or
AR glasses to aid manual work
Situation awareness
Manufacturing status table and KPIs
available to everyone
Direct contacts to customers
Online store
Product customisation online
Delivery time promise for a
customised product
Faultlessness
Order formatting with EDI to EDI
interface
Utilisation of software robotics in the
ordering process
Brand
Up-to-date websites
Website optimisation and search
engine optimisation
Visibility
Own channels on social media (e.g.,
LinkedIn, Twitter, Facebook)
News videos
Email bots
Bots
Transparency in the customer
interface
Analytics
Dynamic graphs for mobile devices
Evaluation of potential customers
interface’, ‘Products and services’ and ‘Digital skills
of production staff’ are most likely to emerge in
business results. When deploying this tool for the next
trial in the manufacturing field, modification within
‘Products and services’ must be considered. The
products and services in our target group may be
either the company’s own products, or the company
may be system supplier or subcontractor in an
ecosystem. Considering this role might have an effect
on the overall digitalisation points of the company.
As a self-assessment tool, the DigiMove analysis
is quite sensitive for skewing the company’s
situation. This can be prevented by using experienced
external experts to facilitate the assessment
workshop.
The tool was developed to help Finnish
manufacturing companies to proceed in their
digitalisation process. VTT is looking for
opportunities to continue this work in various projects
both in Finland and in Europe.
In addition to the DigiMove matrix results
described above, a weak signal was intuitively
detected during the study. The information flow is not
transparent in supply-chains. The transparency and
DigiMove Analysis for Manufacturing SMEs to Identify Their Current Status and next Digitalisation Steps
65
flow of information in a supply-chain weakens
sharply at the third and fourth subcontracting levels,
even if modern IT solutions are used at the higher
levels. This degrades the overall productivity of the
network in particular, especially in the productivity of
SMEs on the third and fourth level.
ACKNOWLEDGEMENTS
The authors of this paper wish to express our sincere
thanks to the key persons of the 43 manufacturing
SMEs who piloted our DigiMove matrix analysis.
Comments and the actual execution of the analysis
helped us to fine-tune the method. These companies
also gave valuable data for the evaluation of the
current digitalisation level in manufacturing industry
in Finland.
We wish to express many thanks to the VTT
regional agents who helped us find this group of pilot
companies around Finland and execute a large
number of analyses in a short period of time.
Thanks are also due to the Ministry of Economic
Affairs and Employment of Finland and VTT for
giving us possibility to perform this study.
REFERENCES
Ebert, C., & Duarte, C. H. C. (2018). Digital
Transformation. IEEE Software, 35(4). https://doi.org/
10.1109/MS.2018.2801537
European Comission. (2021). Horizon Europe’s first
strategic plan 2021-2014: Commission sets research
and innovation priorities for a sustainable future.
Retrieved from https://ec.europa.eu/commission/
presscorner/detail/en/IP_21_1122
Frank, A. G., Dalenogare, L. S., & Ayala, N. F. (2019).
Industry 4.0 technologies: Implementation patterns in
manufacturing companies. International Journal of
Production Economics, 210(January), 15–26.
https://doi.org/10.1016/j.ijpe.2019.01.004
Heilala, J., Helaakoski, H., Kuivanen, R., Kääriäinen, J., &
Saari, L. (2020). A review of digitalisation in the
Finnish manufacturing SME companies. (November).
Kääriäinen, J., & Saari, L. (2020). Applying the positioning
phase of the digital transformation model in practice
for SMEs : toward systematic development of
digitalization. 8(4), 24–43. https://doi.org/10.12821/
ijispm080402
Kuusisto, O., Kääriäinen, J., Hänninen, K., & Saarela, M.
(2020). Towards a Micro-Enterprise–Focused Digital
Maturity Framework. International Journal of
Innovation in the Digital Economy, 12(1), 72–85.
https://doi.org/10.4018/ijide.2021010105
Leino, Simo-Pekka; Kuusisto, Olli; Paasi, Jaakko; Tihinen,
M. (2017). Towards a new era in manufacturing: Final
report of VTT’s For Industry spearhead programme.
Liebrecht, C., Kandler, M., Lang, M., Schaumann, S.,
Stricker, N., Wuest, T., & Lanza, G. (2021). Decision
support for the implementation of Industry 4.0
methods: Toolbox, Assessment and Implementation
Sequences for Industry 4.0. Journal of Manufacturing
Systems, 58(PA), 412–430. https://doi.org/10.1016/
j.jmsy.2020.12.008
Paasi, J., Nieminen, H., Kurki, S., Apilo, T., Martins, J.,
Malinen, S., Salminen, K. (2020). Sustainable Industry
X - Kohti suomalaista teollisuusvisiota ja -agendaa
2030. https://doi.org/10.32040/2242-122X.2021.T389
Parviainen, P., Tihinen, M., Kääriäinen, J., & Teppola, S.
n(2017). Tackling the digitalization challenge: How to
benefit from digitalization in practice. International
Journal of Information Systems and Project
Management, 5(1), 63–77. https://doi.org/10.12821/
ijispm050104
Paulk, M. C., Curtis, B., Chrissis, M. B., Weber, C. V.
(1993). Capability maturity model. IEEE Software,
10(4), 18–27.
Rauch, E., Unterhofer, M., Rojas, R. A., Gualtieri, L.,
Woschank, M., & Matt, D. T. (2020). A maturity level-
based assessment tool to enhance the implementation of
industry 4.0 in small and medium-sized enterprises.
Sustainability (Switzerland), 12(9).
https://doi.org/10.3390/SU12093559
Saari, L., Kuusisto, O., & Häikiö, J. (2021). ManuMaturity
- the maturity tool for manufacturing companies to
reach beyond Industry 4 . 0.
Saari, L., Kuusisto, O., & Pirttikangas, S. (2019). AI
Maturity Web Tool Helps Organisations Proceed with
AI.
Statistics_Finland. (2008). Standard Industrial
Classification TOL 2008. Retrieved from Statistics
Finland website: https://www.stat.fi/en/luokitukset/
toimiala/
Technology Industries of Finland. (2021).
Teknologiateollisuus on Suomen suurin vientiala.
Retrieved from website: https://teknologiateollisuus.fi/
fi/teknologiateollisuus-suomen-suurin-vientiala
Teichert, R. (2019). Digital transformation maturity: A
systematic review of literature. Acta Universitatis
Agriculturae et Silviculturae Mendelianae Brunensis,
67(6), 1673–1687. https://doi.org/10.11118/actaun
201967061673
Tihinen, M., Saari, L., & Kääriäinen, J. (2020). Työkaluja
pk-yritysten digitalisaation edistämiseksi (Tools to
boost the digitalisation of SMEs). LUMEN, (3).
Wendler, R. (2012). The maturity of maturity model
research: A systematic mapping study. Information and
Software Technology, 54(12), 1317–1339.
https://doi.org/10.1016/j.infsof.2012.07.007
IN4PL 2021 - 2nd International Conference on Innovative Intelligent Industrial Production and Logistics
66
