
Criterion Validation of an Open-source Wearable Physiological Sensors
Device
Antoine Langevin
1 a
, William B
´
egin
2 b
, Martin Lavalli
`
ere
2 c
, Louis-David Beaulieu
2 d
,
Bob-Antoine J. Menelas
3 e
, S
´
ebastien Gaboury
3 f
, Kevin Bouchard
3 g
, Ghyslain Gagnon
1 h
and Linda Paquette
2,∗ i
1
Department of Electrical Engineering,
´
Ecole de Technologie Sup
´
erieure, Montreal, Canada
2
Department of Health Sciences, Universit
´
e du Qu
´
ebec, Chicoutimi, Canada
3
Department of Computer Sciences and Mathematics, Universit
´
e du Qu
´
ebec, Chicoutimi, Canada
Keywords:
Open-source, Photoplethysmogram, PPG, Electrodermal Activity, EDA, Wearable Device, Sensor.
Abstract:
Wearable sensors are very popular in monitoring sport performances and increasingly used in scientific
research. However, several scientific and ethical issues regarding pricing, raw data accessibility, validity and
commercial access to user’s data are linked with these devices. To address these limitations, an open-source
device, called Emotibit, was designed through crowdfunding. The aim of this study is to evaluate the criterion
validity of this new open-source device’s physiological components in resting position. To this end, heart
rate (HR) and heart rate variability (HRV) via photoplethysmography (PPG) and electrodermal activity (EDA)
were assessed and compared with a medical grade reference device, the FlexComp Infiniti. The Bland-Altman
plot and ratio (BAr) results indicate a good validity for HR estimation with a BAr of 0.02. However, results
suggest an insufficient validity for HRV, as well as EDA amplitude and number of activation events estimation.
These results are comparable to other studies using PPG for HRV estimation, but the EDA components need
adjustment in regard to the sensitivity of the device. We analyze the validity issues associated with open
source technology, and conclude that further improvements are required to qualify its accuracy with statistical
significance. This study also contributes to the wearable sensors studies by identifying and describing the
many challenges associated with the democratization of access to biosensing technology.
1 INTRODUCTION
Wearable sensors are becoming omnipresent,
especially in monitoring sport performances. The
global wearable sensor market was estimated at
7.44B$ USD in 2017, more than 28% above the
2015 prediction for year 2018 which was thought to
reach 5.8B$ (Casselman et al., 2017). According to
Business Wire, this market was expected to grow by
more than 32% between 2018 and 2022.
The global wearable market reaching 69B$ USD
a
https://orcid.org/0000-0002-5837-1475
b
https://orcid.org/0000-0002-9720-3597
c
https://orcid.org/0000-0003-0247-0308
d
https://orcid.org/0000-0003-4831-2380
e
https://orcid.org/0000-0001-9027-4352
f
https://orcid.org/0000-0001-7749-3470
g
https://orcid.org/0000-0002-5227-6602
h
https://orcid.org/0000-0001-9484-7218
i
https://orcid.org/0000-0003-0685-3998
∗
All correspondance regarding this article is to be
addressed to: linda paquette@uqac.ca
in 2020 (81B$ USD by the end of 2021). The growth
of remote work combined with an increased interest
in health monitoring during the COVID-19 is thought
to have brought forward this already booming market
(Rimol, 2021).
Wearable sensors have also rapidly gained
attention amongst the scientific community. For
example, a search about “wearable sensor” in
PubMed reveals that the number of published
scientific articles has increased from 38 in 2007 to
546 in 2017, an average annual growth rate of 30%.
In sports, wearables are used to assess the heart rate
(HR) and heart rate variability (HRV) associated with
exertion in a training situation (e.g. Fitbit, Polar,
Apple watch, Garmin, Hexoskin, and many others),
and wearable inertial measurement units (IMU) are
used to assess the level of physical activity and
the movement of the body during the exercise, for
example the number of steps taken in a day (e.g. Fitbit
and Polar) or the characteristics of jumps during
aerial maneuvers in board sports (e.g. PiqRossignol,
Woosport, and Trace). The majority of wearables
Langevin, A., Bégin, W., Lavallière, M., Beaulieu, L., Menelas, B., Gaboury, S., Bouchard, K., Gagnon, G. and Paquette, L.
Criterion Validation of an Open-source Wearable Physiological Sensors Device.
DOI: 10.5220/0010640300003059
In Proceedings of the 9th International Conference on Sport Sciences Research and Technology Support (icSPORTS 2021), pages 95-105
ISBN: 978-989-758-539-5; ISSN: 2184-3201
Copyright
c
2021 by SCITEPRESS – Science and Technology Publications, Lda. All rights reserved
95

combine both physiological sensors and IMU to some
extent for physical activity, HR and HRV (e.g. Fitbit
and Polar).
Unfortunately, several hurdles curtail the
usefulness of many of these devices for scientific
investigations. First, most commercially available
wearable sensors do not give access to the raw
(unfiltered) data. Secondly, there is an ethical issue
with the fact that most companies use anonymized
recorded data from wearables for commercial
purposes via their web platform, with no possibility
for scientists to avoid the use of data from participants
by companies (Allhoff and Henschke, 2018; Arias
et al., 2015; Mittelstadt, 2017). Thirdly, the reliability
and validity of the data recorded is often not available
or suitable for research purposes (Peake et al.,
2018). Fourthly, available medical grade devices
used for physiological data collection (e.g. Biopac
or FlexComp Infiniti of Thought Technology Ltd) are
often cumbersome, expensive (over 5k$) and do not
allow for field and sports research.
We propose that one of the solutions lies in the
creation and validation of an open-source wearable
multi-sensors having internal storage capabilities.
This sensor should be designed to be worn on
various body parts, thus allowing access to raw
data and global knowledge about the electronic
circuit and code of the device’s firmware and
software. As much as the open access movement
recently redefined the scientific publication process
and access (Tennant et al., 2016), we argue that
there is value in a similar process with research on
advanced technologies, which could also be open
sourced for the improvement of scientific research
and democratization of access to valid physiological
and inertial sensors data (Bernal et al., 2021).
To this end, a new partnership between Universit
´
e
du Qu
´
ebec
`
a Chicoutimi,
´
Ecole de Technologie
Sup
´
erieure and Connected Future Labs has enabled
the creation of a new open-source wearable device
that allows research-grade acquisition of movement
and physiological data: the Emotibit
1
. This device
allows data collection that is fully accessible and
private to the user.
2 WEARABLE MULTI-SENSOR
DEVICE
The Emotibit open-source device analyzed in this
work is a wearable Arduino compatible module used
to capture physiological and inertial movement data.
1
www.emotibit.com
The wearable device consists of 6 sensors related
to human physiological data: 1) 3-wavelength
photoplethysmogram (PPG) based on the
MAX30101; 2) 9-axis IMU with accelerometers
(ACC) and gyroscopes (GYR) based on BMI160 and
magnetometer based on the BMM150; 3) temperature
based on the far infrared sensor MLX90632; 4)
humidity with a second temperature sensor based
on the Si7013; and 6) electrodermal activity (EDA)
based on a custom electronic circuit. Table 1 provides
a complete list of sensors supported by the device.
All data are recorded on an SD card for further
offline analysis, but a wireless data streaming option
is also possible for live analysis and evaluation of
signals’ quality. More information can be found on
the Emotibit webpage
1
and in the GitHub repository
2
of the device.
In order to respect the writing rate of the SD
card while maintaining accurate collection of all data,
different sampling rates are used for the sensors.
Motions and changes in blood volume are recorded at
the sampling rate of 25 Hz, while physiological data
with a lower rate of change are recorded at a sampling
rate of 15 Hz for the EDA and at a sampling rate of
7.5 Hz for temperature and humidity.
The availability of all these sensors on a small
device makes it wearable in many places on the
body and allows the participant to practice numerous
activities without any discomfort or interference to
movements due to the device. Figure 1 shows images
of the Emotibit module bottom layer and top layer
with component layout.
3 METHOD
The aim of this work is the criterion validity
assessment of the wearable Emotibit device by
comparing its data with gold standard measures of
cardiovascular activity (CVA) and EDA evaluations
(Bassett Jr et al., 2012). The study uses the
standardized protocol proposed by van Lier et al.
(2019) for the analysis of signals from wearable
technologies. The analysis focus on two variable
levels: signal and parameter levels. The signal level
is a comparison made on the raw data. It assesses
the ability of the device to extract the same raw
signals as the reference device (RD). The RD used
in this study is the FlexComp Infiniti biofeedback
device by Thought Technology Ltd
3
. On the other
hand, the parameter level is important to determine
2
https://github.com/EmotiBit
3
https://thoughttechnology.com/flexcomp-system-with-
biograph-infiniti-software-t7555m/
icSPORTS 2021 - 9th International Conference on Sport Sciences Research and Technology Support
96
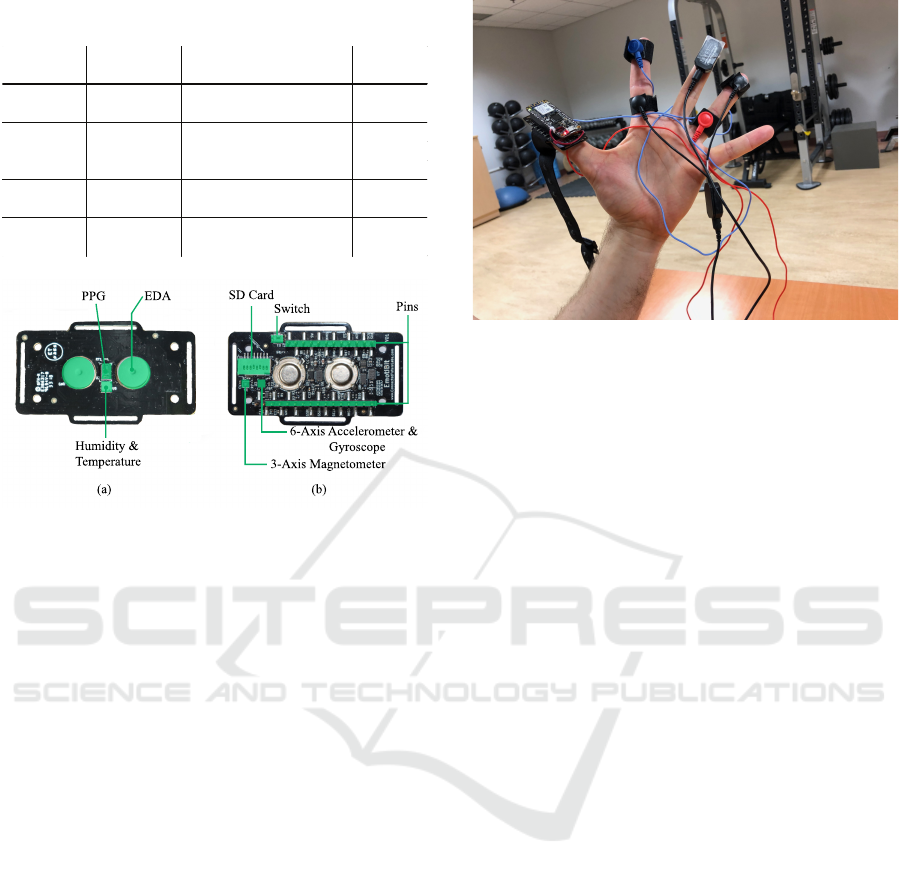
Table 1: Physiological and IMU sensors description on
Emotibit.
Function Data Type Description
Sampling
Rate
PPG PI, PG, PR Infrared, green, red lights 25 Hz
AX, AY, AZ Accelerometer (3 axis)
GX, GY, GZ Gyroscope (3 axis)
MX, MY, MZ Magnetometer (3 axis)
Temperature
& Humidity
T0, H0 Temperature, Humidity 7.5 Hz
EDA EA, EL, ER EDA, high and low variations 15 Hz
Motion 25 Hz
(a)
(b)
EDA
PPG
Humidity &
Temperature
SD Card
Switch
Pins
3-Axis Magnetometer
6-Axis Accelerometer &
Gyroscope
Figure 1: (a) Bottom layer with component layout, and (b)
top layer with component layout.
if the Emotibit device allows the calculation of
physiological parameters (e.g. HR) similar to those
of the RD.
3.1 Reference Device
The FlexComp Infiniti biofeedback is a medical grade
device. It measures EDA, HR, and HRV through two
pairs of Ag/AgCl electrodes. The sampling rate of all
measures from the RD is 256 Hz. The HR and HRV
are calculated from the electrocardiogram (ECG)
signal measured by electrodes placed on a chest strap,
while EDA is measured using two electrodes usually
attached to the fingers. The RD is connected to a
computer via a USB connection and communicates
with the Biograph Infiniti software that records the
data in a database. Once the collection is completed,
the raw data can be extracted in CSV format for
further analysis.
3.2 Participants
A total of 24 participants were selected through a
self-assessment health interview. Participants were
informed that they would participate in a validity
assessment study for the Emotibit wearable device.
A protocol approved by the local ethics committee
(602.317.04) was put in place to ensure the safety
of the subjects. Informed consent was obtained
Figure 2: A participant’s hand with the Emotibit device
on the thumb and the two pairs of EDA electrodes for the
Emotibit (red and blue) and FlexComp Infiniti (black) on
the fingers.
from all individual participants included in the study.
Of all subjects, 9 were females and 15 males, all
between the ages of 21 and 42 years old (26.5±6).
The participants were selected from the general
population, without known cardiac problems, with an
average body mass index of 23.5±3.4 kg/m
2
.
3.3 Sensors Positioning
During the whole experiment session, the Emotibit
device is worn on the thumb fingertip with the
PPG sensors facing the underside of the thumb.
Both Ag/AgCl electrodes for the Emotibit EDA are
attached to two different fingers, which is the most
responsive location to stimuli (Kasos et al., 2020).
For comparison purposes, the three ECG electrodes
of the FlexComp device are located on both collar
bones and on V5, and two additional electrodes
from the FlexComp are attached to the same two
fingers as the Emotibit electrodes to compare the EDA
measurements. Figure 2 shows a participant’s hand
with all sensors attached (ECG electrodes are not
displayed on the figure).
3.4 Test Procedure
The experiment counts in two sessions of 10 minutes
each in a laboratory environment. Both monitoring
sessions are performed in a resting situation where the
participant is asked to sit on a chair for 10 minutes
and asked to move as little as possible, with hands
resting on the table. At the beginning and end of
each session, the participant is asked to press a push
button connected to the RD three times. Pulses
from the push button aligned with those observed
on the accelerometer of the Emotibit device allow
Criterion Validation of an Open-source Wearable Physiological Sensors Device
97

the synchronization of timestamps between devices.
After these instructions, participants are asked to read
and sign an informed consent. Then, all sensors are
attached to the participant as described in Section 3.3
and data collection begins.
4 DATA ANALYSIS
Before performing both signal and parameter level
analysis, we conducted a data quality assessment of
the EDA and CVA signals collected from Emotibit
and RD.
4.1 Data Quality Assessment
During preliminary analysis of Emotibit data,
following the end of the data collection, we detected
a strong attenuation in the PPG sensor measurements
and a presence of significant noise in the sensor
measurements when the battery charge drops below a
certain threshold. As a result, several recordings had
to be ignored for the CVA and the EDA evaluation
due to the significant deterioration of the signal. A
data quality assessment protocol proposed by van Lier
et al. (2019) and summarized in this section is used to
remove invalid data.
4.1.1 EDA
Data quality assessment of the EDA signals is
conducted by visual inspection of skin conductance
(SC) data to identify measurement issues as
recommended by Boucsein (2012). Two researchers
inspected the signals for irregularities that could be
due to misplacement of the sensors or errors during
recording. From the 48 resting measurements, 14
(29%) were rejected, including four related to the
failure of the RD FlexComp. A total of 34 sessions
with EDA data were included in this study for the
signal and parameters comparison.
4.1.2 CVA
As PPG is prone to motion artifacts and optical
interference, we calculate a signal quality index (SQI)
for the PPG signal from Emotibit. Proposed by
Orphanidou et al. (2014), the goal of the SQI is to
provide an objective measure of the degree of signal
corruption.
The SQI is divided in three steps and is calculated
on individual 10-second segments. First, we detect
PPG pulse-peaks in each segment using an adaptive
peak detection (Van Gent et al., 2018) provided by the
library Heartpy (van Gent et al., 2019). The second
step is to compare the output of the PPG pulse-peaks
detector with a set of three physiological rules. If one
of the following rules is not satisfied, the segment is
classified as “bad”.
1) Rule 1: The HR extrapolated from the 10-s
segment must be between 30 and 180 beats per
minutes (bpm). This is the physiological probable
range of HR for the adult participants in this study.
2) Rule 2: The maximum acceptable gap between
successive PPG pulse-peaks is 3 seconds. This
rule ensures no more than one beat is missed.
3) Rule 3: The ratio of the maximum beat-to-
beat interval to the minimum beat-to-beat interval
within the sample should be less than 2.2. Within
a 10-second segment, the HR is not expected to
change by more than 10%, and we consider the
possibility of a single missed beat.
If all the three rules are satisfied, the final step is to
calculate the average correlation coefficient between
each PPG-pulse peak within the 10-s segment. The
approach proposed by Orphanidou et al. (2014) is as
follows:
1) For each sample, the median beat-to-beat interval
is calculated using all the detected PPG-pulse
peaks.
2) Individual PPG-pulse waves are extracted by
taking a window of width equal to the median
beat-to-beat interval centered on each PPG-pulse
peak.
3) The average PPG pulse-wave template is obtained
by taking the mean of all PPG-pulse waves of
the sample. The correlation coefficient of each
individual PPG-pulse wave with the PPG pulse-
wave template is then calculated.
4) The average correlation coefficient is finally
obtained by averaging all correlation coefficients
over the whole PPG sample.
The 10-s segment is classified as “bad”, if the
average correlation coefficient is less than 0.86
(Orphanidou et al., 2014). If more than 50% of
the segments in a 10-minute session are classified
as “bad”, the session is discarded for the rest of the
analysis.
Over the 48 sessions recorded, only six (12.5%)
were discarded. On the 42 remaining sessions, 91%
of all 10-s segments satisfied all rules and obtained an
average correlation coefficient higher than 0.86. Most
rejected segments were containing a gap larger than 3
seconds, where more than one PPG pulse peaks were
not detected by the algorithm caused by strong signal
attenuation or noisy segments.
icSPORTS 2021 - 9th International Conference on Sport Sciences Research and Technology Support
98
4.2 Signal Comparison: Cross
Correlation Function
The first comparison, at the signal level, verifies the
validity of the Emotibit by comparing the signals
measured by the wearable device with those of
the RD. This analysis is relevant for researchers
interested in using the Emotibit’s raw signal in their
work.
The signal-level analysis is done by cross
correlation between signals. The cross correlation
is a measure widely used to determine the similarity
between two time-series (Chen et al., 2015). To
eliminate problems that could be related to the
synchronization between the Emotibit and the RD
signals, we compute the cross correlation relatively
shifting the signals by ±8 sampling intervals (time
lag from -8 to +8 sampling intervals) and we keep
only the highest correlation among them.
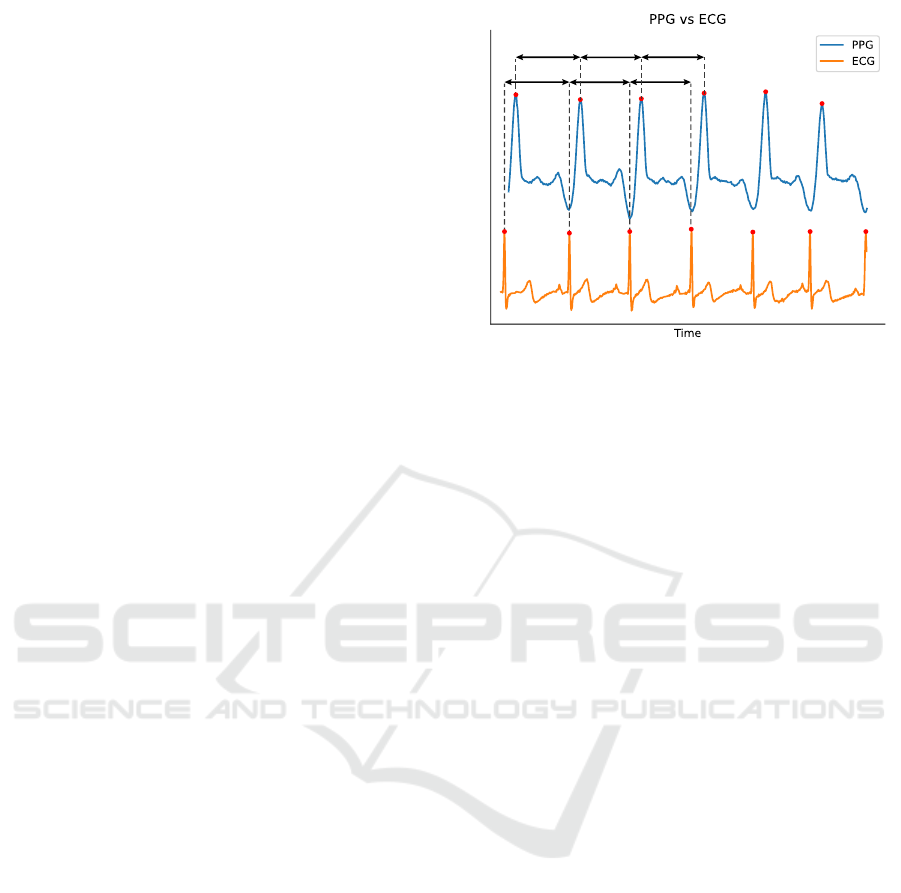
In this work, we perform the signal comparison
only for the EDA measurements. Due to the different
sensing technology of PPG vs ECG to measure HR,
the signal waveforms are significantly different as
shown in Figure 3. Therefore, no analysis was
performed to qualify the similarity between those two
signals. Instead, CVA parameters were extracted for
both signals, and then compared.
4.2.1 EDA
The following steps proposed by van Lier et al. (2019)
are used to determine the cross correlation between
the EDA signals:
1. Resample Data to the Same Frequency.
Measurements from the RD are sampling at 256
Hz, whereas EDA measures from Emotibit are
sampling at 15 Hz. We down sample the reference
EDA to 15 Hz.
2. Normalize and Detrend Data. We normalize and
detrend data to make both signals comparable and
to make the time series stationary.
3. Determine Cross Correlation at Multiple Time
Lags. We determine cross correlation between
signals with time lags from -8 to +8 samples,
meaning lags between -0.53 s to 0.53 s with a
sampling rate of 15 Hz.
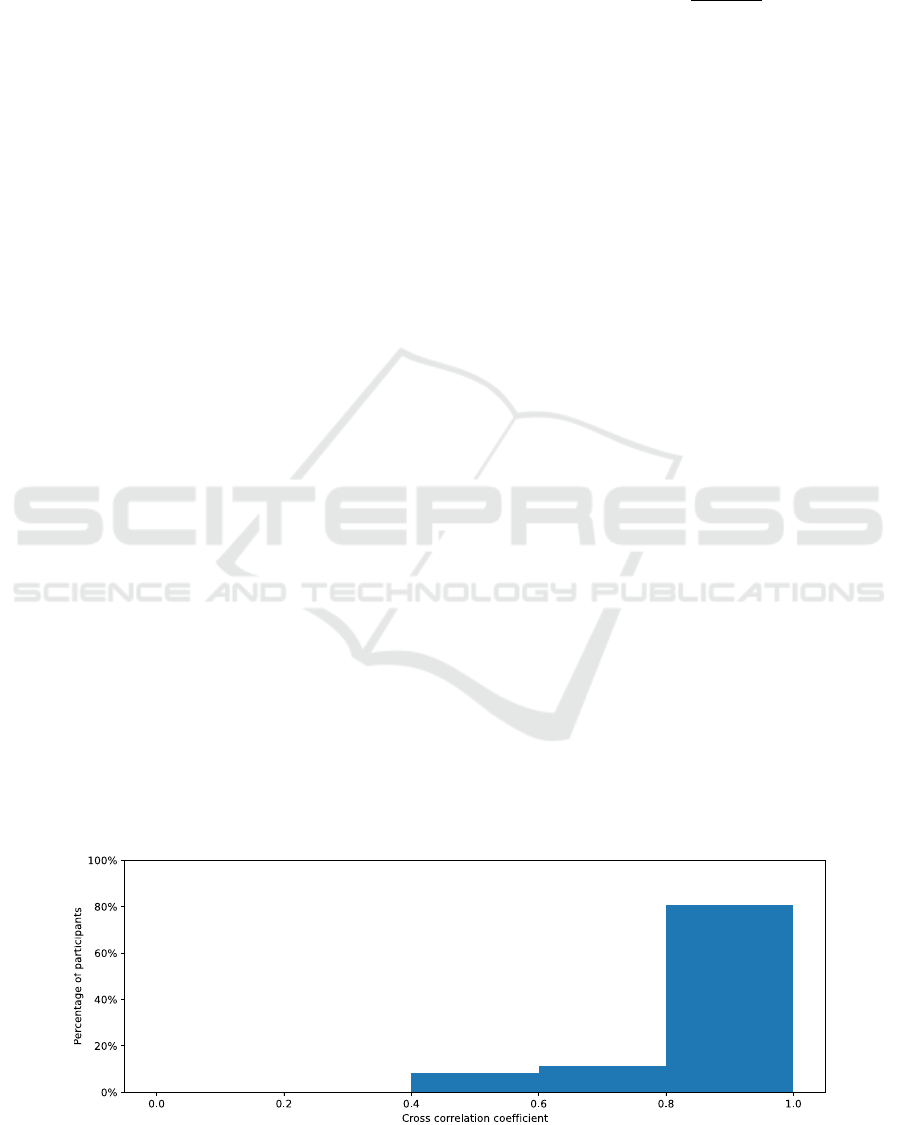
4. Find Highest Cross Correlation and Plot
Histogram. Using the highest cross correlation,
we finally plot a histogram to illustrate an
overview of signal level comparison for the EDA.
RR RR RR
PP PP PP
Figure 3: Comparison between PPG and ECG signals with
examples of PP and RR intervals.
4.3 Parameters Comparison:
Bland-Altman Plot
The Bland-Altman plot is an analysis used to
compare two measurements of the same variable.
It describes the agreement between two quantitative
measurements of a particular parameter using a visual
representation. It helps identify structural biases that
might be present in the data. In this work, we use
the Bland-Altman plot to evaluate three parameters
extracted from the EDA signals and three parameters
from the CVA signals. For each parameter, we add
boundaries (also known as limits of agreement) to
the Bland-Altman plot set to ±10% of the biological
plausible value. These boundaries are the limit of the
acceptable error (van Lier et al., 2019).
4.3.1 EDA
The Bland-Altman plots for the parameters
comparison of the EDA data are obtained by
the following steps proposed by van Lier et al.
(2019):
1. Step 1.
Same as step 1 in Section 4.2.1.
2. Analyze the Data. The EDA data are
analyzed with the Matlab-based Ledalab software
(Benedek and Kaernbach, 2010). The phasic
activity is extracted using trough-to-peak (TTP)
analysis with a threshold of 0.01 uS (Boucsein,
2012). We keep the default settings of
the software for the filtering and smoothing
preprocessing.
3. Retrieve the EDA Parameters. Three
parameters from the EDA data are evaluated
with a Bland-Altman plot:
Criterion Validation of an Open-source Wearable Physiological Sensors Device
99
Mean Skin Conductance Level (SCL). The
SCL is calculated by averaging the EDA data over
the complete 10-minute session. The biological
plausible values for SCL is between 0 and 16 µS
(Braithwaite et al., 2013). The boundaries of the
Bland-Altman plot are then ±1.6 µS.
Number of Skin Conductance Responses
(SCRs). The number of SCRs over the entire
session is determined by the TTP analysis. The
total number of SCRs is then converted to a
number of SCRs per minute. Biological plausible
values for the numbers of SCRs per minute is on
average 1-3 per minute according to Braithwaite
et al. (2013), but it can reach 20-25 SCRs per
minute during high arousal (Boucsein, 2012).
The boundaries of the Bland-Altman plot are
therefore ± 2.5 SCRs.
SCRs Total Amplitude (S-AMPL). The
amplitude of an SCR is the difference between
the SC values of its peak and the previous trough.
The amplitudes of all SCRs are summed to obtain
the total amplitude, which is then converted to
total amplitude per minute. Biological plausible
values for amplitudes are between 0 and 3
µS according to Braithwaite et al. (2013) and
with 20-25 SCRs per minute the range of total
amplitudes is between 0 and 0.3 ∗ 20 = 6µS
when using the most conservative values. The
boundaries of the Bland-Altman plot are therefore
± 0.6 µS.
4. Create a Bland-Altman Plot. Create the Bland-
Altman plot where the abscissa (x-axis) is the
mean of the two measurements and the ordinate
(y-axis) is the difference between the two values.
Additionally, plot boundaries of the acceptable
error and the 95% confidence interval of the
difference. Finally, calculate the amount of data
outside the acceptable boundaries.
5. Calculate the Bland-Altman Ratio. In addition
to the Bland-Altman plot, we calculate the Bland-
Altman ratio (BAr) (Sch
¨
afer and Vagedes, 2013)
to assess the quality of agreement for each
parameter. The BAr is given by:
BAr =
1.96 · SD
Apm
, (1)
where SD is the standard deviation of the
difference between the two values, Apm is the
average of the pairwise means and 1.96 is used
to create a 95% confidence interval around the
SD. BAr<0.01 is considered as an excellent
agreement, values between 0.01 and 0.1 are
considered as a good agreement, values between
0.1 and 0.2 as a moderate agreement, and values
>0.2 are defined as insufficient agreement.
4.3.2 CVA
The Bland-Altman plots for the parameters
comparison of the CVA data are obtained by
the following steps proposed by van Lier et al.
(2019):
1. Down and Up Sample the Data to the Same
Frequency. Downsample the reference ECG data
to 100 Hz and upsample Emotibit PPG data to 100
Hz using a linear interpolation.
2. Analyze the Filtered Data. The raw ECG data is
filtered with a notch filter to remove noise without
disturbing the QRS complexes. The raw PPG data
is filtered with a band-pass filter between 0.7 Hz
and 3.5 Hz. The filtered data is then analyzed
using the library Heartpy (van Gent et al., 2019).
The peaks of R-waves and P-waves are detected
using an adaptive peak detection (Van Gent et al.,
2018). The duration between successive peaks are
calculated to produce RR/PP intervals as shown in
Figure 3. Intervals shorter than 0.33 s and longer
than 2 s are removed since the biological plausible
range of HR is between 30 and 180 bpm, as
indicated in steps 1 and 2 of the SQI assessment.
Figure 4: Histogram of the highest cross correlation found between -8 and +8 sample time lags for each 10-minute session.
icSPORTS 2021 - 9th International Conference on Sport Sciences Research and Technology Support
100

3. Retrieve the CVA Parameters. Three
parameters from the ECG and PPG data are
evaluated with a Bland-Altman plot:
Mean RR/PP Interval. The mean RR and PP
interval is the mean of all valid intervals over the
10-minute session. The mean RR and PP interval
is then converted in instantaneous HR. According
to van Lier et al. (2019) the boundaries of the
Bland-Altman plot are ± 5 bpm.
SD RR/PP Interval. The standard deviation
(SD) over the RR and PP intervals. According
to O’Neal et al. (2016) the biological plausible
values are between 0 and 0.56. The boundaries of
the Bland-Altman are ±0.06.
RMSSD. The root mean square of the successive
RR/PP interval differences (RMSSD) reflecting
the beat-to-beat variance in HR. The RMSSD is
defined by:
RMSSD =
v
u
u
t
1
N − 1
N−1
∑
i−1
RR
i+1
− RR
i
2
!
(2)
Biological plausible values are between 0 and
0.71 s (O’Neal et al., 2016), the boundaries of the
Bland-Altman plot are ± 0.07 s.
4. Step 4. and 5. Same as step 4 and 5 for EDA in
Section 4.3.1.
The data and code used to create results in
this paper is available in our ”OS-VAL-PPG-EDA”
repository.
4
5 RESULTS
This section describes results of the signal and
parameters comparison between the Emotibit device
and the RD.
5.1 Signal Comparison: Cross
Correlation Function
5.1.1 EDA
The results of the EDA signal comparison correspond
to the maximum value of the cross correlation for
each 10-minute session between – 8 and + 8 lags in
time. Figure 4 illustrates the results by a histogram
representing the distribution of the cross correlation
obtained for each session. We note that the majority
of the sessions, i.e. 29 out of 36, obtain a cross
correlation higher than 0.8, considered as a very
4
https://github.com/AntoineLan/OS-VAL-PPG-EDA
Figure 5: SC measurements for a 10-minute session with
high cross correlation (0.99).
high correlation (Evans, 1996). The average cross
correlation over all sessions corresponds to 0.87.
Figure 5 shows the SC measurements for the
reference and the Emotibit devices with a high cross
correlation (0.99). We can clearly distinguish any
fluctuations in the measurements for both devices. We
also notice that the SCL is similar between the two
devices, which is not the case for the session with low
cross correlation shown in Figure 6. For the latter, the
signal measured by the Emotibit is about 5 µS lower
and suffers from strong attenuation making SCRs
imperceptible.
5.2 Parameters Comparison:
Bland-Altman Plot
5.2.1 EDA
The results of the parameters comparison for the EDA
data are shown in Figure 7 by three Bland-Altman
plots: (a) the mean SCL, (b) the number of SCRs
on average per minute, and (c) the total amplitude of
SCRs on average per minute.
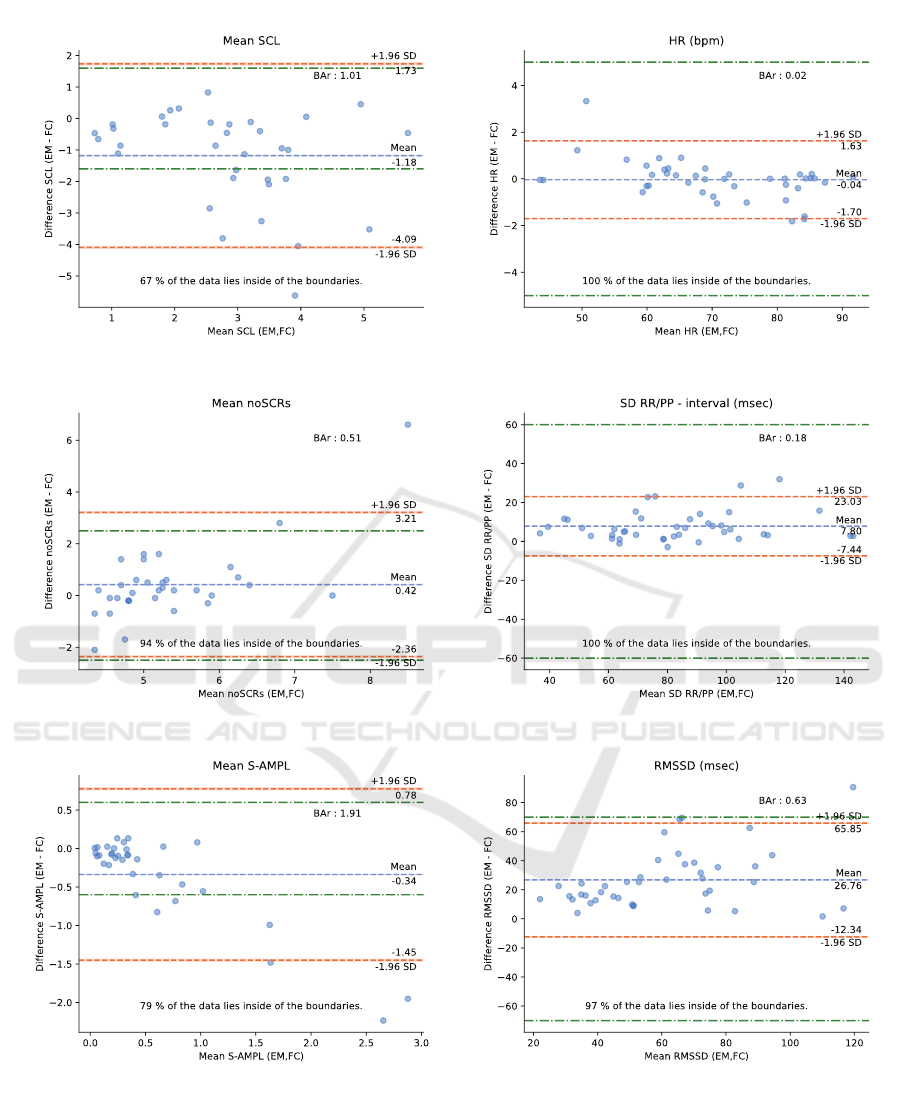
We observe, in Figure 7 (a), that the average
SCL is underestimated by the Emotibit device with
an average difference of -1.18 µS. Although the
differences in SCL increase with respect to SCL
values, no proportional bias emerges from the results.
Of the 34 sessions analyzed, we count only six
sessions that obtained an SCL higher than the
reference SCL. In addition, we note that only
67% of the sessions are within ±1.6 µS, with
11 sessions below the lower acceptable boundary.
Finally, BAr = 1.01 is significantly higher than the
moderate agreement of 0.2 and therefore considered
as insufficient agreement.
Although there is a degree of imprecision in the
SCL measured by the Emotibit device, the number of
Criterion Validation of an Open-source Wearable Physiological Sensors Device
101
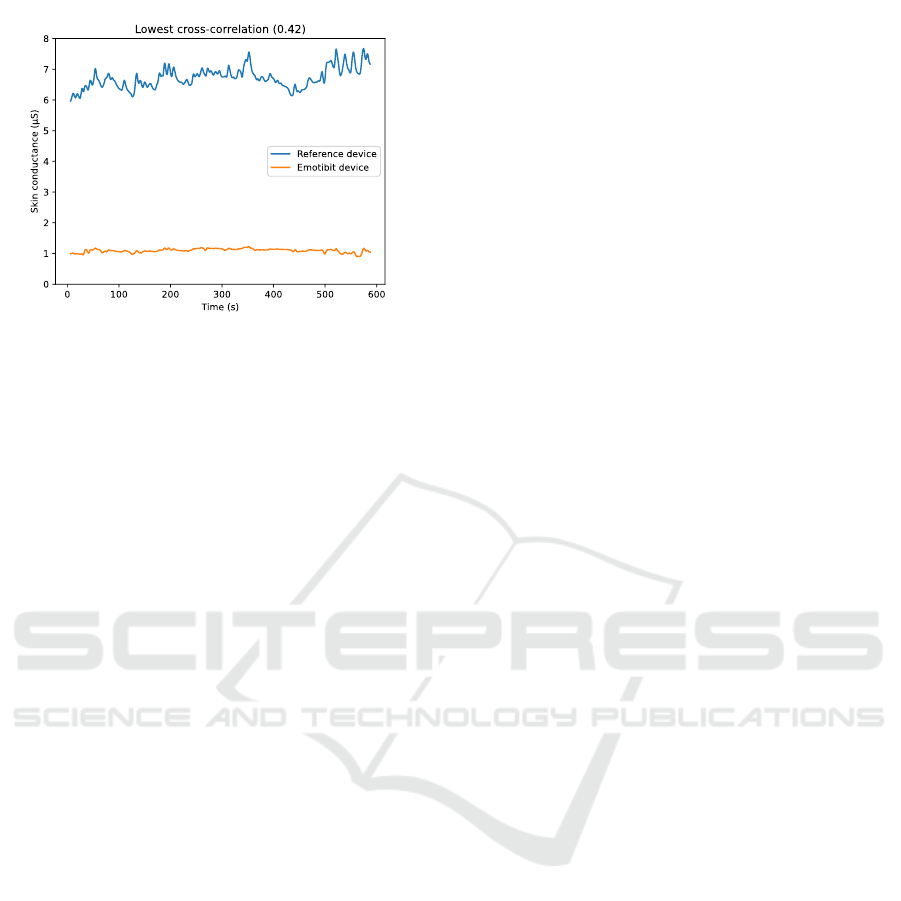
Figure 6: SC measurements for a 10-minute session with
low cross correlation (0.42).
SRCs detected is comparable to the numbers of SCRs
detected by the RD. As shown in Figure 7 (b), the
number of SCRs detected by the Emotibit is slightly
higher, with an average difference of 0.42 SCRs per
minute, or approximately 4 more SCRs detected per
10-minute session. However, the mean difference in
the number of detected SCRs between the Emotibit
and the RD stands within established boundaries for
94% of all 10-minute sessions. However, since we
are not in a high arousal situation, the difference is
high compared to the average noSCRs and yields a
BAr = 0.51 suggesting insufficient agreement for this
parameter.
Combining the evaluation of the SCL and the
detected SCRs, Figure 7 (c) shows the results of
the comparison between the Emotibit and the RD
regarding the total amplitude of SCRs per minute.
We first note that there is a large group of points
around the 0 µS error. However, about eleven 10-
minute sessions achieve an S-AMPL difference lower
than -0.34 µS. As suggested by the results in Figure
7 (a), the SCL measured by the Emotibit is lower
than the SCL measured by the RD, which also affects
the total amplitude of SCRs. Although most of
the SCRs detected by the Emotibit device have a
lower amplitude than the RD, 79% of the 10-minute
sessions lie inside the ±0.6 µS boundaries. The BAr
indicates an insufficient agreement with a value equal
to 1.91.
5.2.2 CVA
The results of the parameters comparison for the CVA
data are shown in Figure 7 by three Bland-Altman
plots: (d) the mean HR, (e) the SD over the RR and
PP intervals, and (f) the RMSSD.
In Figure 7 (d), we note that the mean HR
estimated from the Emotibit PPG signal is accurate
with an average difference of -0.02±1.7 bpm
compared to the mean HR measured from the ECG
signal. The results of all 10-minute sessions lie inside
the boundaries of +/- 5 bpm. In addition, Figure
8 shows an example of HR calculated at 2-seconds
intervals for a 10-minute session. The session is
divided into windows of 8 seconds with a stride of 2
seconds using a sliding window technique. We notice
a strong correlation between the HR calculated from
the PPG signal of the Emotibit and the HR calculated
from the ECG signal of the RD supported by the BAr
= 0.02 indicating a good agreement.
The results of the mean standard deviation of the
interbeat interval are shown in Figure 7 (e). As
observed for the mean HR, the results of the Emotibit
compared to the RD are comparable with a mean
difference of 7.8 ms and a 95% confidence interval
of ±15.23 ms. All 10-minute sessions lie inside the
acceptable boundaries of ±60 ms. The comparison
is considered as a moderate agreement with a BAr =
0.18.
The RMSSD calculated from the Emotibit PPG
data is on average 26.76 ms higher than the RMSSD
calculated from the ECG data of the RD. The
RMSSD calculated from the PPG measurements of
the Emotibit sampled at 25 Hz are more affected by
a low sampling rate than previous parameters (Fujita
and Suzuki, 2019). Although 90% of the sessions
lie inside the acceptable boundaries, the BAr = 0.63
indicates an insufficient agreement.
6 DISCUSSION
The aim of this study was the criterion validity
assessment of the wearable Emotibit device,
following the standardized protocol proposed by van
Lier et al. (2019).
The signal-level comparison for the EDA
indicates a very high correlation between the
Emotibit and the reference measurements. This
finding is in line with that of Kasos et al. (2020) who
found very high correlation when EDA electrodes
are attached to the fingers. Although the majority of
the data lies inside the acceptable boundaries set to
10% of the biological plausible range (van Lier et al.,
2019), the boundaries for the noSCRs and S-AMPL
parameters are determined to account for high arousal
situations which is not the case in this study with an
average noSCRs per minute of 5.1. Thus, the results
of the signal-level comparison are promising, but
the cross-correlation measure cannot detect a mean
bias between the two measurements. Therefore, the
SCL comparison results indicate a problem with the
amplitude of the measured SC that affects all other
icSPORTS 2021 - 9th International Conference on Sport Sciences Research and Technology Support
102
(a)
(b)
(c)
(d)
(e)
(f)
Figure 7: Bland-Altman plots for the parameters comparison of the EDA data on the left: (a) the mean SCL, (b) the number
of SCRs per minutes, and (c) the S-AMPL per minute, and for the CVA data on the right: (d) the mean HR, (e) the SD of
the RR/PP intervals, and (f) the RMSSD. Each dot represents one 10-minute session. The x-axis corresponds to the average
of the two measures, and the y-axis is the difference between the two measures. Both green lines represent the acceptable
boundaries. The orange lines are the 95% confidence interval limits found and the blue line represents the mean value. The
percentage of sessions which lie inside the acceptable boundaries is given at the bottom of each plot, whereas the BAr is given
at the top right of each plot.
Criterion Validation of an Open-source Wearable Physiological Sensors Device
103
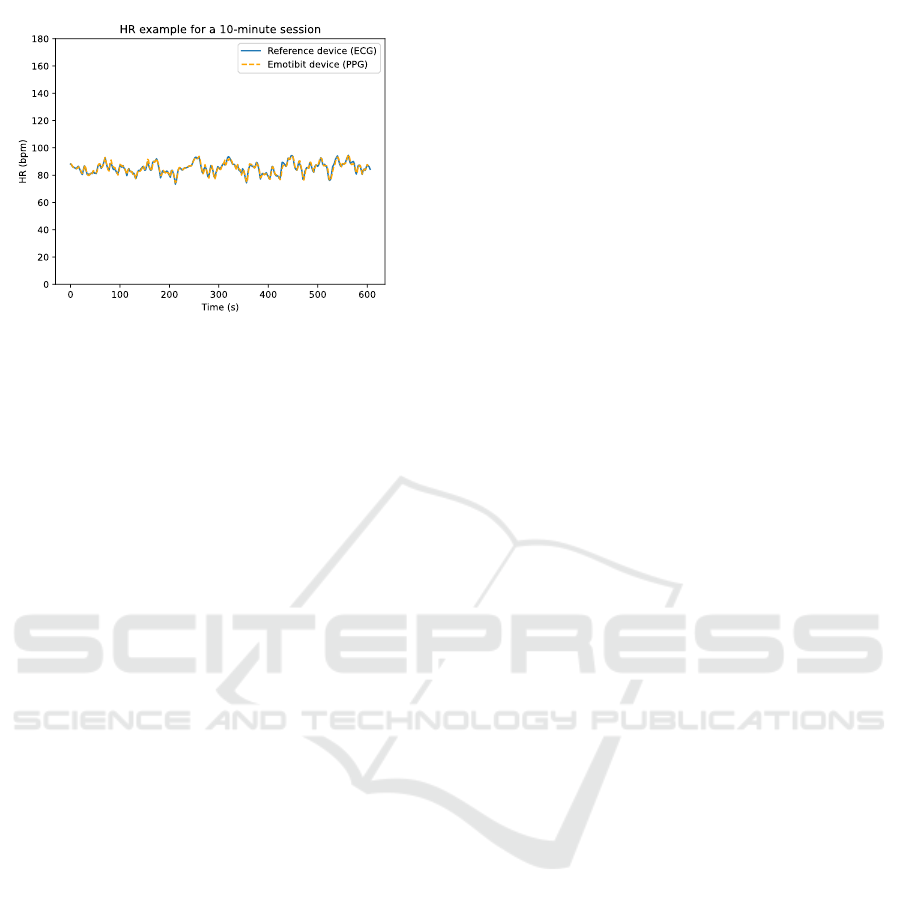
Figure 8: Example of HR measurements for a 10-minute
session. The HR is determined by using the ECG data for
the RD and by using the PPG data for the Emotibit device.
extracted parameters. In the lights of these results, we
do not recommend the Alpha version of the Emotibit
device for scientific purposes to determine accurate
SCL.
The results obtained from the parameters
comparison of the CVA data show the validity of the
Emotibit to determine the HR from the PPG signal
with a good agreement (Chen et al., 2015). However,
the PPG sampling rate of 25 Hz impacts the results
for the SD RR/PP interval and RMSSD parameters.
The SD RR/PP interval parameter is validated with
moderate agreement, whereas the RMSSD obtains
insufficient agreement to be validated. This is in
line with Sch
¨
afer and Vagedes (2013) and B
´
eres
et al. (2019) who reported that the reliability of
HRV parameters is affected by the sampling rate
and the RMSSD is the most susceptible due to its
beat-to-beat-weighted sensitivity. It should be noted
that measurements were performed in the resting
position and the Emotibit was placed on the fingertip,
which helps to detect blood volume changes. Using
the Emotibit on the wrist and during activities could
reduce the performance of the PPG sensor due to
motion artifacts.
The Emotibit is constantly evolving, and a Beta
version is soon to be released, providing several
adjustments and performance improvements to the
wearable device. However, during the monitoring
sessions of the current experiment only the Alpha
version was available and thus was the subject of this
criterion validity assessment.
7 CONCLUSION
Open source wearable device solutions are important
to democratize access to these technologies and to
ethically ensure control over our personal data and
that of research project participants. However, in
order to be accessible to the largest number of
people, open-source devices must remain affordable,
which adds constraints to the technologies used and
therefore affects their performance.
In the light of this criterion validity assessment
of the wearable Emotibit device, we conclude that
the measurement of EDA still needs to be improved,
especially to adjust sensitivity of the SCL. The
Emotibit device is accurate to estimate the HR by
using the PPG sensors. However, the results for the
HRV parameters could be improved by increasing the
PPG sampling frequency.
The versatility of the Emotibit device allows it to
be used in many conditions and environments, such
as indoor and outdoor activities. Considering these
results, the Emotibit is an interesting wearable device
for sports applications and also for physiological
feedback for art and video game applications.
However, further experiments should be done to
validate the device in other situations i.e. when
performing activities. In this regard, two new
experimental studies using this wearable device
have already been initiated in the field of sports,
more specifically for snowboarding and trampoline
practice. The set of physiological and spatio-temporal
sensors will allow us to analyze the experiments from
several angles, both at the psychosocial and technical
levels. We already expect that the movements
associated with the practice of these activities will
reduce the quality of the PPG signals (Kim and Yoo,
2006). Thus, part of the experimental study will
involve the use of IMU to determine HR in order to
reduce the influence of motion on the performance of
the wearable device (Mashhadi et al., 2015; Lee et al.,
2018).
Finally, an additional criterion validity assessment
will be conducted using the new Beta version of the
Emotibit. For this purpose, a modified version of
Bruce’s protocol (Bruce, 1971) will be used, in which
the participant will be asked to alternate between
walking and running on a treadmill to simulate
activity conditions in a controlled environment.
REFERENCES
Allhoff, F. and Henschke, A. (2018). The internet of things:
Foundational ethical issues. Internet of Things, 1:55–
66.
Arias, O., Wurm, J., Hoang, K., and Jin, Y. (2015).
Privacy and security in internet of things and
wearable devices. IEEE Transactions on Multi-Scale
Computing Systems, 1(2):99–109.
icSPORTS 2021 - 9th International Conference on Sport Sciences Research and Technology Support
104

Bassett Jr, D. R., Rowlands, A. V., and Trost, S. G. (2012).
Calibration and validation of wearable monitors.
Medicine and science in sports and exercise, 44(1
Suppl 1):S32.
Benedek, M. and Kaernbach, C. (2010). A continuous
measure of phasic electrodermal activity. Journal of
neuroscience methods, 190(1):80–91.
B
´
eres, S., Holczer, L., and Hejjel, L. (2019). On
the minimal adequate sampling frequency of the
photoplethysmogram for pulse rate monitoring and
heart rate variability analysis in mobile and wearable
technology. Measurement Science Review, 19(5):232–
240.
Bernal, G., Montgomery, S., and Maes, P. (2021). Brain-
Computer Interfaces, Open Source and Democratizing
the Future of Augmented Consciousness. Frontiers in
Computer Science, 3:23.
Boucsein, W. (2012). Electrodermal activity. Springer
Science & Business Media.
Braithwaite, J. J., Watson, D. G., Jones, R., and Rowe,
M. (2013). A guide for analysing electrodermal
activity (EDA) & skin conductance responses (SCRs)
for psychological experiments. Psychophysiology,
49(1):1017–1034.
Bruce, R. (1971). Exercise testing of patients with coronary
artery disease. Ann Clin Res, 3:323–332.
Casselman, J., Onopa, N., and Khansa, L. (2017). Wearable
healthcare: Lessons from the past and a peek into the
future. Telematics and Informatics, 34(7):1011–1023.
Chen, X., Huang, Y.-Y., Yun, F., Chen, T.-J., and Li, J.
(2015). Effect of changes in sympathovagal balance
on the accuracy of heart rate variability obtained from
photoplethysmography. Experimental and therapeutic
medicine, 10(6):2311–2318.
Evans, J. D. (1996). Straightforward statistics for
the behavioral sciences. Thomson Brooks/Cole
Publishing Co.
Fujita, D. and Suzuki, A. (2019). Evaluation of the
possible use of PPG waveform features measured at
low sampling rate. IEEE Access, 7:58361–58367.
Kasos, K., Kekecs, Z., Csirmaz, L., Zimonyi, S.,
Vikor, F., Kasos, E., Veres, A., Kotyuk, E.,
and Szekely, A. (2020). Bilateral comparison of
traditional and alternate electrodermal measurement
sites. Psychophysiology, 57(11):e13645.
Kim, B. S. and Yoo, S. K. (2006). Motion
artifact reduction in photoplethysmography using
independent component analysis. IEEE transactions
on biomedical engineering, 53(3):566–568.
Lee, H., Chung, H., and Lee, J. (2018). Motion artifact
cancellation in wearable photoplethysmography using
gyroscope. IEEE Sensors Journal, 19(3):1166–1175.
Mashhadi, M. B., Asadi, E., Eskandari, M., Kiani, S., and
Marvasti, F. (2015). Heart rate tracking using wrist-
type photoplethysmographic (PPG) signals during
physical exercise with simultaneous accelerometry.
IEEE Signal Processing Letters, 23(2):227–231.
Mittelstadt, B. (2017). Ethics of the health-related internet
of things: a narrative review. Ethics and Information
Technology, 19(3):157–175.
O’Neal, W. T., Chen, L. Y., Nazarian, S., and
Soliman, E. Z. (2016). Reference ranges for short-
term heart rate variability measures in individuals
free of cardiovascular disease: the Multi-Ethnic
Study of Atherosclerosis (MESA). Journal of
electrocardiology, 49(5):686–690.
Orphanidou, C., Bonnici, T., Charlton, P., Clifton,
D., Vallance, D., and Tarassenko, L. (2014).
Signal-quality indices for the electrocardiogram and
photoplethysmogram: Derivation and applications to
wireless monitoring. IEEE journal of biomedical and
health informatics, 19(3):832–838.
Peake, J. M., Kerr, G., and Sullivan, J. P. (2018). A critical
review of consumer wearables, mobile applications,
and equipment for providing biofeedback, monitoring
stress, and sleep in physically active populations.
Frontiers in physiology, 9:743.
Rimol, M. (2021). Gartner Forecasts Global Spending
on Wearable Devices to Total $81.5 Billion in
2021. https://www.gartner.com/en/newsroom/press-
releases/2021-01-11-gartner-forecasts-global-
spending-on- wearable-devices-to-total-81-5-billion-
in-2021.
Sch
¨
afer, A. and Vagedes, J. (2013). How accurate
is pulse rate variability as an estimate of heart
rate variability?: A review on studies comparing
photoplethysmographic technology with an
electrocardiogram. International journal of
cardiology, 166(1):15–29.
Tennant, J. P., Waldner, F., Jacques, D. C., Masuzzo, P.,
Collister, L. B., and Hartgerink, C. H. (2016). The
academic, economic and societal impacts of Open
Access: an evidence-based review. F1000Research,
5.
Van Gent, P., Farah, H., Nes, N., and van Arem, B. (2018).
Heart rate analysis for human factors: Development
and validation of an open source toolkit for noisy
naturalistic heart rate data. In Proceedings of the 6th
HUMANIST Conference, pages 173–178.
van Gent, P., Farah, H., van Nes, N., and van Arem, B.
(2019). HeartPy: A novel heart rate algorithm for
the analysis of noisy signals. Transportation research
part F: traffic psychology and behaviour, 66:368–378.
van Lier, H. G., Pieterse, M. E., Garde, A., Postel,
M. G., de Haan, H. A., Vollenbroek-Hutten, M. M.,
Schraagen, J. M., and Noordzij, M. L. (2019).
A standardized validity assessment protocol for
physiological signals from wearable technology:
Methodological underpinnings and an application to
the E4 biosensor. Behavior research methods, pages
1–23.
Criterion Validation of an Open-source Wearable Physiological Sensors Device
105
