
Enhancing User Experience of Interior Design Mobile Augmented
Reality Applications
Ayman Kandil
1
, Bader Al-Jumaah
2
and Iyad Abu Doush
2
1
Computer Engineering Department, College of Engineering and Applied Sciences, American University of Kuwait,
Salmiyah, Kuwait
2
Computing Department, College of Engineering and Applied Sciences, American University of Kuwait, Salmiyah, Kuwait
Keywords: User Interface, Augmented Reality (AR), Indoor Decoration, Mobile Augmented Reality Application.
Abstract: Intuitive user interface design is of utmost importance to mobile applications, especially when dealing with
new technologies like Augmented Reality (AR). In this paper, a user study for evaluating AR 3D furniture
arrangement mobile application user experience is presented. In our gesture design, we used one hand to ease
the use of the application. Firstly, the user interface is developed based on the literature recommendations and
users evaluate it using a set of five tasks in terms of System Usability Scale (SUS), Handheld Augmented
Reality Usability Scale (HARUS), task completion time, and the number of user errors. The obtained
evaluation results are then used to alter the user interface. The research outcome can be used to help in
developing a better user experience for a wider range of AR applications.
1 INTRODUCTION
Augmented reality (AR) is a technology that glazes
computer-generated information and place them in
the real world (Singh and Singh, 2013). As mobile
devices become more powerful and capable, they are
being increasingly used to run AR applications.
Visualizing how to place a particular piece of
furniture in a room is not easy for anyone (Motwani
et al., 2017). AR can be used to accomplish such task
to help users make designs faster and more
efficiently.
AR can help to design, educate, or present interior
design by using virtual furniture which is overlaid in
a physical environment using the mobile phone.
Users can simply start the camera from the
application, select the virtual furniture, and then place
it in the room. The furniture is integrated into the 3D
scene and it can be shown along with the real furniture
in the scene.
In this paper, we follow the AR user interface
design recommendations found in the literature
(Dabor et al., 2019; Hui, 2014; Tsai et al., 2016) to
develop a solution for mobile devices that can be used
for interior design. The developed interface is then
evaluated by 25 users using task-based evaluation.
The users' feedback is then used to alter the user
interface and another user evaluation for the updated
interface is conducted. As a result, a new set of
recommendations for designing the user interface for
AR interior design are proposed.
2 RELATED WORK
In this section some of the related literature on
recommendations of developing user interface (UI)
AR is discussed.
2.1 User Interface for AR Applications
Several researchers tackled the problem of
identifying how to develop a usable AR UI. Dabor et
al. (2019) proposed an AR user interface design
framework to reduce user’s mental workload for tasks
that requires multitasking activities. In order to do
that they used the Cognitive Load Theory which helps
in developing interfaces that allow users to maximize
their working memory when solving problems. The
following set of design guidelines are recommended:
the application should be easy for both novice and
expert users, users are in control of the next action
instead of the system being responsible, users can
modify/personalize the visual information displayed
in the application depending on the preference of the
user, the application should be intuitive and the steps
Kandil, A., Al-Jumaah, B. and Doush, I.
Enhancing User Experience of Interior Design Mobile Augmented Reality Applications.
DOI: 10.5220/0010630400003060
In Proceedings of the 5th International Conference on Computer-Human Interaction Research and Applications (CHIRA 2021), pages 101-108
ISBN: 978-989-758-538-8; ISSN: 2184-3244
Copyright
c
2021 by SCITEPRESS – Science and Technology Publications, Lda. All rights reserved
101

of the task should require very little memorization,
and textual information should be in an
understandable format and easy to read.
Singh and Singh (2013) presented the main
features in an AR application and its challenges. First,
an AR application needs suitable sensors to read the
environment properly to recognize the scene. Second,
after recognizing the scene, the AR application needs
to use trigger matching and image augmentations to
understand the scene discovered to place/display the
augmented information. Third, AR application needs
to provide technologies to allow interaction between
user and trigger matching. Fourth, an AR application
should provide an information infrastructure such as
cloud services to help user’s longer-term context.
Lastly, AR requires a considerable computing and
communication infrastructure to allow all previous
technologies to work as expected. Several challenges
can face users of an AR application such as
information overloading.
2.2 AR for Interior Design
Developing solutions for an interior design using AR
can help ease the process of placing different pieces
of furniture virtually into the physical room. Tong et
al. (2019) proposed a real-time AR application called
AR Furniture which allows users to see the furniture
in different colors and different styles. The solution
utilizes deep-learning-based semantic segmentation
and a fast-speed color transformation. The system
uses eye-gaze to read the environment and provides
virtual reality (VR) content.
Hui (2015) proposes the AR3D model which
creates a 3D model that is based on the original
interior construction plan is presented. The AR3D
model contains different sources of information to
provide a generated environment with real and virtual
objects. It allows users to interact with and get real-
time feedback from the changes made as well as
showing the relationship between the virtual and real
objects and how both can get influenced by each other
in the same space. The main advantage of the created
AR3D model is to help in reducing design errors that
happen due to inappropriate spatial partition,
management, and construction problems. Moreover,
AR3D models can help customers in understanding
the interior design project and thus save costs and
time for the designer when the physical construction
is done. Finally, the AR3D model allows the designer
to practice every possible design concept available
from the user and get feedback in real-time.
Tsai et al. (2016) present an approach that uses
AR to model 3D objects of various home products
and appliances. The application supports portrait
view only and the UI was designed to accommodate
two-handed use. As a result, the program's main
buttons were placed on the lower edges making one-
handed use impractical.
Seow (2018) developed a 3D furniture AR
application. The solution allows users to rotate the 3D
furniture by pressing a button once to activate clock-
wise rotation and when pressed again will rotate the
object counterclockwise. Due to furniture
arrangement being cumbersome Motwani et al.
(2017) propose to solve this issue by using AR on
mobile devices. The AR use “Image Targets” that
serve as reference points to the 3D objects being
rendered in real-time.
3 METHODOLOGY
Our goal is to enhance user interaction when using
AR interior design applications. We developed an AR
solution called Furniture Augmented Reality App
(FAR App). FAR App is developed using Android
Studio, where Kotlin and Java are the main
programming languages. Google’s ARCore is used to
implement the AR component of the application. In
addition, Google’s Sceneform was used to render the
3D furniture to be used in the real-world scene.
3.1 UI Design Choices
Our application uses the smartphone’s touch screen
as the main source of input for the user. As a result,
for the application to be easy to use, we were very
careful in the placement of buttons on the screen to
ensure that they can be easily reached by the fingers
even in one-handed use. We also made sure that the
main camera screen was not cluttered as to not
obstruct the camera view while also not
overwhelming the user with options.
The hand gesture interface to interact with the 3D
furniture is selected based on its familiarity to users
when they interact with other applications in the
phone. The following are the selected gestures: pinch
to zoom, tilt to rotate, and tab to place an object. In
addition, a brief tutorial is available for users to help
them get familiar with the app's different gestures.
Some other features were suggested to us by the
users during the first phase of testing, such as the
“undo last item” button among others to be detailed
in a later section.
CHIRA 2021 - 5th International Conference on Computer-Human Interaction Research and Applications
102
3.2 Participants
The total number of participants who evaluated the
proposed solution is 25. Six of them are studying
interior design. The users are young adult Android
users in Kuwait whose education is between high
school and university and who are fluent in English.
The users are 20 males and 5 females. In addition, 21
of the participants are studying bachelor's degree and
4 are in high school. Furthermore, 17 of the
participants are of ages between 18-24, while 19 of
the participants speak Arabic as their native language.
Lastly, 17 participants spend less than 4 hours a day
on their phones.
3.3 Evaluation Procedure
3.3.1 Tasks
The first step in evaluating our application is to set
certain tasks that will be unified for all users to follow.
The following are the five tasks used to evaluate the
proposed solution: choosing and placing specific
virtual furniture, search for a 3D object, resize the
selected object, rotate an object, reposition an object,
and clear the scene (i.e., removing all objects).
The evaluation was conducted to gauge the
efficiency of individual task completions and get
feedback from users to improve the proposed solution
usability.
3.3.2 Evaluation Process
The first step in the evaluation process is giving
participants 10-15 minutes before the evaluation
starts to familiarize themselves with the application.
The solution starts with a tutorial that shows
participants how to use the application’s various
features. Afterward, the participants are asked to
perform the five tasks while we record the time it took
to complete each task. After that, the participants are
asked to fill System Usability Scale (SUS) (Brooke,
1995) questionnaire, Handheld Augmented Reality
Usability Scale (HARUS) (Santos et al., 2014)
questionnaire, and open-ended questions to measure
the usability of er experience and user interface.
The SUS is used to measure the solution usability,
HARUS is used to test the user interface of the
augmented reality aspects from the user’s usage, and
the open-ended questions are used to get
recommendations from users.
Due to the current circumstances related to the
COVID-19 half of our participants were tested
remotely. Participants were asked to download the
application along with a screen recording software
before starting the evaluation. After downloading the
applications, the participants perform each one of the
tasks while recording their screens. Upon that, the
recordings are sent to us to see the user's interaction
and how much time it took to complete each task.
4 RESULTS
In addition to the SUS and HARUS scales for usability,
we used the time-on-task as a metric to measure the
efficiency of completing each task successfully.
Successful task completion means users completed the
task by performing it accurately (e.g., choosing the
correct object to place), and in a reasonable time. In
this section, the results are discussed, and the
conclusion of the evaluation is presented.
4.1 First Version of the FAR
Application
4.1.1 SUS Result
The SUS questionnaire is used to evaluate the overall
application usability. The following table shows the
10 SUS questions used for the evaluation:
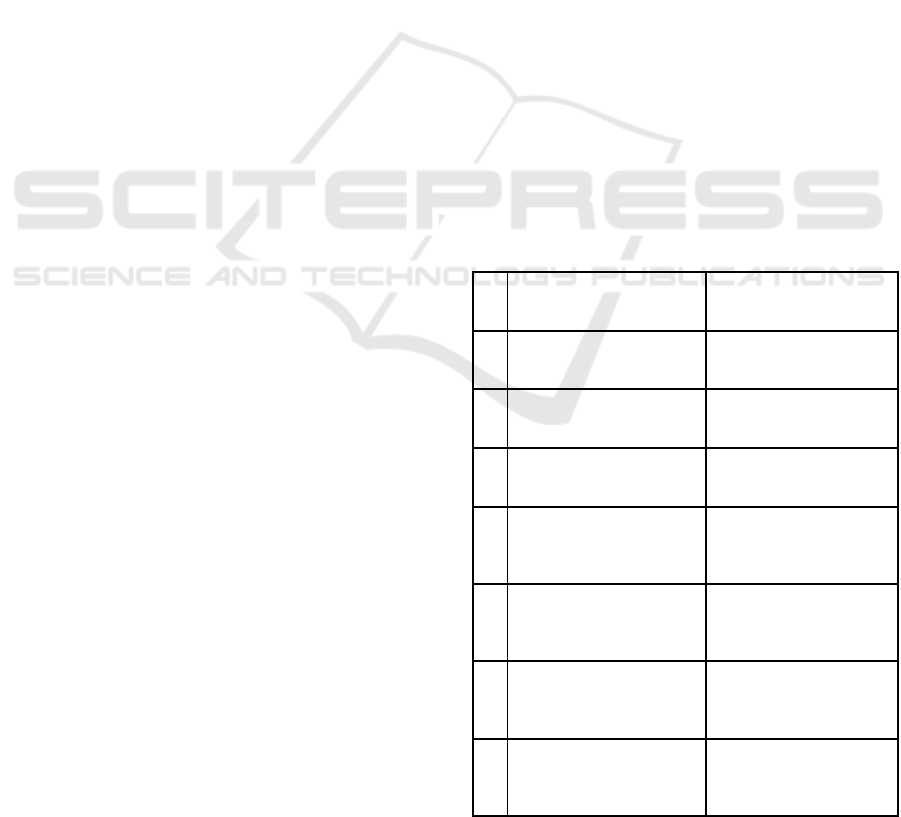
Table 1: SUS Questionnaire.
SUS Questions Relevance to Application
Usabilit
y
Q1
I think that I would like to use
this application frequently.
Measures the application
usage.
Q2
I found this application
unnecessarily complex.
Tests the complexity of the
application.
Q3
I thought this application
was easy to use.
Measures the user interface
of the application.
Q4
I think that I would need
assistance to be able to use
this application.
Measures the learnability
of the application.
Q5
I found the various
functions in this application
were well integrated.
Tests various functions of
the application.
Q6
I thought there was too
much inconsistency in this
application.
Test the consistency of the
application.
Q7
I would imagine that most
people would learn to use
this application very quickly.
Measures the learnability
of the application.
Enhancing User Experience of Interior Design Mobile Augmented Reality Applications
103

Table 1: SUS Questionnaire (cont.).
SUS Questions Relevance to Application
Usabilit
y
Q8
I found this application very
cumbersome/awkward to
use.
Measures the user
friendliness of the
application.
Q9
I felt very confident using
this application.
Measures the simplicity of
the user interface.
Q10
I needed to learn a lot of
things before I could get
going with this application.
Measures the learnability
of the application.
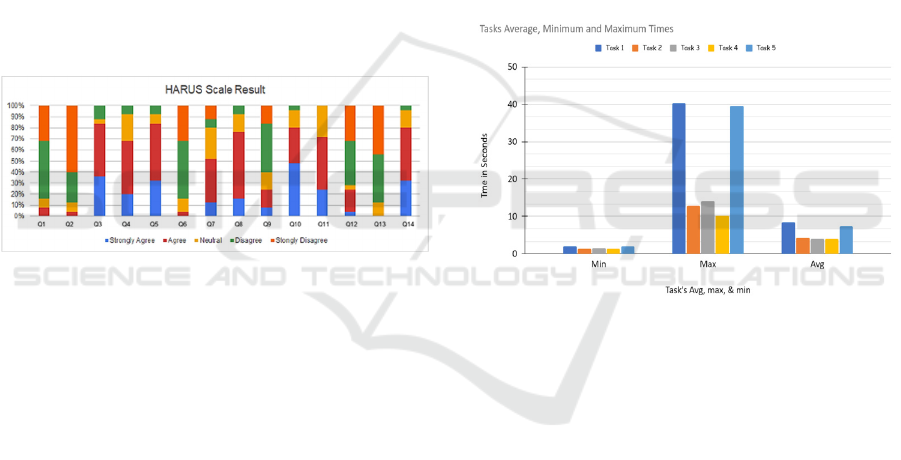
Each question of the SUS has a possible score using
a five-level scale. The results are demonstrated in
Figure 1. According to the results, only 40% of
participants said they will use the application
frequently. However, 20% thought that they will not
use it more frequently and 40% are neutral.
Moreover, 72% of the participants thought that the
application was not unnecessarily complex. In terms
of learnability, 80% of participants thought that they
do not need assistance before using the app. In
addition to that, 92% of participants thought that most
people would learn to use this application very
quickly and 84 % did not see that they had to learn a
lot of things before using the app. This illustrates that
the UI created in the first version of the app was a
success in terms of learnability with the majority of
the participants agreeing that it is easy to learn how to
use the application quickly with no complications.
Moving on to another important aspect of the
application which is the various functions that the
application proposes. Below is a chart that
summarizes the SUS questionnaire.
Figure 1: SUS Result.
4.1.2 HARUS Result
The second part of our evaluation was using the
HARUS questionnaire which is used to evaluate the
usability of a Handheld Augmented Reality
application. The following table shows the questions
asked for the evaluation:
Table 2: HARUS Questionnaire.
HARUS Questions Relevance to HAR
usabilit
y
Q1
I thought that the
information displayed on
screen was confusing.
Testing the novel
visualization metaphors that
is introduced from AR.
Q2
I think that interacting with
this application requires a
lot of body-muscle effort.
Testing the application
while moving around the
real environment.
Q3
I felt that using the
application was comfortable
for my arms and hands.
Measures the strains on the
hands and arms when using
the application.
Q4
I found it easy to input
information through the
application.
Testing the novel interaction
metaphors that is introduced
b
y AR.
Q5
I think the application is
easy to control.
Testing the novel interaction
metaphors that is introduced
b
y AR.
Q6
I think that interacting with
this application requires a
lot of mental effort.
Measures the amount of
information presented on
the small screen.
Q7
I thought the amount of
information displayed on
screen was appropriate.
Testing the novel
visualization metaphors that
is introduced from AR.
Q8
I felt that the information
display was responding fast
enough.
Measures the latency issues
that are resulted from the
limited processing power
and network connection.
Q9
I felt that the display was
flickering too much.
Measures the tracking and
registration errors that are
resulted from factors such as
dynamics and lighting.
Q10
I thought the words and
symbols on screen were
easy to read.
Measures the legibility
issues that are resulted from
ambient light, glare etc.
Q11
I thought that the
information displayed on
screen was consistent.
Measures the tracking and
registration errors that are
resulted from factors such as
dynamics and lighting.
Q12
I found the device difficult
to hold while using the
application.
Measures the grip and pose
issues that might result from
using the application.
Q13
I felt that I was losing grip
and dropping the device at
some point.
Measures the grip and pose
issues that might result from
using the application.
Q14
I think the operation of this
application is simple and
uncomplicated.
Testing the novel interaction
metaphors that is introduced
by AR.
CHIRA 2021 - 5th International Conference on Computer-Human Interaction Research and Applications
104
Each question of the HARUS scale was scored using
a 5 scale. The results are presented in Figure 2. It
shows that 84% of the participants thought that the
information displayed on the screen was not
confusing. These results show that our application
succeeded in allowing the users to understand the
novel visualization metaphors that were introduced
from the AR concept. Most MAR applications are
used while moving in the real world thus some of
them can be very hard to use if they consume a lot of
body-muscle effort. Our application showed that 88%
of users thought that the application did not need a lot
of body-muscle effort while using it. Furthermore,
our application showed great results when it came to
having minimal strains on the hands of the users when
using the application as 84% of the participants
thought that their hands were comfortable while using
the application. Additionally, our application gave the
users a comfortable experience. When using the
application 72% thought that they did not find the
device difficult to hold while using the application.
Figure 2: HARUS Result.
Also, 84% of users thought that the application was
easy to use. This shows that our application
introduced simple and easy novel interaction
metaphors that made the users understand how to use
the application with all its features without being
confusing. MAR applications are susceptible to show
too much information on the small screens that most
mobile phones have. This can lead the users to require
a lot of mental effort to know how to use the
application. The evaluation shows that 84 % of users
did not think that interacting with our application
required a lot of mental effort. We minimize the
mental effort by developing a simple and intuitive UI
that did not include a lot of buttons on the main AR
interface activity. Small screens are not the only
limitation for mobile phones, however, limited
processing power and network connection can also
limit the mobile phones' AR capabilities, 76% of
participants thought that the information displayed
was responding fast enough.
4.1.3 Time-on Task Result
The final part of our evaluation was calculating the
time-on-task to measure the efficiency of completing
each task successfully. The application was
developed during the COVID-19 pandemic some
participants are evaluated online, while others got
tested in person. Participants that were tested online
sent us the screen recordings to calculate the time it
took them to perform each task successfully.
The minimum, maximum, and average times-on
task for all users for each task is presented in Figure
3. The results show that the task with the highest
average was the first task and the task with the
second-highest was Task 5. This demonstrates that
most users took a lot of time in finding the side menu
that had the virtual furniture to place it in the scene
and also took a lot of time to find the clear button that
was also placed in the side menu.
Figure 3: Version 1 Min, Max and Avg task times.
4.1.4 User Recommendations
After testing, the participants sent multiple
suggestions on how to improve the user experience
from their user experience after using the app. Many
participants wanted more options and buttons on the
main UI screen. One of the participants suggested
adding an undo button, while another suggested
having a clickable button for the side menu, instead
of dragging from the side.
The following are the suggested features
list: dedicated button for the side menu / floating
menu, undo button, move the “clear scene” button
outside the side menu, tweak the tutorial, and tweak
calibration instructions.
The last question on the survey asked participants
if they encountered any problems with the
application. Some participants reported that the
tutorial when they start the app is too lengthy. Some
of the participants experienced minor lagging and
hiccups in the overall performance of the app. Others
Enhancing User Experience of Interior Design Mobile Augmented Reality Applications
105
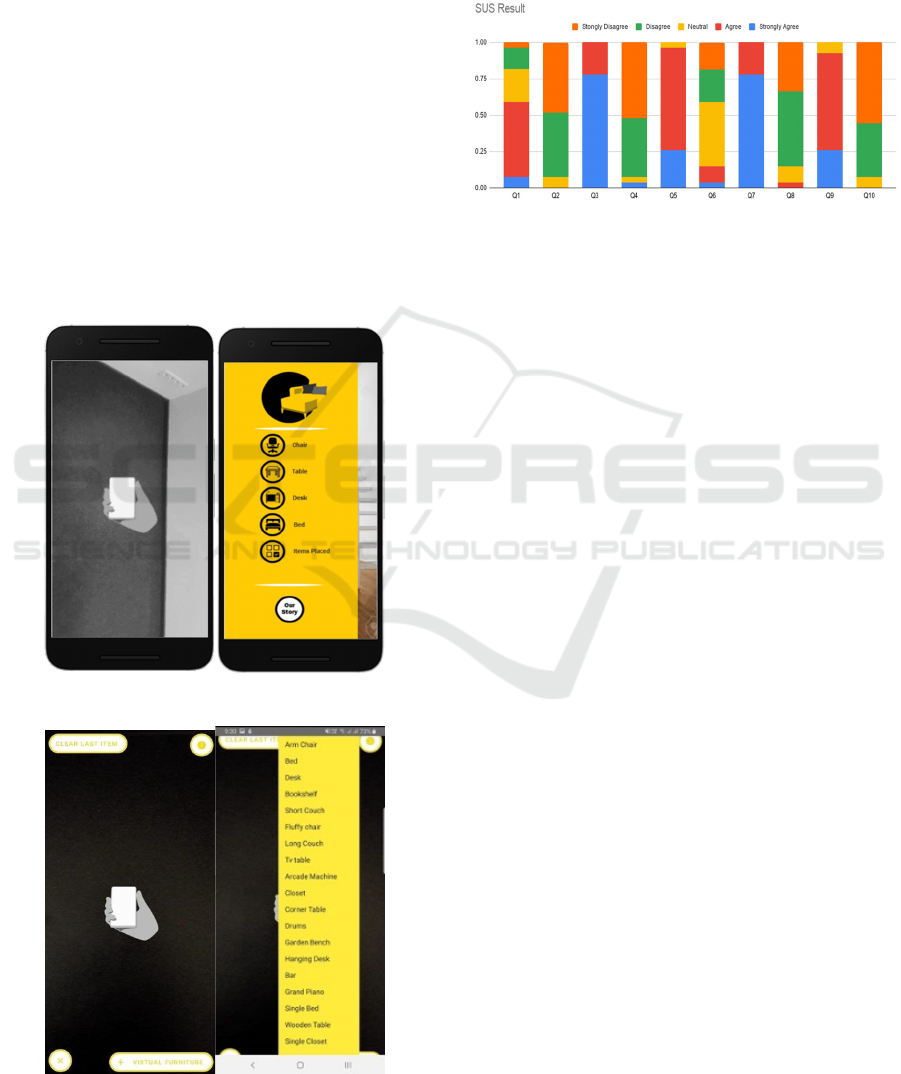
reported that they did not know there was a menu at
the side due to the lack of visual indicator (see Figure
4). One participant reported that the initial calibration
was inaccurate on white floors due to the calibration
dots being white as well.
4.2 Second Version of FAR App
After analyzing the feedback given by the participants
in the first testing round, the side menu is removed
and replaced by a pop-up menu button on the main
screen. The second thing that got modified was the
length of the tutorial to be short and precise. In
addition, a visual indicator is added for the menu as
demonstrated in Figures 6.
The participants that were already tested in the
first version evaluated the application after one
month. In addition, they were not given any time to
familiarize themselves with the application and the
tasks are reordered to ensure unbiased results.
Figure 4: First Version of The Application.
Figure 5: Second Version of The Application.
4.2.1 SUS Result
Using the same SUS questions as the first version of
the application (Table 1) and following the same
procedure mentioned before we gathered the
responses presented in Figure 6.
Figure 6: Version 2 SUS Result.
In comparison to the first version, in terms of
frequency of use, 59% of participants felt that they
would use FAR App more often after the UI changes
that were made. Another improvement is the reduced
complexity of the application with 92% of
participants stating that it is not unnecessarily
complex to use. Furthermore, 100% of participants
find the application easy to use this time. Also, 92%
of users did not need assistance to use the application
properly, compared to 68% in the first version. Lastly,
95% do not find the application
awkward/cumbersome to use, while 92% felt
confident in using the application, both up from 72%
and 76% respectively.
4.2.2 HARUS Result
Following the same process, we compare the HARUS
survey questions results with the first version. The
results are demonstrated in Figure 7. The second
evaluation shows that 92% of participants thought the
amount of information on the screen as appropriate.
No participants thought that the information on the
screen was confusing, which was 8% in the first
version. Whereas, 92% of participants thought that it
was not difficult to hold the device while using the
application, and 96% thought they had a solid grip on
the phone while engaging with the application.
Furthermore, 93% of participants thought that the
application was easy to control and 89% found that it
was simple to use, up from 84% and 80%
respectively. Finally, 88% of participants thought that
interacting with the application required little mental
effort, up from 84% in the last version.
CHIRA 2021 - 5th International Conference on Computer-Human Interaction Research and Applications
106
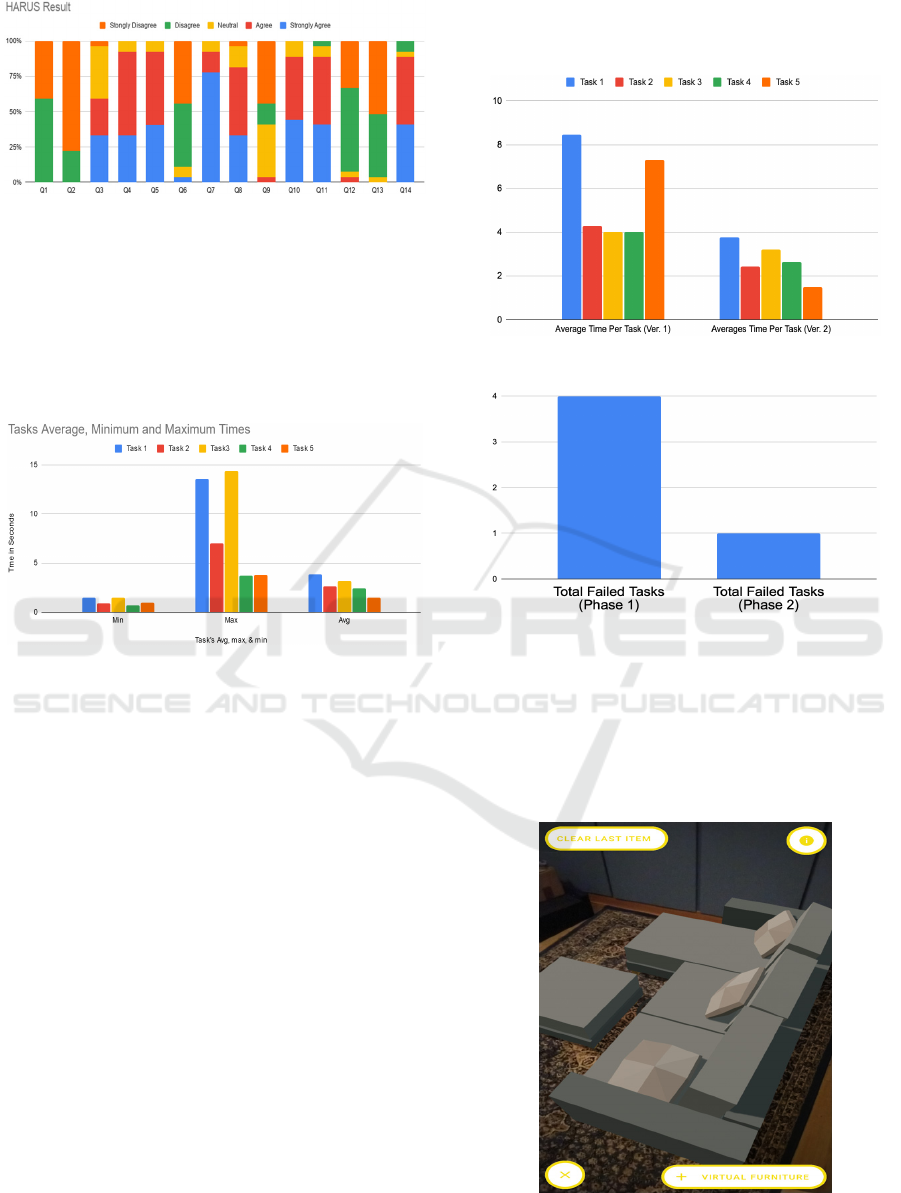
Figure 7: Version 2 HARUS Result.
4.2.3 Time-on Task Result
The average, maximum, and minimum times for
completing each task by users' results are presented in
Figure 8. The data shows significantly lower times for
achieving the tasks when compared to the version 1
results demonstrated in Figure 3.
Figure 8: Version 2 Min, Max and Avg Task Times.
4.2.4 Final User Recommendations
For the second version users suggested the following
additions: adding sound cues, have more notifications
in case users fail to calibrate the AR view or any other
task, better colors for readability, add a visual
indicator that shows which item is currently
selected/to be placed, use visual indicator (e.g.,
highlighted circles) that tells users objects can be
resized, moved, and rotated, and unlike feedback
from the first version, many users noted that they
encountered no issues while using the application.
5 DISCUSSION
As is apparent in the results, these are the tasks that
are specifically affected by the changes made in the
second version of the application: object placement /
searching and the “Clear all” function.
These two tasks were affected due to making the
items menu easier to access and because of having the
“Clear all” button directly accessible from the main
screen. The results of our changes are summarized in
the following two graphs:
Figure 9: Average Time per task comparison.
Figure 10: Comparison of failed tasks.
As evident by the graphs there is a significant
improvement in the task success and time on task.
Examples of tasks not being performed
successfully include users unable to complete the task
in a reasonable amount of time or placing the wrong
object as in Figure 11.
Figure 11: For example, instead of placing a chair, the user
places a sofa.
Enhancing User Experience of Interior Design Mobile Augmented Reality Applications
107

Based on our findings we can summarize how
developers can enhance their furniture based/interior
design AR application in the following main points:
●
Having all of the application’s main features
directly accessible in the main screen/view is
vital for showing users the available options at
their disposal. We find that placing features in
sub-menus reduces the speed at which users
access these features.
●
Having some sort of tutorial is beneficial in
allowing users to use the application effectively.
However, in our case, since we have a simple
application with limited features, we received
feedback that it was too lengthy, so we
simplified the tutorial.
●
When designing an AR application gesture
interface, it is important to follow what users
already familiar with. For instance, resizing 3D
objects in both AR and non-AR applications is
done using the pinch gesture so deviating from
this method instantly adds an unnecessary
learning curve.
6 CONCLUSION AND FUTURE
WORK
In this paper, a solution for AR 3D/virtual furniture
interior design is developed and evaluated by two
user studies. The first version of the developed
solution is evaluated using five tasks in terms of
System Usability Scale (SUS), Handheld Augmented
Reality Usability Scale (HARUS), task completion
time, and the number of user errors. The first
evaluation recommended having a clickable button
for the side menu instead of dragging from the side,
having undo button, move the “clear scene” button
outside the side menu, and the calibration was
inaccurate on white floors due to the calibration dots
being white as well. These suggestions are utilized to
update the UI of the solution. After that, a second
evaluation is performed using the same measures and
the obtained results show improvement in user
satisfaction and system effectiveness. In the future,
researchers can consider applying the suggested
recommendation to a wider range of AR applications.
Also, researchers can study the positioning of the 3D
furniture on the room based on its real measurement
as this can help in boosting the advancement of the
usage of AR 3D/virtual furniture interior design.
REFERENCES
Dabor, O., Longford, E., & Walker, S. (2019, September).
Design Guidelines for Augmented Reality User
Interface: A Case Study of Simultaneous Interpretation.
In 2019 11th Computer Science and Electronic
Engineering (CEEC) (pp. 164-166). IEEE.
Singh, M., & Singh, M. P. (2013). Augmented reality
interfaces. IEEE Internet Computing, 17(6), 66-70.
Tong, H., Wan, Q., Kaszowska, A., Panetta, K., Taylor, H.
A., & Agaian, S. (2019). ARFurniture: augmented
reality interior decoration style colorization. Electronic
Imaging, 2019(2), 175-1.
Hui, J. (2015, August). Approach to the Interior Design
Using Augmented Reality Technology. In 2015 Sixth
International Conference on Intelligent Systems Design
and Engineering Applications (ISDEA) (pp. 163-166).
IEEE.
Tsai, T. H., Chang, H. T., Yu, M. C., Chen, H. T., Kuo, C.
Y., & Wu, W. H. (2016, July). Design of a mobile
augmented reality application: An example of
demonstrated usability. In International Conference on
Universal Access in Human-Computer Interaction (pp.
198-205). Springer, Cham.
Seow, H. W. (2018). Online furniture shopping using
augmented reality (Doctoral dissertation, UTAR).
Motwani, K., Sharma, S., & Pawar, D. (2017). Furniture
Arrangement Using Augmented Reality. In:
International Research Journal of Engineering and
Technology (IRJET), 4(4).
Brooke, John. (1995). SUS: A quick and dirty usability
scale. Usability Eval. Ind.. 189.
Santos, Marc Ericson & Polvi, Jarkko & Taketomi,
Takafumi & Yamamoto, Goshiro & Sandor, Christian
& Kato, Hirokazu. (2014). A Usability Scale for
Handheld Augmented Reality. Proceedings of the ACM
Symposium on Virtual Reality Software and
Technology, VRST. 10.1145/2671015.2671019.
CHIRA 2021 - 5th International Conference on Computer-Human Interaction Research and Applications
108
