
Sperm Tracking and Trajectory Analysis in Fluorescence Microscopy
Image Sequences
Luc
´
ıa Arboleya
1
, Leonardo de Los Santos
1
, Mariano Fern
´
andez
1
, Luc
´
ıa Rosa-Villagr
´
an
2
,
Rossana Sapiro
2
and Federico Lecumberry
1 a
1
Signal Processing Department, Instituto de Ingenier
´
ıa El
´
ectrica, Facultad de Ingenier
´
ıa, Universidad de la Rep
´
ublica,
J. Herrera y Reissig 565, Montevideo, Uruguay
2
Departamento de Embriolog
´
ıa e Histolog
´
ıa, Facultad de Medicina, Universidad de la Rep
´
ublica, Montevideo, Uruguay
lecumberry@fing.edu.uy
Keywords:
Sperm Tracking, Particle Tracking, Trajectory Classification, Trajectory Analysis.
Abstract:
In this work, we analyze the performance of several tracking methods in the scenarios of low temporal sam-
pling acquisition setup in fluorescence microscopy. Machine Learning methods were applied to classify and
analyze the extracted trajectories of sperm samples and their motion parameters. The results were compared
with the most widely used sperm motility classification methods. Analyzed image sequences include real
sequences acquired by confocal fluorescence microscopy and synthetic sequences generated by in-house soft-
ware. The complete framework runs as a standalone application and can be used with minimal training by
users with no programming skills.
1 INTRODUCTION
Infertility is a worldwide increasing condition, affect-
ing up to 12% of couples of childbearing ages (Ku-
mar and Singh, 2015). Although the male factor ac-
counts for at least 30–40% of the cases, there is a tra-
ditional lack of emphasis on the contribution of men
to the field (Walters et al., 2020). As a consequence,
the vast majority (>70%) of male infertility cases
are deemed idiopathic, a situation that severely limits
treatment strategies to rescue fertility (Walters et al.,
2020). Currently, there are no diagnostic methods that
determine the condition of infertility and this catego-
rization is based fundamentally on the patient’s clini-
cal history and sperm analysis (spermiogram) (World
Health Organization, 2010). Semen analysis is the
gold standard test for analyzing male fertility status
and it includes the analysis of sperm count, sperm
motility, and sperm morphology. Sperm motility is
one of the parameters closely related to the success of
in vivo fertilization. Consequently, there is an espe-
cial interest in tracking sperm movements to under-
stand sperm biology as a marker of sperm’s ability to
fertilize the egg (Mortimer et al., 2015).
Computer-Aided Sperm Analysis (CASA) tech-
a
https://orcid.org/0000-0002-5491-2019
nology was developed in the late 1980s for analyz-
ing sperm movement based on the extraction and
analysis of the spermatozoa’s trajectories (Mortimer
et al., 2015; Walters et al., 2020). This technology
is mostly used in the research area since in general,
CASA’s confidence level is not enough to be applied
in the clinical field (Mortimer et al., 2015). Moreover,
different CASA instruments compute sperm motil-
ity parameters using different algorithms to classify
sperm, thus, values may not be comparable among
systems (World Health Organization, 2010).
CASA are developed to work with bright-field mi-
croscopy images, using phase-contrast optics to high-
light the head of each spermatozoon that allows re-
searchers to analyze the sperm motility (Alqu
´
ezar-
Baeta et al., 2019; Goodson et al., 2017; Mortimer
et al., 2015), however, it is not usual to find a proper
solution to be applied to fluorescence images.
On the other hand, there are many algorithms
and implementations for tracking objects and par-
ticles in sequences. Some are free accessible and
open source, such as TrackMate (Tinevez et al., 2017)
for ImageJ (Schneider et al., 2012) or TrackPy (Al-
lan et al., 2019). However, none of them were de-
veloped specifically for fluorescence microscopy im-
ages, where fluorescence intensity or distribution is
quantified at every frame.
Arboleya, L., Santos, L., Fernández, M., Rosa-Villagrán, L., Sapiro, R. and Lecumberry, F.
Sperm Tracking and Trajectory Analysis in Fluorescence Microscopy Image Sequences.
DOI: 10.5220/0010625501030110
In Proceedings of the 18th International Conference on Signal Processing and Multimedia Applications (SIGMAP 2021), pages 103-110
ISBN: 978-989-758-525-8
Copyright
c
2021 by SCITEPRESS – Science and Technology Publications, Lda. All rights reserved
103
Beyond advances in optics and detectors, imaging
has strongly benefited from the development of fluo-
rescent probes. Fluorescent probes or genetically en-
coded fluorescent proteins can provide real-time mon-
itoring of function on living cells. In the case of sperm
cells, the use of fluorescent probes combined with
computer analysis may provide a new tool to analyze
and classify samples e.g to differentiate fertile from
infertile men. MitoTracker™ Red CMXRos is a red-
fluorescent dye that stains mitochondria in live cells
and its accumulation is dependent upon membrane
potential (Zhang et al., 2019). In the sperm cells Mi-
toTracker™ stains part of the flagella; the midpiece.
Although the particle-like object detection in flu-
orescence images is benefited from the specificity of
the fluorophore marker, the achieved frame rate is an
important variable for a tracking algorithm. It is al-
ready known that a low frame rate defies the process
of association of the detected objects in frame I
k+1
with the set Z
k
of trajectories ζ
i
computed up to frame
I
k
, Z
k
= {ζ
i
}
k
. In fact, in Laser Scanning Confo-
cal Microscopy (LSCM) such as the one used in this
work, the image formation process depends on sev-
eral factors (e.g. size of pinhole, photobleaching, in-
strument characteristics, etc.) and it could determine
errors in the classification of sperm. This bottleneck
in the acquisition of higher frame rates sequences is
produced because the image formation process is per-
formed in a raster scanning pattern, where a photo-
multiplier quantifies the intensity of light only in one
selected region of the image at a time, instead of in
a parallel process as in the CCD or CMOS detec-
tors (Dobrucki, 2013).
In this work, we analyzed the performance of five
different particle tracking algorithms under different
frame rates ranging from a challenging 6 fps to 60 fps.
Also, we evaluated different Machine Learning meth-
ods for trajectory analysis and compared them with
the WHO manual procedure. To obtain a gold stan-
dard for quantification, we developed software for
generating synthetic sperm image sequences. The
software allowed us to analyze the performance vary-
ing parameters such as sequence frame rate, sperma-
tozoon size, shape, speed, head beating angle, among
others. Also, real image sequences were acquired and
processed.
The document is organized as follows. In Sec-
tion 2 we review the main characteristics of the
sample preparation and image formation process in
LSCM. In Section 4.1 we present the studied algo-
rithms among with the summary of results of perfor-
mance analysis. In Section 4 we describe the Ma-
chine Learning methods studied for trajectory classi-
fication and the results obtained in synthetic and real
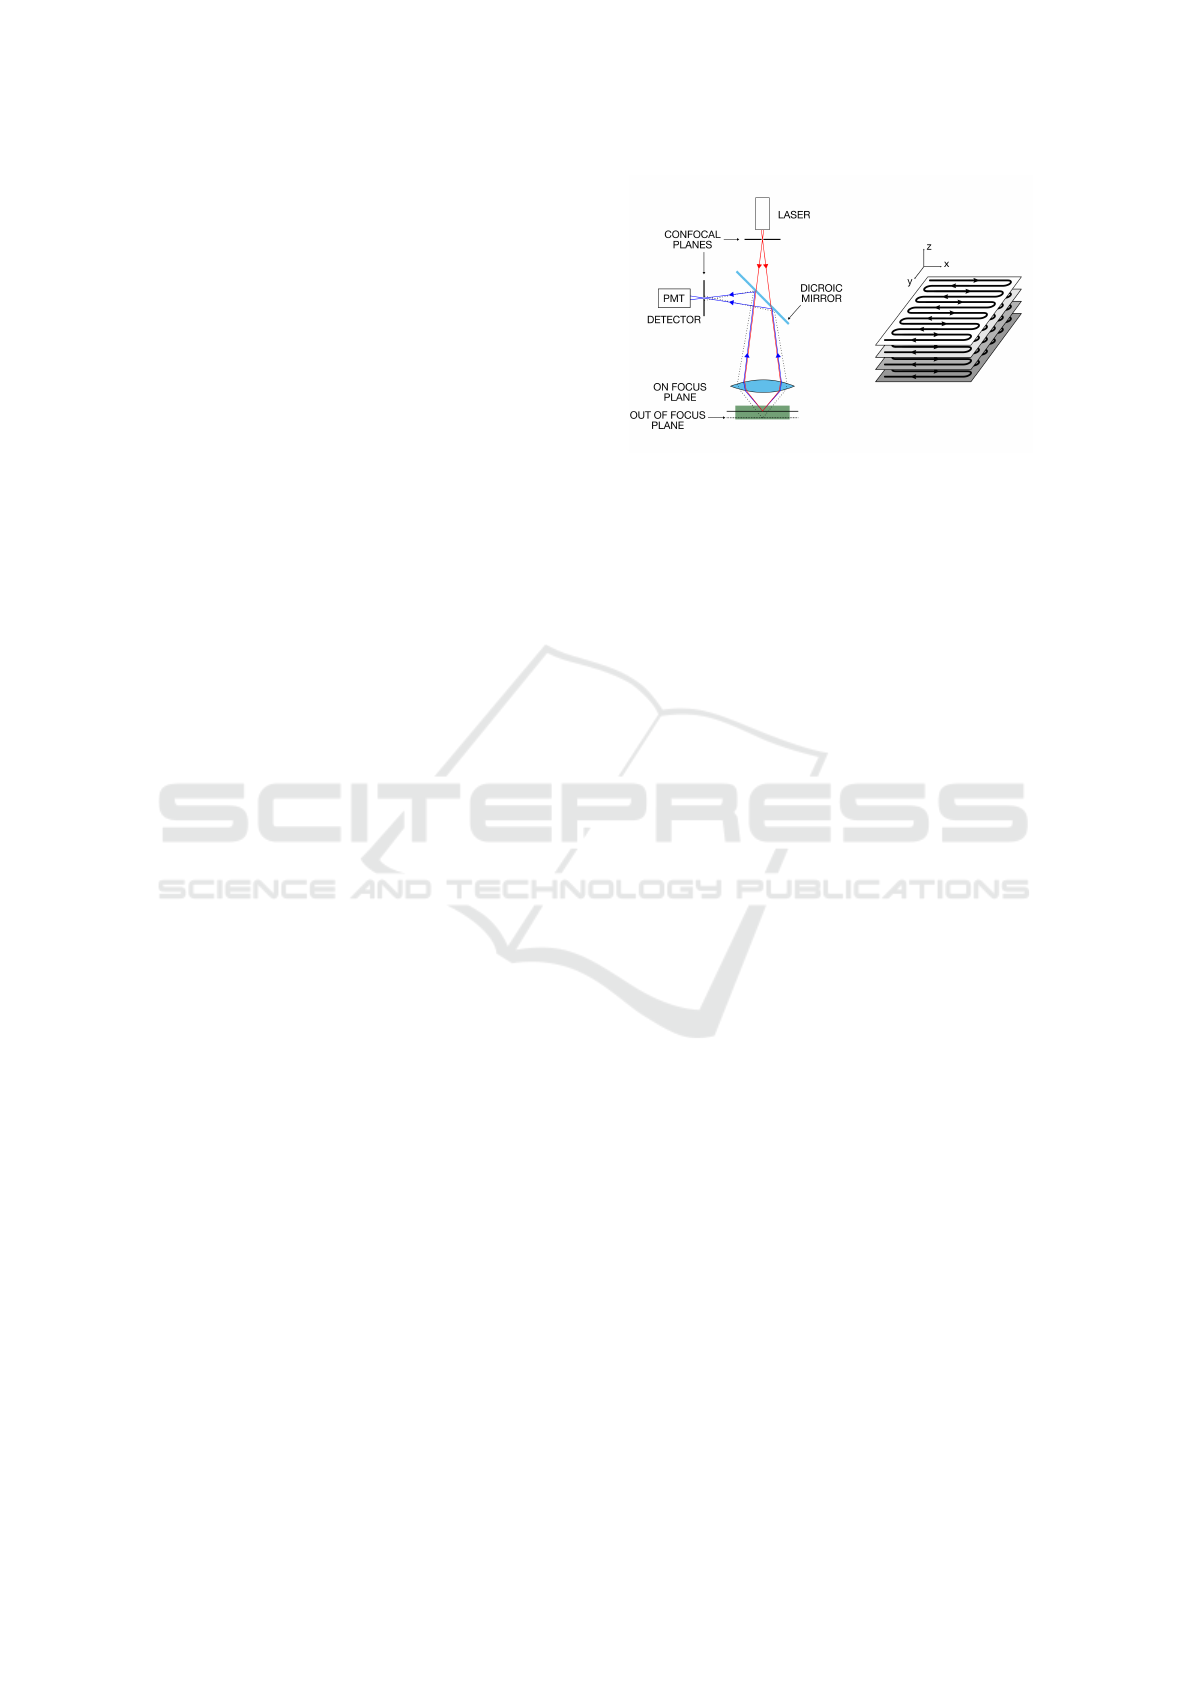
Figure 1: Laser Scanning Confocal Microscope image for-
mation schematic diagram.
sequences. Section 5 presents the conclusions of this
work and future lines of research.
2 MICROSCOPY IMAGE
SEQUENCE ACQUISITION
2.1 Sample Preparation
Semen samples of three donors were studied. Semen
samples were spun at 300g for 10 minutes and su-
pernatants were carefully removed. Pellets were re-
suspended in BWW Albumin 0.3% 25 mM NaHCO
3
HEPES medium. Approximately 5 million spermato-
zoa were incubated with 50 nM MitoTracker™ Red
CMXRos (ThermoFisher) minutes at 37
◦
C during 30
minutes. Volumes of 100-110 µl of samples were
loaded in the ThermoFischer™ Nunc™ Lab-Tek™
Chambers and observed under the confocal micro-
scope (Leica, TCS SP5 II). Acquisition parameters of
the confocal microscope were: zoom 1.7×, magnifi-
cation 40×, two lines average, excitation lasers HeNe
(543 nm, 633 nm), 512×512 pixels 120 frames se-
quences. The confocal microscope’s pinhole aperture
was maximized (3 Airy) to reduce the optical section-
ing.
2.2 Image and Sequence Acquisition
Laser Scanning Confocal Microscopy (LSCM) image
formation process is schematically presented in Fig-
ure 1. A laser emits a beam of light to the sample
with a certain wavelength to excite the fluorophores.
The beam of light passes through a lens, a beam split-
ter, and another lens to illuminate a specific part of
the focal field in the sample. This beam excites the
fluorophore molecules attached to the midpiece of the
spermatozoon, and they go to an unstable state of en-
ergy. To go back to a stable state, the fluorophore
SIGMAP 2021 - 18th International Conference on Signal Processing and Multimedia Applications
104
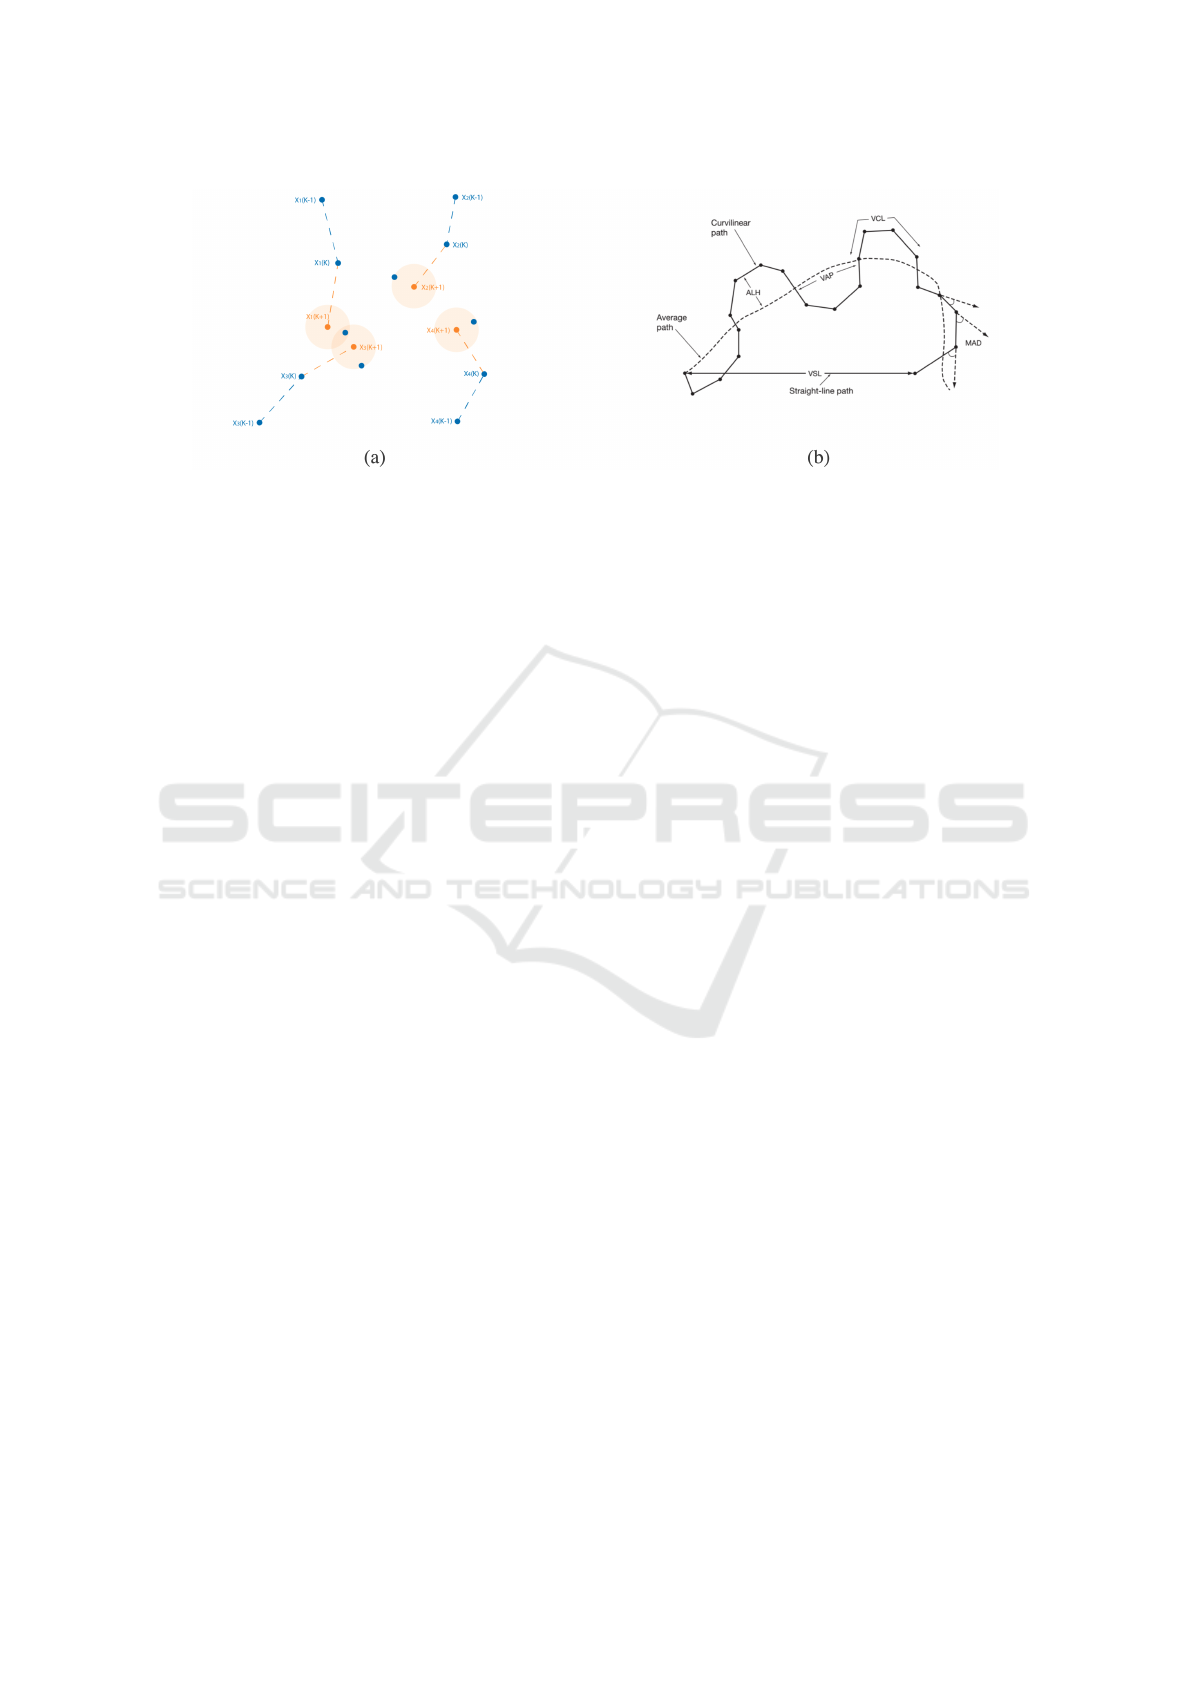
Figure 2: (a) Trajectory assignation problem. In blue the detection for every frame, and in orange the prediction of the position
in frame k +1 for every trajectory. (b) Sperm trajectory descriptors proposed by the WHO (World Health Organization, 2010).
Image adapted from (World Health Organization, 2010).
emits surplus energy by emitting photons in a cer-
tain wavelength. These photons are reflected by the
beam splitter, pass through a pinhole to filter the out-
of-focus planes’ light, and then are captured and tra-
duced using a photomultiplier (PMT) detector. The
PMT records the intensity of light only in a selected
region of the sample at a time, which then is converted
to an intensity level in some pixels of the image (Do-
brucki, 2013). These steps are repeated for each pixel
composing the image. This process is slower than ac-
quiring the image with a CCD or CMOS array detec-
tor where the photon-voltage conversion is performed
in parallel for all the pixels.
Moreover, if more than one fluorophore is used in
the sample, the previous process is repeated for each
one of the lasers needed to excite each fluorophore.
In addition to these steps, each region of the image
could be visited many times, averaging the measures
to increase the Signal to Noise Ratio (SNR). Besides
this line averaging, several frames could be averaged
to form only one image, too. This process reduces
the frame rate that could be achieved by an LSCM,
impacting the analysis of time-lapse sequences.
On the other hand, the size of the image could be
reduced to increase the frame rate, which could pro-
duce a resolution compromise for a given region of
the sample.
Post-acquisition image processing, including de-
noising and models of particle movements, could help
to overcome these acquisition problems. In practice,
the size of the objects and the bandwidth of their
trajectories affect the spatial and temporal sampling
rates, respectively. In the dataset analyzed in our case,
as a general conclusion, the post-acquisition image
processing of the noisy image sequences allowed us to
increase the temporal sequence resolution with good
detection of the spermatozoon location in each frame.
3 SPERM TRACKING
A general framework for object tracking usually has
two main blocks, preceded by the preprocessing op-
erations. First, all the objects are detected in each
frame; in this step, prior information about the ob-
jects’ appearance and image acquisition is used. Sec-
ond, based on the trajectories computed up to frame k
a prediction of the position of each particle at frame
k + 1 is computed, then these predictions and the de-
tection are linked updating the trajectories (Pulford,
2005). This second process is schematically shown in
Figure 2a.
The literature on object tracking in Computer Vi-
sion and Image Processing is extensive (see refer-
ences in (Bar-Shalom and Daum, 2010)) given the
existence of several issues related to this problem.
Sperm tracking can be thought of as a specific case
of particle tracking, in which each spermatozoon is a
single particle. In this case, a modified Kalman Fil-
ter is used to model the sperm movement as in (Ur-
bano, 2014). This model estimates the average path of
the sperm trajectory. The deviation from the average
path, which is mainly caused by the movement of the
head, is modeled as random noise which represents
the acceleration of the spermatozoon. This model can
be good for low sample rates but not for high sample
rates, where the deviation from the head predominates
over the average path. Given the acquisition process,
the sample rate of the image sequences taken by the
confocal microscopy is rather low so the model fits
the problem.
Since multiple spermatozoa are present in a sperm
sample in each frame one Kalman Filter for each par-
ticle is needed. Therefore, once all the spermatozoa
are detected in a frame, it is necessary to determine
which measurement was originated by which sperma-
Sperm Tracking and Trajectory Analysis in Fluorescence Microscopy Image Sequences
105
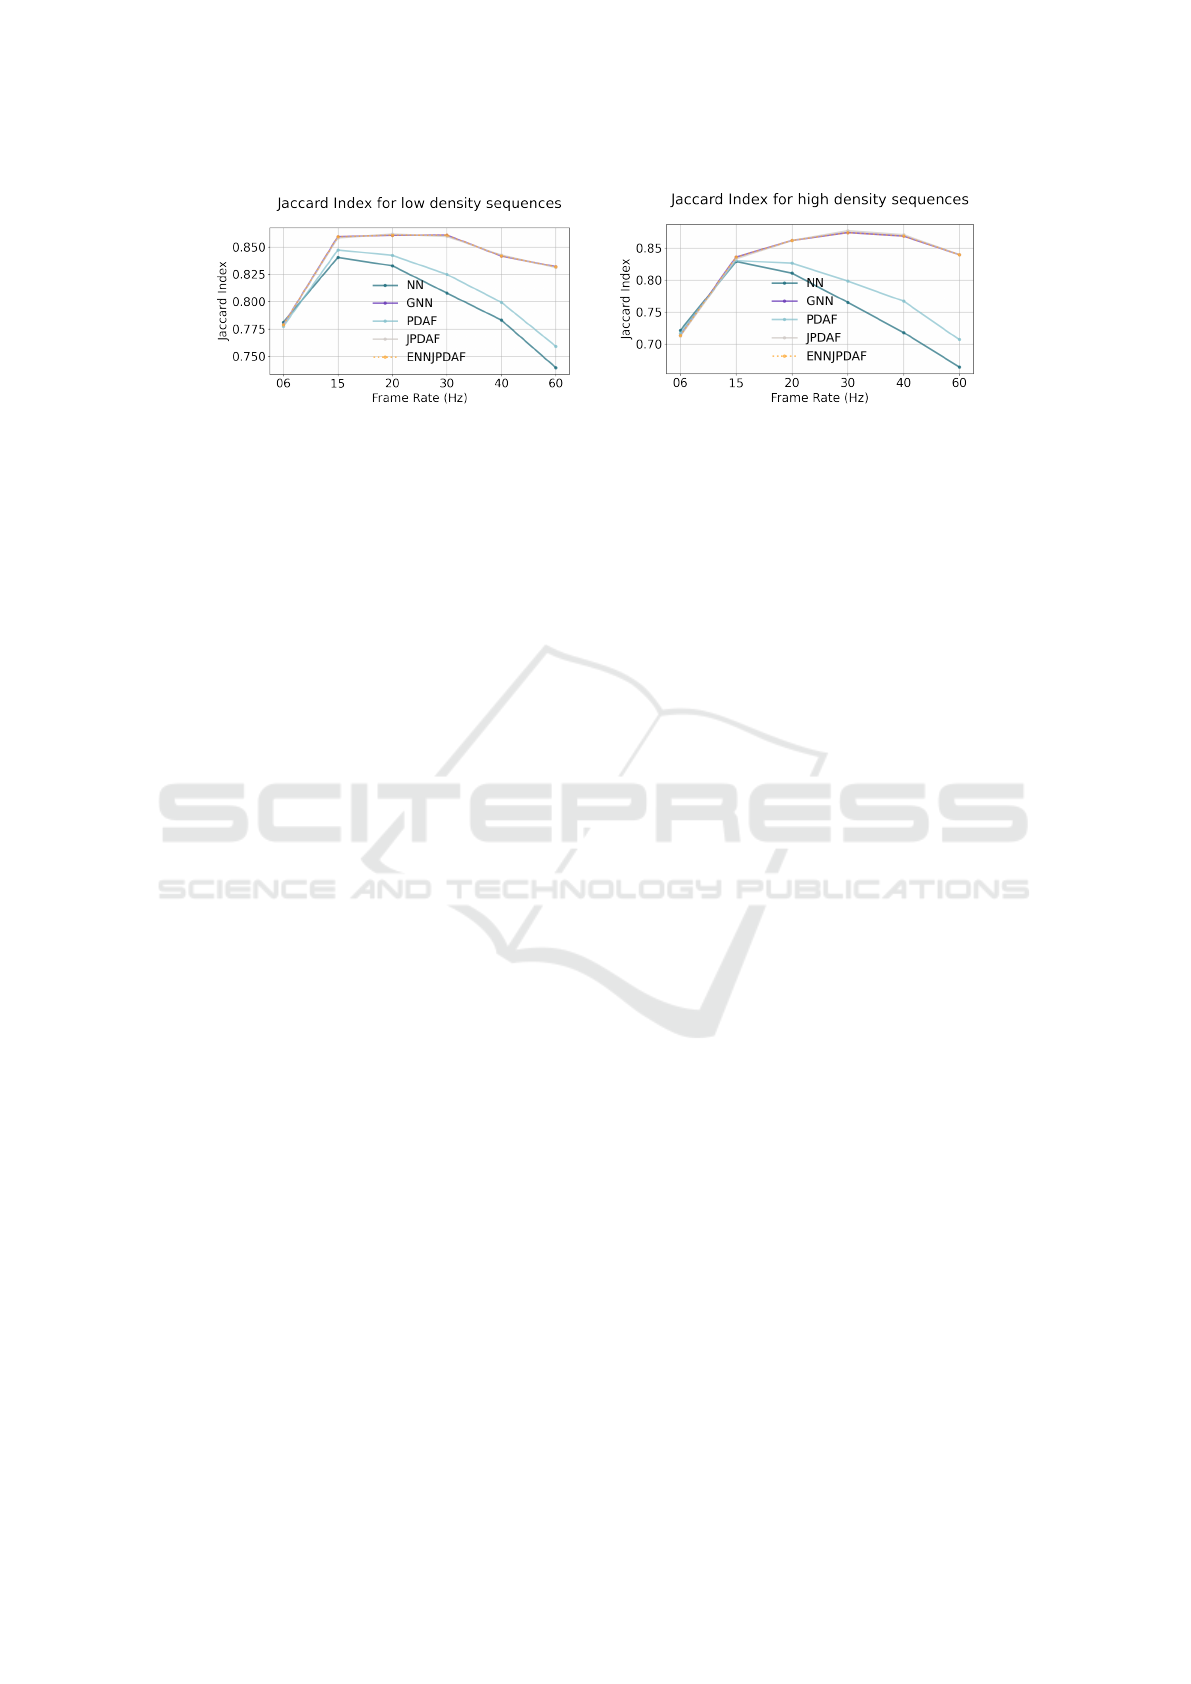
Figure 3: Jaccard Index for tested algorithms and sequences frame rates when compared with the simulated trajectories as
ground truth.
tozoon. This is a key step in the tracking process since
it is important to update the Kalman Filter of each
spermatozoon with the right measurement; meaning,
the one that was originated by that same particle.
The tracking analysis in this work is strongly
based on the works of Urbano at al. (Urbano, 2014;
Urbano et al., 2017) and Mortimer et al. (Mortimer
et al., 1988; Mortimer and Swan, 1999). Based on
these works we analyzed the performances of the fol-
lowing methods to make the association between the
spermatozoa detections (trajectory linking).
• Nearest Neighbor (NN) (Vo et al., 2015) is a
greedy method where particles are sequentially
processed assigning the target whose position is
closest to the predicted position,
• Global Nearest Neighbor (GNN) (Munkres, 1957)
differs from the previous one on the targets are as-
signed considering all the detected objects using
the Hungarian method of combinatorial optimiza-
tion,
• Probabilistic Association Filter (PDAF) (Bar-
Shalom and Daum, 2010) computes an associa-
tion probability to the target for each detected po-
sition, then given an association, the state of a tar-
get is estimated by a filtering algorithm, and this
conditional state is weighted by the association
probability,
• Joint Probabilistic Association Filter
(JPDAF) (Bar-Shalom and Daum, 2010) is
the PDAF extension for multiple targets, and
• Exact Nearest Neighbor - Joint Probabilistic As-
sociation Filter (ENN-JPDAF) (Fitzgerald, 1986)
computes an approximation of the probability of
association used in JPDAF which can be solved
in close form which is applied before a nearest-
neighbor scheme.
Once the trajectories are determined for each sper-
matozoon, the next step in sperm analysis is to group
them based on their motility characteristics. The tra-
ditional approach is to take some predefined param-
eters, representing the speed, traveled distance, lin-
earity of the movement, etc. Guidelines for com-
puting these descriptors and their thresholds for each
group are published by the World Health Organization
(WHO) (World Health Organization, 2010; Elia et al.,
2010). Some of these trajectory descriptors, shown in
Figure 2b, are:
• VCL (curvilinear velocity in µm/s): averaged
speed of a spermatozoon along its 2D curvilinear
path.
• VSL (straight-line velocity in µm/s): average
speed of a spermatozoon along the line between
its first and last detected positions.
• VAP (average path velocity in µm/s): average
speed of a spermatozoon along its average path.
• ALH (amplitude of lateral head displacement in
µm): lateral displacement of a spermatozoon
about its average path.
• BCF (beat-cross frequency in Hz): average rate of
the crosses between the curvilinear and the aver-
age path.
• MAD (mean angular displacement in degrees):
average of absolute values of the turning angle of
the spermatozoon.
3.1 Tracking Experiments
To analyze and quantify the performance of these
methods under different sequences’ frame rates, sim-
ulation software was implemented. This software as-
sumes an ellipsoidal shape for the spermatozoa mid-
pieces and models its movement following the char-
acteristics of real sequences as described in (Urbano,
2014).
The detection of the spermatozoon’s midpieces
in fluorescence is obtained by automatic threshold-
ing (Otsu’s method) followed by mathematical mor-
phology operations for filling holes and close regions.
In phase-contrast images, this step is substituted by a
SIGMAP 2021 - 18th International Conference on Signal Processing and Multimedia Applications
106
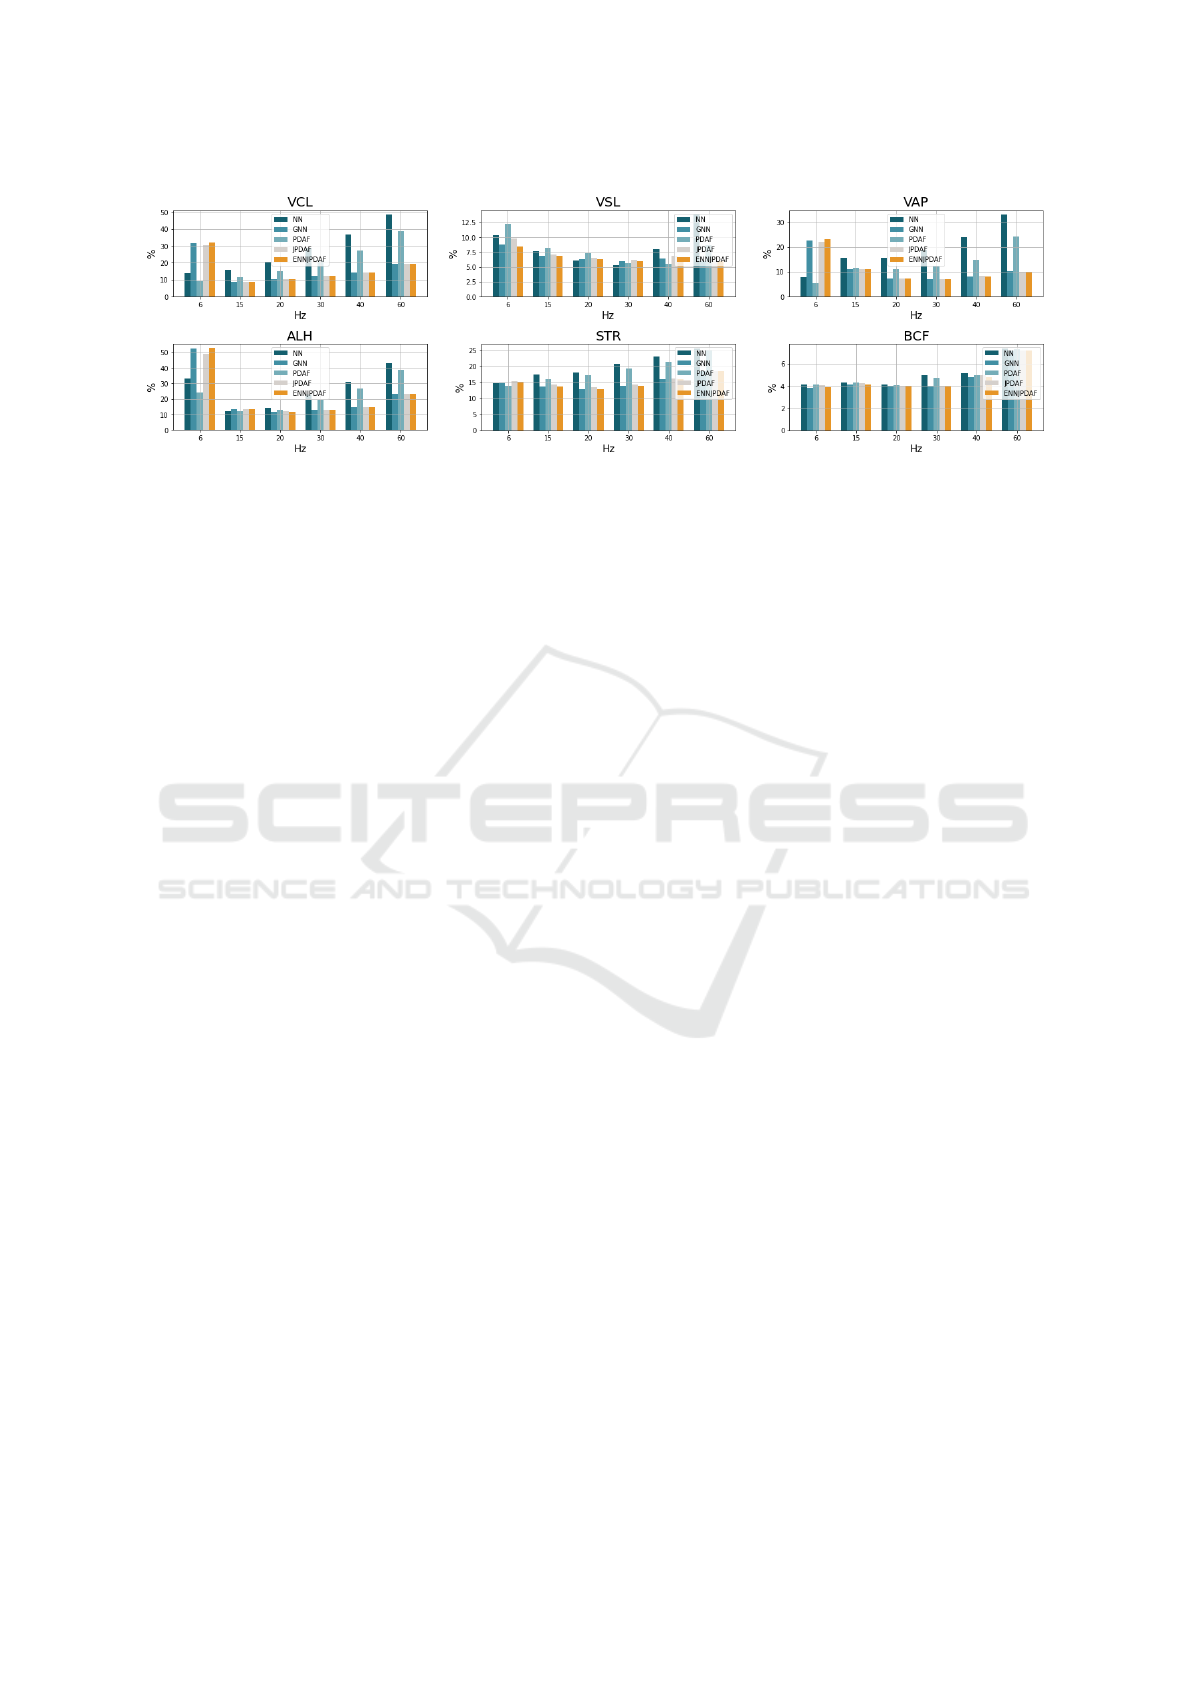
Figure 4: Relative error for WHO trajectories’ descriptors for tested methods and sequences frame rates.
Difference of Gaussians filtering adapted to the image
resolution and spermatozoa average head size.
Two sequence scenarios were tested taking into
account the density of spermatozoa in the images,
considered low or high by the experts. Sequences
were generated with a maximum frame rate of 60 fps
and undersampled to obtain sequences at 40, 30, 20,
15, and 6 fps. For every frame rate, trajectories were
extracted with the five methods described above and
compared with the simulated trajectories as ground
truth. Tracking methods’ performance is evaluated
based on two criteria comparing the extracted and
ground-truth trajectories sets. First, the Jaccard In-
dex for measuring the similarities between sets, and
second, the mean relative error in the computation of
the WHO’s trajectory descriptors described above.
Figure 3 shows Jaccard Indexes obtained for the
tested methods varying the sequences’ frame rates, for
low (left) and high (right) density of spermatozoa. Re-
sults are consistent between the experiments. The per-
formance for all the methods is significantly reduced
at very low frame rates (6 fps). Results for GNN,
JPDAF, and ENN-JPDAF are indistinguishable, and
they improve with higher frame rates, except in very
high frame rates (60 fps) where the performance de-
creases. Analyzing the 60 fps sequences and trajec-
tories, this drop of performance is based on the high
frequency and amplitude of lateral movement of the
spermatozoa which are not well captured by the meth-
ods. On the other hand, NN and PDAF performance
is poor and decreases for high frame rates. These per-
formances are worse in high-density sequences where
the presence of more particles produces more assign-
ment errors.
Figure 4 shows the mean relative error in six
selected WHO’s trajectory descriptors. Results are
shown for the high-density sequences; the discussion
and conclusions are similar for the low-density se-
quences. In general, as in the previous criteria, the
6 fps sequences’ mean relative errors are systemat-
ically higher than in higher frame rates. Also, NN
and PDAF for frame rates higher than 15 fps have
worse results than the rest of the methods. For GNN,
JPDAF, and ENN-JPDAF results are almost uniform
for frame rates between 15 and 40 fps, this is partic-
ularly true in the VSL where only the first and last
points are used in the computation. The mean rela-
tive error for 60 fps increases, following the behavior
of the previous criteria, in particular for the ALH and
BCF which are strongly dependent on the frequency
and amplitude of the lateral head displacement.
4 TRAJECTORIES
CLASSIFICATION
A four-category system for grading motility is used in
andrology laboratories, both from manual assessment
of sperm motility as well as computer-aided sperm
analysis. These categories are defined as (Elia et al.,
2010): Straight-Line Progressive (SLP), Straight
Slow Progressive (SSP), Non-Straight Progressive
(NSP), and Non-Progressive (NP).
As mentioned before the WHO published a set
of guidelines for sperm motility classification based
on trajectory descriptors (VSL, VCL, ALH, etc.). It
is known that different CASA instruments compute
these parameters using different algorithms, there-
fore, the values may not be comparable among sys-
tems (World Health Organization, 2010). Another
weakness of these parameters is that they tend to de-
pend on the frame rate of the acquired sequence, this
issue is well studied by Mortimer et al. (Mortimer
et al., 1988; Mortimer and Swan, 1999) and our anal-
ysis confirms these results. In this section, a data
driven approach is presented comparing a method
based on Machine Learning with the classification ob-
tained with the mentioned trajectory descriptors (Elia
et al., 2010).
One of the challenges for a Machine Learning
framework is to cope with input vectors with differ-
Sperm Tracking and Trajectory Analysis in Fluorescence Microscopy Image Sequences
107

Table 1: Confusion matrix for synthetic sequences (in per-
centage, normalized by row).
Predicted label
SLP SSP NSP NP
True label
SLP 88.5 10.2 0.0 1.3
SSP 0.0 99.0 0.0 1.3
NSP 0.0 0.0 99.0 1.1
NP 0.0 1.2 0.0 98.8
ent dimensions. This is the case of trajectories for ob-
jects appearing in different numbers of frames. In our
framework, the trajectory for the i-th spermatozoon is
represented as a 3N
i
-dimensional array
ζ
i
= [[x
0
i
, y
0
i
,t
0
i
], ··· , [x
j
i
, y
j
i
,t
j
i
], ··· , [x
N
i
−1
i
, y
N
i
−1
i
,t
N
i
−1
i
]]
where N
i
is the number of points detected in the tra-
jectory, and j = 0, ··· , N
i
− 1.
To obtain a fixed dimensional input vector de-
scribing each trajectory, we follow the proposal of
Yao et al. (Yao et al., 2017), where they studied a
problem of trajectory classification applied to Global
Positioning System (GPS) data. They propose a Be-
havior Feature Extraction Algorithm based on sliding
windows through the trajectory points. These features
are the input of a neural network based on encoder-
decoder (autoencoder) to learn characteristics from
the trajectories.
The classification is performed using a Support
Vector Machine (SVM) trained with labeled trajecto-
ries. The ground-truth labels were computed based
on the classification guidelines defined by Elia et
al. (Elia et al., 2010) using the WHO trajectory de-
scriptors (World Health Organization, 2010).
4.1 Classification Experiments
Following the procedure described in Section 3.1 we
generated a set of synthetic sequences where 1658
simulated trajectories were extracted. The trajecto-
ries are balanced among the four groups: Straight-
Line Progressive (SLP), Straight Slow Progressive
(SSP), Non-Straight Progressive (NSP), and Non-
Progressive (NP). Each trajectory ζ
i
is preprocessed
and the trained autoencoder computes the h
i
feature
vector. The ground truth labels are computed based
on WHO descriptors for the extracted trajectories as
described in Section and compared with the label as-
signed by the trained classifier.
A k-fold training of the SVM is performed split-
ting the set of feature vectors {h
i
} in training and test-
ing sets with 80% and 20% of the samples respec-
tively. The obtained confusion matrix is shown in Ta-
ble 1. The Accuracy obtained in this case is 96.4%,
Average Specificity (Recall) of 96.2%, and Average
Table 2: Confusion matrix for real sequences (in percent-
age, normalized by row).
Predicted label
SLP SSP NSP NP
True label
SLP 54.5 9.1 0.0 36.4
SSP 30.0 60.0 0.0 10.0
NSP 22.2 22.2 0.0 55.6
NP 4.7 28.6 0.0 66.7
Sensitivity (Precision) of 96.6%. The Specificity and
Sensitivity for each class are shown in Table 3. Fig-
ure 5 shows a 2D and 3D embedding via Principal
Component Analysis (PCA) decomposition.
The results are very good, confirming that the la-
tent space learned by the autoencoder is a good fea-
ture representation space for the trajectories.
Taking into account the embedding obtained in
Figure 5 we observed similar behavior for both clas-
sifiers. They show well-defined regions for the Non-
Progressive and Non-Straight Progressive. The re-
gions for the Straight-Line Progressive and Straight-
Slow Progressive are very close between each other,
and far from the NSP and NP. In the case of the WHO
classification, there are more NP trajectories sparsely
distributed in all the embedding.
This lower distance observed between the SSP
and SLP classes is remarkable since it is well known
that in practice for fertility evaluation the spermato-
zoa considered are only these two classes without dis-
crimination among them. Categorization of progres-
sively motile spermatozoa as rapid or slow, (with a
speed cut off of 25 µm/sec at 37
◦
C) is constantly un-
der debate in the field. This is based mainly on the dif-
ficulty to define the forward progression so accurately
without bias (Cooper and Yeung, 2006). As a conse-
quence, the last WHO recommendations suggest that
clinicians may use total motility (PR + NP) or pro-
gressive motility (PR) to establish reference values in
infertility (World Health Organization, 2010).
Testing the classification framework with real
sperm sequences was performed over 331 trajecto-
ries extracted from sequences acquired as explained
in Section 2.1. Feature extraction and SVM train-
ing and classification were performed following the
same procedure described above. The obtained con-
fusion matrix is shown in Table 2. The Accuracy ob-
Table 3: Specificity (Recall) and Sensitivity (Precision) for
synthetic sequences.
SLP SSP NSP NP
Specificity 88.46 98.73 98.89 98.82
Sensitivity 100 89.65 100 96.55
SIGMAP 2021 - 18th International Conference on Signal Processing and Multimedia Applications
108
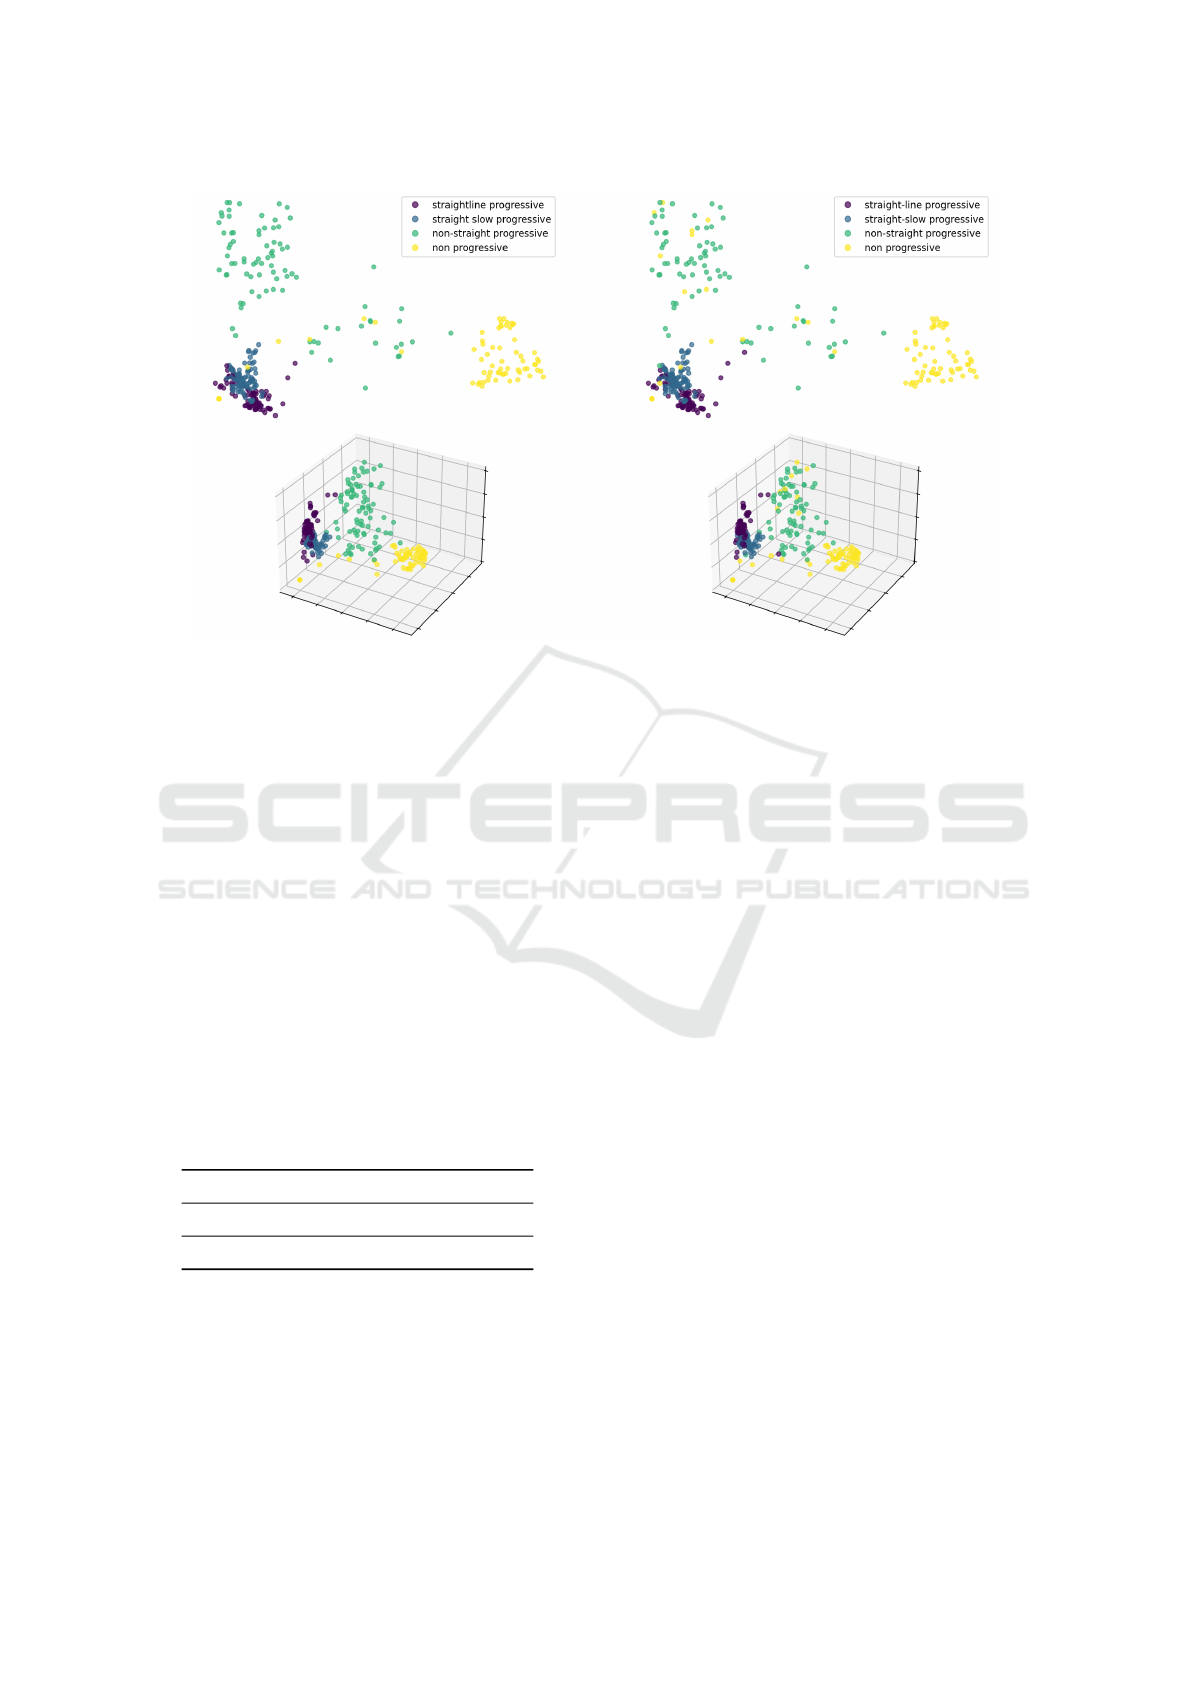
Figure 5: 2D and 3D embedding via Principal Component Analysis (PCA) decomposition for the synthetic trajectories. Colors
are assigned by the SVM (left) or ground truth (right) classification.
tained in this case is 52.5%, Average Specificity (Re-
call) of 45.3%, and Average Sensitivity (Precision) of
51.1%. The Specificity and Sensitivity for each class
are shown in Table 4.
In this real case, the results show an important
drop in performance in all parameters. However, sev-
eral comments can be made. There are no trajectories
classified as NSP. Despite this class, the diagonal of
the confusion matrix, the True Positives, are the high-
est values in the confusion matrix per normalized row
(true labels). Following the similarity observed be-
tween SSP and SLP, comparing the progressive (SLP
and SSP) with the non-progressive classes (NSP and
NP) the performance increases. However, the classifi-
cation still lacks the capacity of discrimination for the
NSP class. This could be explained by the small num-
ber of trajectories extracted from the real sequences.
Table 4: Specificity (Recall) and Sensitivity (Precision) for
real sequences.
SLP SSP NSP NP
Specificity 54.55 60.00 0 66.67
Sensitivity 40.00 57.14 - 56.00
5 CONCLUSIONS AND FUTURE
WORK
In this work, we presented an analysis of several
methods for sperm samples tracking in sequences
with different frame rates in fluorescence microscopy.
Three of these methods achieved similar perfor-
mances, these were Global Nearest Neighbor (GNN),
Joint Probabilistic Association Filter (JPDAF), and
Exact Nearest Neighbor Joint Probabilistic Associ-
ation Filter (ENN-JPDAF). Performance was mea-
sured using the Jaccard Index, and the mean relative
error in several trajectory descriptors. The perfor-
mance was similar for frame rates spanning from 15
to 40 frames per second, but it drops significantly for
6 frames per second.
We also analyzed the performance of a Support
Vector Machine classification of the extracted trajec-
tories based on an intermediate representation given
by an autoencoder latent space. The performance
achieved in synthetic sequences was very high. For
real sequences, we observed several drawbacks lead-
ing to new lines of work.
The lack of labeled data in real sequences in fluo-
rescence microscopy is one of the main issues and it
will become part of a future line of work. Increasing
the amount of data will help in the training process of
machine learning methods, including modern meth-
ods based on convolutional networks or deep learn-
ing.
The developed framework allows us to extract in-
formation about the sperm trajectories while quanti-
fying the fluorescence in the spermatozoa midpieces.
In the future, this will provide an extremely useful
tool for studying the health of each spermatozoon,
measured by its fluorescence, and its motility param-
eters simultaneously. Here we presented the track-
Sperm Tracking and Trajectory Analysis in Fluorescence Microscopy Image Sequences
109

ing analysis of sperm labeled with MitoTracker™ that
specifically binds to mitochondria in the sperm flag-
ella. The possibility to track sperm movements us-
ing other fluorescent probes may have multiple appli-
cations. Several fluorescence compounds have been
developed that are able to detect changes in calcium
variations, production of reactive oxygen species, mi-
tochondrial activity, etc. meaning that it will be pos-
sible to match either of these functions with sperm
motility patterns. The tool may be useful to test drugs
that modify the motility patterns of subpopulations of
sperm. Moreover, multiple probes may be used at the
same time to explain different biological effects.
The developed framework is publicly available in
our GitLab repository
1
.
ACKNOWLEDGEMENTS
This work was partially supported by Espacio Inter-
disciplinario, Universidad de la Rep
´
ublica, Uruguay.
REFERENCES
Allan, D., van der Wel, C., Keim, N., Caswell, T. A.,
Wieker, D., Verweij, R., Reid, C., Thierry, Grueter,
L., Ramos, K., and et al. (2019). soft-matter/trackpy:
Trackpy v0.4.2.
Alqu
´
ezar-Baeta, C., Gimeno-Martos, S., Miguel-Jim
´
enez,
S., Santolaria, P., Y
´
aniz, J., Palac
´
ın, I., Casao, A., Ce-
bri
´
an-P
´
erez, J.
´
A., Mui
˜
no-Blanco, T., and P
´
erez-P
´
e, R.
(2019). Opencasa: A new open-source and scalable
tool for sperm quality analysis. PLoS computational
biology, 15(1):e1006691.
Bar-Shalom, Y. and Daum, F. (2010). The probabilistic data
association filter. Control Systems, IEEE, 29:82 – 100.
Cooper, T. G. and Yeung, C.-H. (2006). Computer-aided
evaluation of assessment of “grade a” spermatozoa
by experienced technicians. Fertility and sterility,
85(1):220–224.
Dobrucki, J. W. (2013). Fluorescence Microscopy, chap-
ter 3, pages 97–142. John Wiley & Sons, Ltd.
Elia, J., Imbrogno, N., Delfino, M., Mazzilli, R., Rossi, T.,
and Mazzilli, F. (2010). The importance of the sperm
motility classes-future directions. Open Andrology
Journal, 2:42–43.
Fitzgerald, R. J. (1986). Development of practical pda logic
for multitarget tracking by microprocessor. In 1986
American Control Conference, pages 889–898. IEEE.
Goodson, S., White, S., Stevans, A., Bhat, S., Kao, C.-Y.,
Jaworski, S., Marlowe, T., Kohlmeier, M., Mcmillan,
L., Zeisel, S., and O’Brien, D. (2017). Casanova: A
multiclass support vector machine model for the clas-
sification of human sperm motility patterns. Biology
of Reproduction, 97.
1
https://gitlab.fing.edu.uy/pfc-tde/testing-docker
Kumar, N. and Singh, A. K. (2015). Trends of male factor
infertility, an important cause of infertility: A review
of literature. Journal of human reproductive sciences,
8(4):191.
Mortimer, D., Serres, C., Mortimer, S. T., and Jouannet,
P. (1988). Influence of image sampling frequency
on the perceived movement characteristics of progres-
sively motile human spermatozoa. Gamete Research,
20(3):313–327.
Mortimer, S. T. and Swan, M. A. (1999). Effect of image
sampling frequency on established and smoothing-
independent kinematic values of capacitating human
spermatozoa. Human Reproduction, 14(4):997–1004.
Mortimer, S. T., van der Horst, G., and Mortimer, D. (2015).
The future of computer-aided sperm analysis. Asian
journal of andrology, 17(4):545.
Munkres, J. (1957). Algorithms for the assignment and
transportation problems. Journal of the society for in-
dustrial and applied mathematics, 5(1):32–38.
Pulford, G. (2005). Taxonomy of multiple target tracking
methods. IEE Proceedings-Radar, Sonar and Naviga-
tion, 152(5):291–304.
Schneider, C. A., Rasband, W. S., and Eliceiri, K. W.
(2012). NIH Image to ImageJ: 25 years of image anal-
ysis. Nature methods, 9(7):671–675.
Tinevez, J.-Y., Perry, N., Schindelin, J., Hoopes, G. M.,
Reynolds, G. D., Laplantine, E., Bednarek, S. Y.,
Shorte, S. L., and Eliceiri, K. W. (2017). Trackmate:
An open and extensible platform for single-particle
tracking. Methods, 115:80 – 90. Image Processing
for Biologists.
Urbano, L. F. (2014). Robust Automatic Multi-Sperm Track-
ing in Time-Lapse Images. PhD thesis, TDrexel Uni-
versity.
Urbano, L. F., Masson, P., VerMilyea, M., and Kam, M.
(2017). Automatic tracking and motility analysis of
human sperm in time-lapse images. IEEE Transac-
tions on Medical Imaging, 36(3):792–801.
Vo, B.-N., Mallick, M., bar shalom, Y., Coraluppi, S., III,
R., Mahler, R., and Vo, B.-T. (2015). Multitarget
tracking. Wiley Encyclopedia, pages 1–25.
Walters, J. L., Gadella, B. M., Sutherland, J. M., Nixon, B.,
and Bromfield, E. G. (2020). Male infertility: shining
a light on lipids and lipid-modulating enzymes in the
male germline. Journal of clinical medicine, 9(2):327.
World Health Organization (2010). WHO laboratory man-
ual for the examination and processing of human se-
men.
Yao, D., Zhang, C., Zhu, Z., Huang, J., and Bi, J. (2017).
Trajectory clustering via deep representation learning.
In 2017 International Joint Conference on Neural Net-
works (IJCNN), pages 3880–3887.
Zhang, X., Sun, Q., Huang, Z., Huang, L., and Xiao, Y.
(2019). Immobilizable fluorescent probes for monitor-
ing the mitochondria microenvironment: a next step
from the classic. Journal of Materials Chemistry B,
7(17):2749–2758.
SIGMAP 2021 - 18th International Conference on Signal Processing and Multimedia Applications
110
