
Novel Pre-processing Stage for Classification of CT Scan Covid-19
Images
D. Vijayalakshmi
1 a
, Malaya Kumar Nath
1 b
and Madhusudhan Mishra
2 c
1
Department of ECE, National Institute of Technology Puducherry, Karaikal, India
2
Department of ECE, North Eastern Regional Institute of Science and Technology, Nirjuli, Arunachal Pradesh, India
Keywords:
CT Image Enhancement, Gradient based Edge Information, Pre-processing for Medical Images, Contrast
Improvement Index.
Abstract:
An accurate evaluation of computed tomography (CT) chest images is crucial in the early-stage detection of
Covid-19. The accuracy of a diagnosis is determined by the imaging modality used and the images’ consis-
tency. This paper describes a gradient-based enhancement algorithm (GCE) for CT images that can increase
the visibility of the infected region. Using a multi-scale dependent dark pass filter aims to increase contrast
while preserving information and edge details of the infected area. Joint occurrence between the edge details
and pixel intensities of the input image is calculated to construct a cumulative distribution function (CDF). To
obtain the contrast improved image, the CDF is mapped to the uniform distribution. The GCE approach is
tested on the CT Covid database, and performance metrics like the contrast improvement index (CII), discrete
entropy (DE), and Kullback-Leibler distance (KL-Distance) are used to evaluate the results. Compared to
other techniques available in the literature, the GCE approach produces the highest CII and DE values and
has more uniformity. To check the suitability of the enhancement algorithm in terms of pre-processing, a pre-
trained AlexNet is employed for the classification of Covid-19 images. The finding shows an improvement of
7% in classification accuracy after enhancing the Covid-19 images using the GCE technique.
1 INTRODUCTION
Image acquisition, image processing, and image dis-
play play a role in medical image diagnosis. Various
types of noise may be introduced into medical images
during the acquisition process. The diagnostic pro-
cess will not be possible with these images. Image
enhancement methods can be used to efficiently elim-
inate noise and improve the quality of input images
to be used for disease detection. A pre-processing
phase in medical image processing is removing inher-
ent noise from the image or enhancing the picture’s
contrast.Low contrast images are also insufficient for
disease diagnosis (Malik et al., 2015).
Covid-19 is caused by SARS-CoV-2 and declared
a pandemic by the World Health Organization (WHO)
in March 2020. Covid-19 is a highly contagious
virus that can lead to fatal acute respiratory distress
syndrome (ARDS). Controlling the spread of Covid-
19 needs early identification and diagnosis. The
a
https://orcid.org/0000-0001-5567-4019
b
https://orcid.org/0000-0002-1959-6452
c
https://orcid.org/0000-0002-5891-7984
reverse-transcription polymerase chain reaction (RT-
PCR) test is the most popular screening tool for de-
tection. However, it is a time-consuming procedure,
and several studies have shown that it has poor sensi-
tivity in the early stages. Computer tomography (CT)
and chest X-ray imaging can be used as an alternative
to the RT-PCR test for precise diagnostic and various
stages of disease evolution. The use of readily avail-
able imaging techniques in all Indian hospitals can be
a faster and less expensive way of diagnosing Covid-
19 (Nath et al., 2020).
Computed tomography (CT) imaging technology
is becoming increasingly relevant in the computerized
diagnostics system for medical assessment and early
diagnosis. However, noise, storage, and transmission
loss often disturb the digital image quality produced
by recent imaging devices, which results in noisy low-
contrast images that can degrade the effects of sub-
sequent measures such as segmentation, feature ex-
traction, and diagnosis. As a result, image quality
enhancement, especially contrast enhancement, has
piqued the interest of researchers over the last two
decades. There are a variety of contrast enhance-
Vijayalakshmi, D., Nath, M. and Mishra, M.
Novel Pre-processing Stage for Classification of CT Scan Covid-19 Images.
DOI: 10.5220/0010625200870094
In Proceedings of the 18th International Conference on Signal Processing and Multimedia Applications (SIGMAP 2021), pages 87-94
ISBN: 978-989-758-525-8
Copyright
c
2021 by SCITEPRESS – Science and Technology Publications, Lda. All rights reserved
87

ment techniques available, such as classical histogram
equalization (HE) and others (Chi et al., 2019).
For image enhancement, Local Histogram Equal-
ization (LHE)(Celik, 2012) is one of the most widely
used techniques. The entire image is encompassed in
a window in LHE, with the histogram locally equal-
izing the actual pixel inside the given window. Be-
cause of the complexity and variety of window sizes,
several algorithms have been created to improve the
efficiency of HE. In 1997, Kim developed intensity
preserving bi-histogram equalization (BBHE) to ad-
dress HE’s mean brightness shifting issues. The in-
put low contrast image’s histogram is divided in half
by the average pixel intensity, and the sub-histograms
are equalized separately by BBHE (Kim, 1997).
Following Brightness preserving BHE, Dualistic
Sub-Image HE (DSIHE) (Wang et al., 1999) was de-
veloped, which distinguishes the histogram of the
input image by using the median value rather than
the mean value. Recursive Mean-Separate Histogram
Equalization (RMSHE) and Recursive Sub-Image
Equalization (RSIHE) have been developed as gener-
alization schemes for BBHE and DSIHE. RSIHE and
RMSHE produce 2
r
sub-histograms by recursively di-
viding the input histogram using the mean and me-
dian values (Sim et al., 2007). The optimum value
for ’r’ is the most difficult to describe. When ’r’ is
high, the resultant image will be nearly identical to
the original image, with no enhancement (Vijayalak-
shmi et al., 2020).
The algorithms listed above are primarily con-
cerned with preserving mean brightness. By incorpo-
rating clipping limits into their transformation feature,
later BHE algorithms were designed to minimize over
enhancement. These cutting limits are the quantitative
parameters derived from the input image. (Tang and
Isa, 2014). The feature-preservation BHE (CEF) pro-
cess was maintained the image features through a con-
trast improvement. It employs gamma transformation
to reduce the effect of over enhancement. It removes
histogram pits using histogram addition (Wang and
Chen, 2018).
Adaptive cutting limit and detail improving modi-
fications are employed in edge enhancing BHE (Tang
and Isa, 2014). Cutting limits are determined from
the entropy values of the segmented histogram, and
detail improvement is achieved by measuring the di-
rected filter’s linear coefficients for each pixel in the
input image. Finally, the filter coefficients are used to
create the enhanced image (Mun et al., 2019).
Due to the inability to use dynamic grayscale
in the above-mentioned bi-histogram methods, two
dimesional histogram-based methods generate im-
ages with high contrast. The intensity values
with their spatial positions are employed in two
-dimensional histogram-based techniques. Two-
dimensional HE (2DHE) utilizes the correctly cho-
sen spatial neighbourhood’s contextual information to
produce an adequately enhanced image (Celik, 2012).
However, a large number of trials are required to
achieve the proper size of the neighbourhood. The
transformation function of spatial entropy-based con-
trast enhancement (SECE) utilizes the spatial loca-
tion along with the number of occurrences that helps
the pixels to occupy the entire dynamic range (Ce-
lik, 2014). However, it has no power over the rate of
enhancement, which may result in over-enhancement
(Chen et al., 2019)(Cai et al., 2018). Residual spa-
tial entropy-based enhancement (RESE) method uses
non-linear mapping based on residual entropy for
contrast enhancement, which may result in a minor
improvement in contrast (Celik and Li, 2016).
Joint histogram equalization (JHE) has solved the
challenges of the RESE. The joint histogram (JH)
measures the gray values and information in the spa-
tial neighborhood that occur together (Agrawal et al.,
2019).
As shown in the above discussion, bi-histogram
approaches do not use the entire complex grayscale,
resulting in minor contrast change. On the other
hand, the two-dimensional histogram-based methods
use the whole of dynamic grayscale, but the inten-
sity distribution after enhancement is not standard-
ized. In the processed picture, this results in noisy
appearances.
Most of the authors have used unprocessed images
for Covid-19 classification by utilizing various pre-
trained networks such as AlexNet, Googlenet, VGG-
16, and VGG-19, etc.,(Nath et al., 2020). However,
the uneven distribution of intensities and fewer inten-
sity values lead to poor discrimination of infected and
uninfected regions in the CT scan images. Therefore,
it may result in decreasing the classification accuracy
of the Covid-19 diagnosis. Nevertheless, images can
be pre-processed for differentiating the infected re-
gions from uninfected regions to overcome the prob-
lem,(Jeevakala and Therese, 2018). So in this paper, a
gradient-based contrast enhancement is suggested for
pre-processing the CT scan Covid images.
The main goal of the GCE technique is to improve
contrast while reducing artifacts, maintaining edges,
and avoiding over-enhancement. The following are
the critical contributions made in this paper:
1. The innovative gradient-based contrast enhance-
ment technique approaches multiscale analysis by
extracting image information at multiple levels of
CT scan images.
SIGMAP 2021 - 18th International Conference on Signal Processing and Multimedia Applications
88
2. A filter is used to detect essential image informa-
tion and to prioritize pixel differences with their
neighbours.
3. Reference and non-reference quantitative metrics
verify subjective analysis of GCE technique’s
supremacy over traditional state-of-the-art algo-
rithms.
4. To analyse the performance of Gradient based en-
hancement algorithm in the field of machine in-
telligence, pre-trained AlexNet is used for clas-
sification of enhanced Covid images against the
unprocessed Covid images.
The remainder of the paper is structured as follows:-
In Section 2, gradient based enhancement methodol-
ogy and the network used for their classification are
discussed. Experimental analysis of GCE technique
in comparison with some of the existing contrast en-
hancement algorithms and the assessment of GCE in
the field of machine vision are summarized in Section
3. Finally, Section 4 concludes the paper.
2 METHODOLOGY
This section describes the classification of Covid-19
from CT images of the chest by using a pre-trained
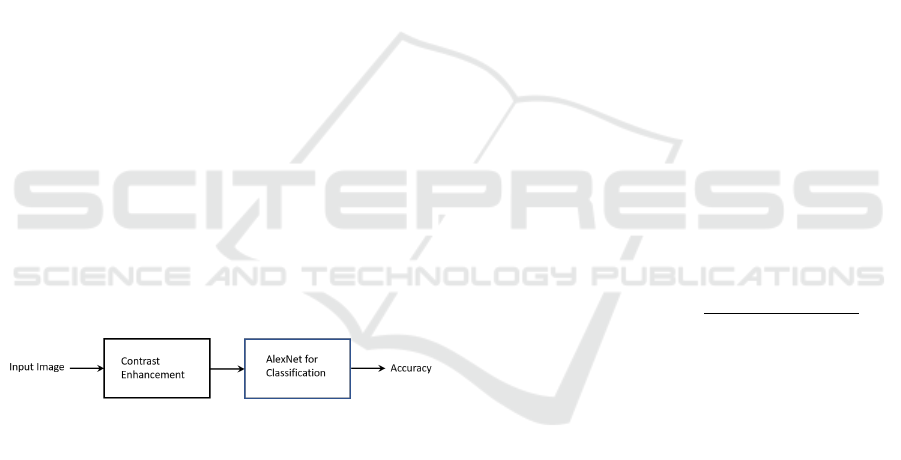
AlexNet followed by a pre-processing stage. The pro-
posed method is represented in Figure 1. First, the im-
ages are pre-processed by the gradient-based contrast
enhancement algorithm. Then, the enhanced images
are fed to the pre-trained network for classification.
Figure 1: Block diagram for the assessment of contrast en-
hancement techniques.
The detail description of the blocks represented in
Figure 1 is described in the following sub-sections.
2.1 Gradient based Contrast
Enhancement
Gradient based contrast enhancement is divided into
four sections: gradient image calculation, joint his-
togram computation, discrete function enumeration,
and equalized histogram determination using a map-
ping function.
The following two measures are used to create the
gradient image:
1. To obtain edge information, a filter is employed at
multiple scales of the low contrast image.
2. The geometric mean value obtained from multi-
scale filtered images results in a gradient image.
The decomposition of low contrast input image I
is obtained by employing the Gaussian pyramid. The
dimension of the input image is M×N. In each sub-
sequent image, the decimation process is utilized by
halving the sampling rate. Thus, for each decomposi-
tion, a set of pictures in multi-scale will be available,
including the original image.
Convoluting a 5×5 mask with the bottom level
image in the pyramid yields the first level decom-
posed image(Burt and Adelson, 1983). Thus, the
mask is denoted as:
m = [0.25 − 0.5a,0.25,a,0.25,0.25 − 0.5a] (1)
m(0) = a; m(1) = m (−1) = 0.25;
m(2) = m (−2) = 0.25 − 0.5a;
(2)
where a is considered as 0.375. The 2-D coefficients
are generated by
m(k, l) = m (k).m (l) (3)
To obtain the next level (l − 1) image, the 2-D
coefficients are convoluted with the input image and
decimated by a factor of 2
l−1
. It is denoted by:
J
l−1
=
2
∑
i=−2
2
∑
j=−2
m(i, j).J
l
(x + i,y + j ) (4)
Images obtained from the pyramid are filtered by
a dark pass filter (Wu et al., 2017). It is defined as:
f (x,y) = −
∑
x
0
,y
0
∈N(x,y)
min
J
l
(x,y) − J
l
x
0
,y
0
L − 1
,0
(5)
where N (x,y) denotes the 4-neighbours of the centre
pixel (x, y) and L repesents the highest pixel inten-
sity value of the input image. The gradient image is
obtained by taking the geometric mean of filtered out-
puts.
G(x,y) =
l
∏
i=1
max(U ( f (x, y)) ,ε)
!
1
/
l
(6)
where U (.) denotes the upsampling by factor of 2
l−1
.
The joint occurrence of the intensities is measured
using the input image’s distinct pixel values and the
gradient image’s distinct pixel values.
Jh =
{
Jh (p,q) ; 1 ≤ p ≤ P,1 ≤ q ≤ Q
}
(7)
where P and Q denotes the number of distinct gray
values of the low contrast and the gradient image, re-
spectively.
Jh (p,q) =
{
count; f or I (x,y) = p & G (x, y) = q
}
(8)
Novel Pre-processing Stage for Classification of CT Scan Covid-19 Images
89

From the joint occurrence, the CDF is calculated as
F (p, q) =
p
∑
i=0
q
∑
j=0
Jh (i, j) (9)
where F (p,q) represents the CDF. The CDF is used
to create a transformation which is given below:
Jh
tr
(p,q) =
j
((L−1)×(F(p,q)−F (p,q)
m
))
/
(M×N)−1
k
(10)
where
b
.
c
rounds the values to the closest integer,
Jh
tr
(p,q) represents the equivalent pixel value which
substitutes the given value whenever I (x,y) = p &
G(x,y) = q, F(p, q)
m
represents the smallest value of
the CDF.
The mapping fuction is used to result in the en-
hanced image, which is denoted as:
JH
tr
=
{
Jh
tr
(p,q); 1 ≤ p ≤ P,1 ≤ q ≤ Q
}
(11)
Finally, an improved image is created by substitut-
ing equivalent intensities for the specified intensities
from JH
tr
, that comprises all equivalent intensities
based on potential input and gradient image joint oc-
currences.
2.2 Image Classification
The enhanced images are fed to the pre-trained
AlexNet for image classification. The basic building
blocks of the network are convolutional, max pool-
ing and fully connected layers. It has eight learnable
layers. ReLU is used as an activation function in all
layers. Output layer uses softmax activation. In this
work, the tune-able parameters like mini batch size,
learning rate and the number of epochs are chosen as
32, 1e-5 and 20, respectively.
3 RESULTS AND DISCUSSION
The improved visual quality of images is required in
the medical imaging system for diagnosing abnormal-
ities in any part of the human body. It is possible with
the proper contrast enhancement techniques. There-
fore, the image’s properties, such as contrast change,
artifacts, and over enhancement, are considered when
comparing the image’s perceived efficiency.
The gradient-based contrast enhancement ap-
proach discussed in Section 2 is tested on CT Covid
image database (Zhao et al., 2020) which consists
of 349 Covid and 397 non-Covid CT images col-
lected from 216 patients. The efficacy of the GCE
algorithm is analysed and compared to the methods
RESE (2016), CEF (2018), EEBHE (2019), and JHE
(2019) using qualitative and quantitative research.
The qualitative analysis focuses on visual inspection,
which provides information on annoyances, irregular
enhancement, and over enhancement. Contrast im-
provement index (CII) for quantifying the local con-
trast improvement, discrete entropy (DE) for measur-
ing the information details, Kullback-Leibler distance
(KL-Distance) for measuring the uniform distribution
are some of the output metrics used in quantitative re-
search. The qualitative and quantitative analyses, as
well as the findings, have been addressed in this sec-
tion.
3.1 Visual Analysis
The qualitative analysis focuses on visual inspec-
tion, providing information on annoyances, irregu-
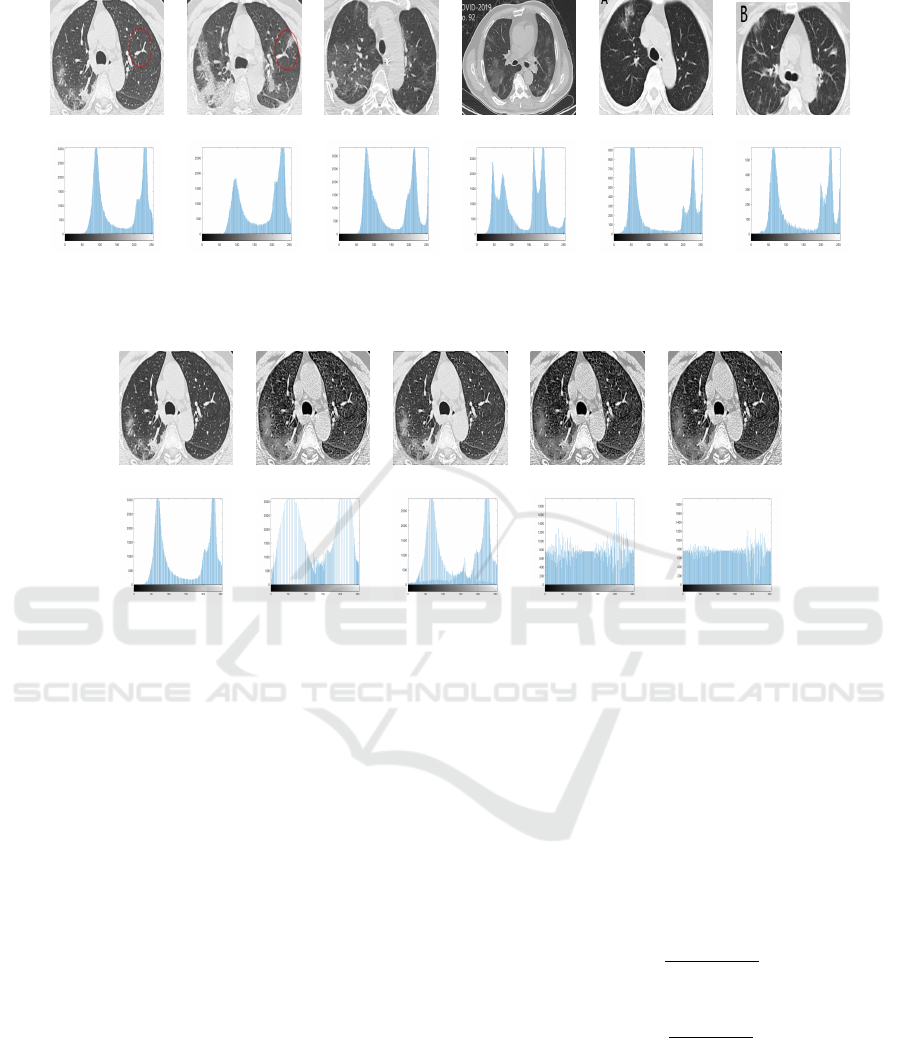
lar enhancement, and over enhancement. Figure 2
shows some examples of images taken from the Covid
dataset and their histograms. The intensity levels are
spread in the histogram of the sample images in a
small area in the complex grayscale with an irregular
spread. The pixel intensities occupy a narrow interval
in the entire grayscale. It creates a minimal differ-
ence between the various objects in the image, which
results in low contrast.
Figure 3 to Figure 4 display the improved images
obtained by different methods. For the sample image,
Figure 3 displays the contrast improved images and
their respective histograms obtained through various
methods of the sample image
0
I1
0
.
The enhanced images produced by the RESE tech-
nique are shown in Figure 3(a) and the first column of
Figure 4. RESE produces an improved image with
less perceived contrast in clarity, as seen in the fig-
ures. The edge information is retained after process-
ing, but the histogram indicates that the improved im-
age has the same range of pixel intensities as the im-
age input, leading to minor contrast improvement than
other techniques. Figure 3(b) and the second column
of Figure 4 depicts the enhanced images of CEF. The
local regions of images have been improved in these
figures. But, the presence of histogram pits produces
artifacts near the edges.
The EEBHE method has been proposed to im-
prove edge information. Due to the directed filtering
used in the EEBHE process, it is apparent from the
Figure 3(c) and third column of Figure 4 that EEBHE
produces enhanced images with improved edge de-
tails. However, since the resulting images use the full
grayscale dynamic range with uneven distribution, it
can result in minor contrast enhancement in the en-
hanced image’s local area.
JHE provides a high contrast picture, which can
SIGMAP 2021 - 18th International Conference on Signal Processing and Multimedia Applications
90
(a) (b) (c) (d) (e) (f)
(g) (h) (i) (j) (k) (l)
Figure 2: Sample images: (a) I1, (b) I2, (c) I3, (d) I4, (e) I5, (f) I6, (g) histogram of I1, (h) histogram of I2, (i) histogram of
I3, (j) histogram of I4, (k) histogram of I5, and (l) histogram of I6.
(a) (b) (c) (d) (e)
(f) (g) (h) (i) (j)
Figure 3: Contrast enhanced images of I1: (a) RESE, (b) CEF, (c) EEBHE, (d) JHE, (e) GCE, (f) histogram of RESE, (g)
histogram of CEF, (h) histogram of EEBHE, (i) histogram of JHE, and (j) histogram of GCE.
be seen from Figure 3(d) and the fourth column of
Figure 4. It is because it makes use of the entire com-
plex grayscale range. However, due to average spatial
neighbourhood information in the transformation, the
intensities are not evenly distributed, and the resultant
image is smoothed.
Figure 3(e) and the fifth column of Figure 4 dis-
play the enhanced images resulted from the GCE
technique. Due to the use of multi-scale analysis and
a dark pass filter, the GCE approach produces an im-
age with increased contrast and no loss of informa-
tion data. The edge information is retained in the en-
hanced image. It can be seen in the enhanced im-
ages’ artifact-free edges. In comparison to the meth-
ods available in the literature, the GCE technique, ac-
cording to the qualitative review, produces enhanced
and artifact-free images.
3.2 Quantitative Analysis
Qualitative analysis resolves the potential of the en-
hancement methodology that human eyes justify.
Quantitative analysis may be used to quantify the effi-
cacy of the enhancement algorithms. A performance
indicator accurately and automatically estimates an
image’s consistency. A perfect objective measure
should be able to represent the subjective measure’s
quality predictions.
3.2.1 Contrast Improvement Index (CII)
It is possible to calculate the local contrast using CII
between the input and output images. (Vijayalakshmi
and Nath, 2021b; Zeng et al., 2004)
CII =
M (C
loc
(J))
M (C
loc
(I))
(12)
where
C
loc
=
max − min
max + min
(13)
where max and min represent the high and low inten-
sity values in a 3×3 window respectively. Higher CII
indicates better contrast improved image.
3.2.2 Discrete Entropy
Discrete entropy measures the degree of randomness
and the amount of visible information present in the
Novel Pre-processing Stage for Classification of CT Scan Covid-19 Images
91
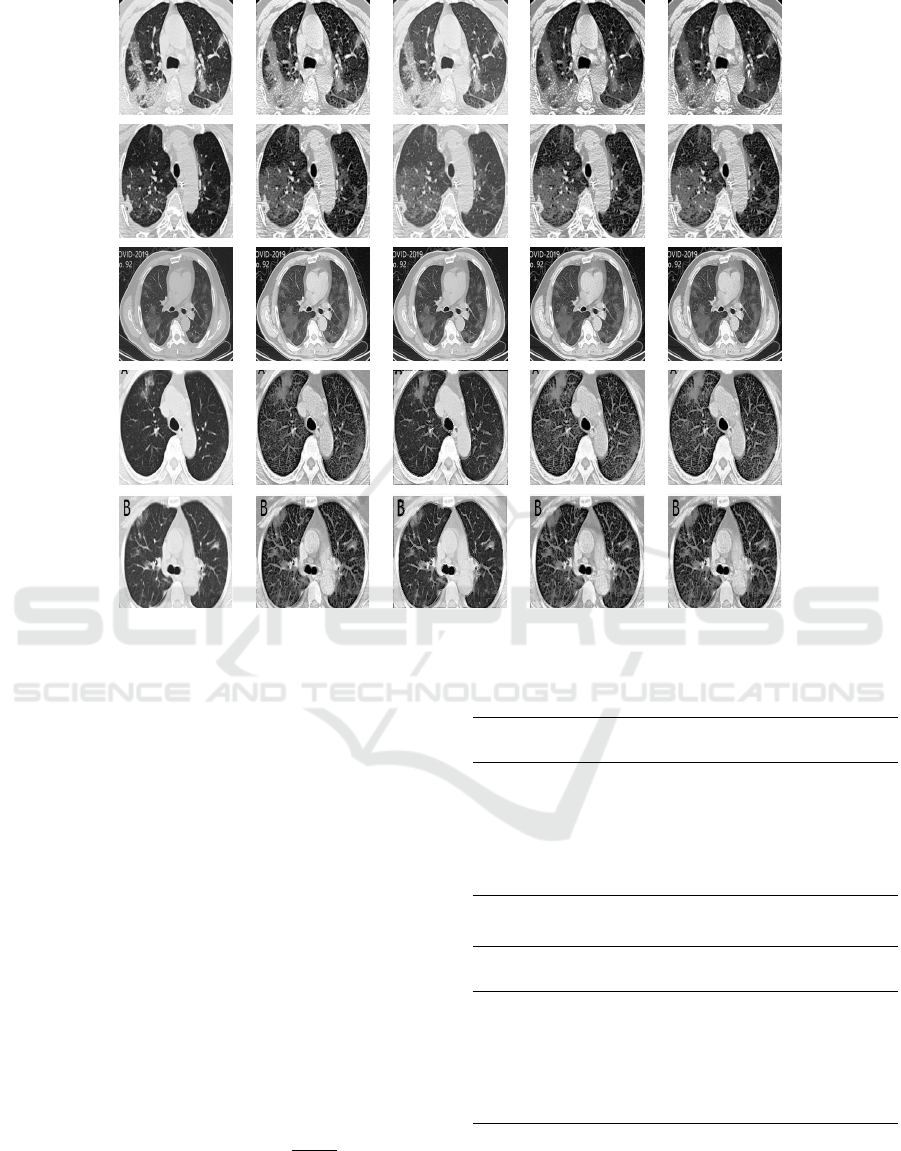
Figure 4: Contrast enhanced images obtained by various methods. First column: RESE; second column: CEF; third column:
EEBHE; fourth column: JHE; and fifth column: GCE.
image (Shannon, 1948). A greater entropy value de-
fines good information for the image. It is determined
by:
E(I) = −
P
∑
l=1
p(i
l
)log
2
p(i
l
) (14)
where p(i
l
) is the probability of the pixel value i
l
. P
indicates the total number of gray values.
3.2.3 KL-Distance
The flatness of the intensity spread in the contrast im-
proved image is measured by the difference between
the enhanced image’s gray level distribution and
the uniform distribution (Vijayalakshmi and Nath,
2021a). It is calculated using the Kullback-Leibler
(KL) distance, as shown in equation (15). The lower
KL-distance represents a uniform spread of pixel in-
tensities.
KL(p,q) =
∑
∀k
p(y
k
)log
2
p(y
k
)
q(y
k
)
(15)
where p (y
k
) and q (y
k
) denote the spread of the con-
trast improved image and uniform distribution, re-
spectively.
Table 1: CII values of contrast enhancement technique.
Methods/
Images
RESE CEF EEBHE JHE GCE
I1 1.3 2.83 1.84 2.89 3.03
I2 1.7 2.5 1.23 2.8 2.99
I3 1.9 2.6 1.15 2.6 2.94
I4 1.13 1.87 1.69 1.6 1.96
I5 1.02 1.96 1.67 2.01 2.19
I6 1.00 1.97 1.71 1.96 2.10
Table 2: DE values of contrast enhancement technique.
Methods/
Images
RESE CEF EEBHE JHE GCE
I1 7.01 6.8 7.21 7.93 7.96
I2 7.10 6.84 7.17 7.8 7.97
I3 7.04 6.83 7.12 7.88 7.95
I4 7.24 7.02 7.37 7.70 7.98
I5 6.92 6.72 6.97 7.65 7.97
I6 6.90 6.85 7.2 7.67 7.94
All of the sample images’ CII metric values are
mentioned in Table 1. It shows that GCE produces
high CII values as compared to the other approaches.
This is because the GCE approach uses neighbour-
SIGMAP 2021 - 18th International Conference on Signal Processing and Multimedia Applications
92

Table 3: KL values of contrast enhancement technique.
Methods/
Images
RESE CEF EEBHE JHE GCE
I1 0.08 0.07 0.66 0.05 0.028
I2 0.04 0.05 0.17 0.06 0.02
I3 0.09 0.08 0.44 0.08 0.04
I4 0.28 0.66 0.24 0.27 0.17
I5 0.92 0.56 0.59 0.34 0.146
I6 0.93 0.46 0.42 0.53 0.053
Table 4: Average metric values for various methods of
Covid database.
Methods/
Metrics
RESE CEF EEBHE JHE GCE
CII 1.15 1.82 1.48 2.07 2.14
DE 6.24 6.07 6.33 7.16 7.27
KL 0.3 0.12 0.2 0.15 0.05
hood details in the mapping function to help increase
the image’s contrast in the surrounding area. As seen
in the qualitative analysis, the entities are differenti-
ated due to increasing contrast in the small areas.
Table 2 displays the DE values for the sample im-
ages. The GCE method results in a higher entropy
value than other related methods, as observed. It is
due to the use of edge information in the discrete func-
tion formulation.
Table 3 shows the KL-distance of different en-
hancement techniques. In comparison to the other
methods, these results indicate that the proposed ap-
proach distributes intensities equally. Furthermore, it
demonstrates that the GCE algorithm generates an im-
proved image with high contrast in the absence of his-
togram spikes.
The GCE algorithm and methods outlined in the
literature were tested on the entire database to im-
prove the accuracy of the evaluation. For the whole
database, the average values of the output metrics are
tabulated in Table 4. The Table shows that the GCE
algorithm improves the contrast while preserving the
information details with uniform distribution of inten-
sity values compared to the methods discussed in the
literature.
Table 5: Classification accuracy values for Covid database.
Methods
Accuracy
(in %)
Unprocessed 73.32
RESE 75
CEF 74
EEBHE 76.04
JHE 78.72
GCE 80.6
3.2.4 Assessment of GCE in Machine
Intelligence
A pre-trained AlexNet is used to investigate the ef-
ficiency of a gradient-based contrast enhancement al-
gorithm in the field of machine intelligence. For covid
detection, the CT scan Covid and non-Covid images
are used.
The assessment is carried out in the following two
phases. In the first phase, the AlexNet is trained and
tested with the images without enhancement. For
training, 80% of Covid images and non-Covid images
are provided to the network. The remaining 20% of
images from the two classes are tested. As a result,
the network offers classification accuracy of 73% in
images without enhancement.
In the second phase, the network is trained and
tested with 80% and 20% of the pre-processed im-
ages, respectively. The contrast enhancement algo-
rithms discussed in the literature and the gradient-
based contrast enhancement method are used as a pre-
processing stage. Table 5 shows the classification ac-
curacy of unprocessed and enhanced Covid-19 im-
ages of various methods. It is inferred from Table
5 that enhanced images help in improving the clas-
sification accuracy. It is observed that with GCE, the
classification accuracy is 80.62%, which is the high-
est value when compared to the other techniques dis-
cussed in the literature. Therefore, it may be con-
cluded that the GCE algorithm aids in the improve-
ment of classification accuracy of CT scan Covid-19
images.
4 CONCLUSIONS
In this paper, a pre-processing stage for improving
the classification accuracy of Covid-19 CT scan im-
ages is described. It uses gradient-based contrast
enhancement (GCE) as a pre-processing stage. In
GCE, the mapping function uses the joint distribution
of edge information and intensity values to map the
pixel values to fill the complete grayscale with a uni-
form spread. It has been shown that the method can
increase contrast by reducing histogram peaks and
pits, resulting in artifact-free contrast improved im-
ages. The method outperforms increasing contrast,
avoiding loss of information, and ensuring a consis-
tent distribution of gray levels, which can be seen in
the histogram and measured using the KL-distance.
Furthermore, a pre-trained AlexNet is used to investi-
gate the efficacy of a gradient-based contrast enhance-
ment algorithm. After increasing the contrast of the
images using GCE, the classification accuracy is im-
Novel Pre-processing Stage for Classification of CT Scan Covid-19 Images
93

proved from 73.32% to 80.62%, according to the re-
sults. Hence, it may be concluded that the GCE al-
gorithm can be used as a pre-processing stage for im-
proving the classification accuracy of CT scan Covid-
19 images.
ACKNOWLEDGEMENTS
The work has been supported by the department of
ECE, National Institute of Technology Puducherry,
India.
REFERENCES
Agrawal, S., Panda, R., Mishro, P., and Abraham, A.
(2019). A novel joint histogram equalization based
image contrast enhancement. Journal of King Saud
University - Computer and Information Sciences.
Burt, P. and Adelson, E. (1983). The Laplacian pyramid as
a compact image code. IEEE Transactions on Com-
munications, 31(4):532–540.
Cai, J., Gu, S., and Zhang, L. (2018). Learning a deep single
image contrast enhancer from multi-exposure images.
IEEE Transactions on Image Processing, 27(4):2049–
2062.
Celik, T. (2012). Two-dimensional histogram equaliza-
tion and contrast enhancement. Pattern Recognition,
45(10):3810–3824.
Celik, T. (2014). Spatial entropy-based global and local
image contrast enhancement. IEEE Transactions on
Image Processing, 23(12):5298–5308.
Celik, T. and Li, H.-C. (2016). Residual spatial entropy-
based image contrast enhancement and gradient-based
relative contrast measurement. Journal of Modern Op-
tics, 63(16):1600–1617.
Chen, B.-H., Wu, Y.-L., and Shi, L.-F. (2019). A fast im-
age contrast enhancement algorithm using entropy-
preserving mapping prior. IEEE Transactions on Cir-
cuits and Systems for Video Technology, 29(1):38–49.
Chi, J., Zhang, Y., Yu, X., Wang, Y., and Wu, C. (2019).
Computed tomography (ct) image quality enhance-
ment via a uniform framework integrating noise es-
timation and super-resolution networks. Sensors
(Basel), 19(15):1–20.
Jeevakala, S. and Therese, A. B. (2018). Sharpening en-
hancement technique for mr images to enhance the
segmentation. Biomedical Signal Processing and
Control, 41:21–30.
Kim, Y.-T. (1997). Contrast enhancement using brightness
preserving bi-histogram equalization. IEEE Transac-
tions on Consumer Electronics, 43(1):1–8.
Malik, S. H., Lone, T. A., and Quadri, S. M. K. (2015).
Contrast enhancement and smoothing of ct images for
diagnosis. In 2015 2nd International Conference on
Computing for Sustainable Global Development (IN-
DIACom), pages 2214–2219.
Mun, J., Jang, Y., Nam, Y., and Kim, J. (2019). Edge-
enhancing bi-histogram equalisation using guided im-
age filter. Journal of Visual Communication and Im-
age Representation, 58:688–700.
Nath, M. K., Kanhe, A., and Mishra, M. (2020). A novel
deep learning approach for classification of covid-19
images. In 2020 IEEE 5th International Conference
on Computing Communication and Automation (IC-
CCA), pages 752–757.
Shannon, C. E. (1948). A mathematical theory of communi-
cation. Bell System Technical Journal, 27(3):379–423.
Sim, K., Tso, C., and Tan, Y. (2007). Recursive sub-image
histogram equalization applied to gray scale images.
Pattern Recognition Letters, 28(10):1209–1221.
Tang, J. R. and Isa, N. A. M. (2014). Adaptive image en-
hancement based on bi-histogram equalization with a
clipping limit. Computers and Electrical Engineering,
40(8):86–103.
Vijayalakshmi, D. and Nath, M. K. (2021a). A novel
contrast enhancement technique using gradient-based
joint histogram equalization. Circuits Syst Signal Pro-
cess, pages 1–39.
Vijayalakshmi, D. and Nath, M. K. (2021b). Taxonomy of
performance measures for contrast enhancement. Pat-
tern Recognition and Image Analysis, 30:691–701.
Vijayalakshmi, D., Nath, M. K., and Acharya, O. P. (2020).
A comprehensive survey on image contrast enhance-
ment techniques in spatial domain. Sensing and Imag-
ing, 21:1–40.
Wang, X. and Chen, L. (2018). Contrast enhancement using
feature-preserving bi-histogram equalization. Signal,
Image and Video Processing, 12(4):685–692.
Wang, Y., Chen, Q., and Zhang, B. (1999). Image en-
hancement based on equal area dualistic sub-image
histogram equalization method. IEEE Transactions
on Consumer Electronics, 45(1):68–75.
Wu, X., Liu, X., Hiramatsu, K., and Kashino, K. (2017).
Contrast-accumulated histogram equalization for im-
age enhancement. In 2017 IEEE International Confer-
ence on Image Processing (ICIP), pages 3190–3194.
Zeng, P., Dong, H., Chi, J., and Xu, X. (2004). An approach
for wavelet based image enhancement. In 2004 IEEE
International Conference on Robotics and Biomimet-
ics, pages 574–577.
Zhao, J., Zhang, Y., He, X., and Xie, P. (2020). Covid-
ct-dataset: a ct scan dataset about covid-19. arXiv
preprint arXiv:2003.13865.
SIGMAP 2021 - 18th International Conference on Signal Processing and Multimedia Applications
94
