
Forecasting Stock Market Trends using Deep Learning on Financial
and Textual Data
Georgios-Markos Chatziloizos, Dimitrios Gunopulos
and Konstantinos Konstantinou
Department of Informatics and Telecommunications, National and Kapodistrian University of Athens, Athens, Greece
Keywords: Technical Analysis, Sentiment Analysis, Machine Learning, Stock Market.
Abstract: Stock market research has increased significantly in recent years. Researchers from both economics and
computer science backgrounds are applying novel machine learning techniques to the stock market. In this
paper we combine some of the techniques used in both of these fields, namely Technical Analysis and
Sentiment Analysis techniques, to show whether or not it is possible to successfully forecast the trend of the
stock price and to what extent. Using the four tickers AAPL, GOOG, NVDA and S&P 500 Information
Technology, we collected historical financial data and historical textual data and we used each type of data
individually and in unison, to display in which case the results were more accurate and more profitable. We
describe in detail how we analysed each type of data, how we used it to come up with our results.
1 INTRODUCTION
Many people have strived for years to recognize the
pattern the stock market works. Due to its volatile
nature, all those involved in stock trading, face the
possibility of losing. Stock prices are rising and
falling and trends are constantly changing, and many
who try to predict their behaviour often end up losing
their savings. For this reason, many researchers have
tried to use technology, computational and machine
learning models, to help investors achieve greater
returns. To feed these models, researchers need to
acquire the right data.
To identify all the factors that affect the stock
market, researchers collect information and
categorize it into two general types: hard and soft.
Hard information (e.g. closing stock prices) can be
easily presented in numbers or numeric value. Soft
information (e.g. news articles, tweets) is more
abstract and can also be represented numerically, but
in this case we have information loss. The inherent
differences make these two types applicable to
different projects because they can produce better
results than each other on different topics. In (Liberti
and Petersen, 2019) the authors explain in detail
exactly what each type of information is and their
differences in the banking and financial world.
With the rise of machine learning, hard
information (numerical/economical data) has been
used to predict the stock market movements.
Different machine learning techniques exist that
handle this type of data and predict stock market
prices or trends (Chong, Han and Park, 2017),
(Fischer and Krauss, 2018), (Long, Lu, and Cui
2019), (Zhong and Enke, 2019), (Vignesh, 2020),
(Nabipour, Nayyeri, Jabani, Mosavi and Salwana,
2020). The reader is also referred to (Ferreira,
Gandomi, and Cardoso, 2021) for a recent survey.
The question is, whether both hard and soft data
are useful in forecasting stock market prices and
trends. Τhe loss of information when handling soft
data, makes it difficult using this type of data to build
prediction models, and discourages the use of social
media to massively acquire soft information for the
stock market. But as current situation shows, with
many stock tickers and companies having a massive
change in their stock price due to the collective action
of many internet users collaborating through social
networks, the soft data from such sources, also called
sentimental data, could be proved very useful.
Sentiment analysis uses textual data to analyze
people's feelings and moods towards an entity, such
as a stock ticker, to evaluate how negative or positive
their opinions are (Sun, Lachanski, and Fabozzi,
2016), (Shapiro, Sudhof and Wilson, 2017).
There are research works who have tried to use
textual/sentimental data for predicting stock market
movements. In (Pagolu, Reddy,Panda, Majhi, 2017),
the authors apply sentiment analysis and supervised
Chatziloizos, G., Gunopulos, D. and Konstantinou, K.
Forecasting Stock Market Trends using Deep Learning on Financial and Textual Data.
DOI: 10.5220/0010618801050114
In Proceedings of the 10th International Conference on Data Science, Technology and Applications (DATA 2021), pages 105-114
ISBN: 978-989-758-521-0
Copyright
c
2021 by SCITEPRESS – Science and Technology Publications, Lda. All rights reserved
105

machine learning methods to tweets and analyze the
correlation between stock market movements and
sentiments in tweets. In (Tabari, Seyeditabari, Peddi,
Hadzikadic, Zadrozny, 2019) first, a stock market
related tweet dataset and labelled, then various deep
learning models are compared and finally, a LSTM
model is introduced which outperformed all the other
models. In (Batra and Daudpota, 2018) the authors
collected sentiment data and stock price market data
and built a SVM models for predicting next day’s
stock movements.
Taking all of these into consideration, in this
paper we present our methods to contribute to the
direction of using both numerical/economical data
and textual/sentimental data, analysing them and
applying machine/deep learning techniques in order
to successfully predict stock prices and trends.
Specifically, we apply deep learning/machine
learning methods on both types of data, with the
ultimate goal of not only predicting stock market
trends, but also understanding how Technical
Analysis of a stock can be strengthened by applying
Sentiment Analysis on it. We have employed three
deep/machine learning methods (Goodfellow,
Bengio, and Courville, 2016), i.e., Long Short-Term
Memory (LSTM), k-nearest neighbors (KNN) and
Decision Trees and we applied them on the following
three different sets of historical data collected for a
period of twenty years (a) numerical/economical data
such as stock closing prices, technical analysis
indicators, labels, etc. (b) sentimental data e.g. scores
computed using lexical methodologies on textual data
collected from Twitter and labels (c) combined data
that include all the above data in sets (a) and (b).
Our experiments were based on data of four stock
tickers: AAPL, GOOG, NVDA and S&P 500
Information Technology. The data concern
numerical/economical data collected for a period of
twenty years and textual data (about 29,000 tweets for
each one of the above tickers) collected for a period
of eight years. The results show that the LSTM
method works better than the other machine learning
methods. In particular, the LSTM method on
numerical/economical data offers 2.5 times more
profit on average than the Buy and Hold strategy (the
profit of the passive investor). Also, Sentiment
analysis turned out to have potential for the future, as
it was profitable, and sometimes a better solution than
a passive investment. It seems that Sentiment analysis
can give better results by including more quality data
such as news titles and articles, and by increasing the
volume of tweets acquired.
The structure of this paper is as follows: Section 2
presents the soft information we used, how we
analysed and used it. Section 3 presents the technical
analysis indicators that are employed. Section 4
discusses the data that were fed in the deep/machine
learning methods and the remaining settings of the
application. Section 5 presents the results that were
derived and Section 6 concludes the paper.
2 SENTIMENT ANALYSIS
The stock market is essentially a place where anyone
can buy and sell shares of companies. This means that
people affect the prices with their demand and needs,
when buying stock or products of a company, or even
when using its services. But people can affect the
market even when they don’t actively participate in
transactions. In the case that a consumer buys or sells
with high frequency or in high numbers, this
increased or more confident activity affects the
market. A consumer who is not participating or
expresses concerns also affects the market. When
creating or spreading rumours, expressing their
opinions and ideas about a topic, people can still
influence the market, especially when they have a
platform where they can reach a range of other
people. News articles and statements from companies
whether it is for financial reasons or not, they too have
a part in shaping the prices.
The ability to greatly change the shape of the
market from simple words or statements is evident
when a high profile person expresses an opinion on
an issue. What is not clear is how an everyday person
from the financial world or not, can influence the
stock market through expressing their opinion and to
what extent. This is the focus of our sentimental
analysis.
In this article we aimed to investigate the impact
of Twitter and how tweets accurately reflect the true
consumer sentiment. We chose Twitter because it has
been proven by many researchers to be a powerful
tool for predicting the public's sentiments on certain
topics and important issues (Ussama, Soon,
Vijayalakshmi and Jaideep, 2017). Twitter also
provides objective information, because users who
post tweets come from any background or social
class. Also, tweets are small when compared to other
corpora of text (such as articles from news networks)
and the number of tweets one can collect in a short
period of time is much higher.
To complement these posts and results, we also
used the Consumer Sentiment Index published by the
University of Michigan. The tweet sentiment analysis
process is divided into three stages which will be
presented in the following three paragraphs.
DATA 2021 - 10th International Conference on Data Science, Technology and Applications
106

2.1 Data Collection
We selected three corporate giants for our research,
Apple (AAPL), Google (GOOG) and Nvidia
(NVDA) and the ticker of S&P 500 Information
Technology Sector. As our research showed that the
tweets of the early years were not of the same quality
as those of the later years, we decided that the tweets
would be collected from 2012 to 2019. Collecting ten
English tweets, daily from January 1, 2012 to
December 31, 2019, we have collected about 29,000
tweets for each of the above corporations.
At this point we must mention that the choice of
these companies is also due to the quality of their
tweets. We avoided collecting tweets from specific
companies and their hashtags (#), which could lead to
"noisy" data, which means that the content of the
tweets was not relevant to the topic of our research.
For example, tweets about companies with excessive
references to their products instead of references to
the stock or financial details of the companies.
The tweets, when retrieved, were placed in
datasets, each for the company it referred to. Each
contained the date and textual data with which the
analysis could be continued.
2.2 Text Stemming
For each dataset we removed links and other
unnecessary elements from each tweet. What we were
left with were the most significant words, with stop
words being filtered out, so that we can focus on the
actual information. The main words needed were left
as is. After cleaning each tweet, we tokenized the
words and stemmed them, using the Snowball
Stemmer by Martin Porter. With this stemmer we
stripped each word from suffixes and we kept it at its
basic form. This is done so that the word can be
evaluated from the lexicons for better and more
accurate evaluation.
Words were left at the same order of the original
tweet so that they can be considered not only
individually, but in the context of the text, and
possibly in unison. We also tried to have a better
understanding of the stemming results, and we found
out words most frequently used. The results were with
many economic terms, like “bearish” (meaning stock
price fall) or “bullish” (meaning stock price rise)
being used. At this point we were also able to identify
problems, like realizing if the tweets were addressing
the company and its stock or other unrelated subjects.
2.3 Evaluation
The evaluation step was possibly the most crucial
point of the sentiment analysis. A tweet can be of
positive, negative or neutral sentiment. To decide
what category each tweet falls in, we employed the
lexical methodology, which uses a dictionary to
represent each word as a number. This number
represents the sentiment of the word which can be
positive, negative or neutral. As the summation of
these numbers gets more positive or negative, the
sentiment value also increases, meaning that the user
posting the tweet is either very happy or very
unhappy. We aggregate these weights, and at the end,
the sum of the numbers represents the general
sentiment of the tweet. This is the result of this
methodology and the number we end up with is used
then to measure the overall outcome.
For our approach we used three dictionaries: (a)
The VADER Lexicon (Hutto and Gilbert, 2015)
which is used by many researchers who explore and
analyse social media as it contains many slang words
that are used heavily by people in social media. (b)
The Loughran-McDonald Lexicon (Loughran and
McDonald, 2011) which although it does not contain
many words, it can use words in unison and also can
better analyse economic news’ sentiment. Therefore,
it is more appropriate to be used in our research. (c)
A Generic Dictionary that, although weak in its
ability to detect emotion with high accuracy,
complements the other two due to its sheer size and
large amount of words. Each tweet was evaluated and
we came up with three different scores corresponding
to the results of the sentiment evaluation for the three
lexicons.
Then for each day and each lexicon we computed
the average of the scores. Therefore, we created a csv
file, containing for each day, the date and the three
average scores from the three lexicons. Then, to
complement the above data, we used the Consumer
Sentiment Index published monthly by the University
of Michigan http://www.sca.isr.umich.edu/
The Consumer Sentiment Index has proven to be
very powerful in terms of forecasting and has been
used by many researchers. The University of
Michigan, when publishing the index, also provides
some insight with a report explaining why and how
the index changed this month, offering more clarity
about the stock market. Οur research which is the
forecast of the trend and not the real, exact price of a
stock, could theoretically produce better results if it
was supported by such an index, which generally tries
to predict the overall consumer sentiment each
month. Therefore, to help the accuracy of our
Forecasting Stock Market Trends using Deep Learning on Financial and Textual Data
107

research, the Consumer Sentiment Index was put
together with the other sentimental data which were
described above. As we mentioned, since it is
monthly published and not daily, we used for each
day of a month the same value for the index.
3 TECHNICAL ANALYSIS
The technical analysis is applied on the raw numerical
data of the stocks (opening, closing, high and low
price of the stock ticker per day). Technical analysis
techniques employ a number of indicators to forecast
the stock trend/price. Common traders use at least 2-
3 indicators in order to predict the trend/price of the
market but the results usually are not good enough.
However, using too many indicators may also not end
up with efficient results.
Using financial indicators in machine learning
had good results already (Fiol-Roig, Miró-Julià,
Isern-Deyà, 2010). In our approach we employed the
following indicators (https://www.investopedia.com)
to apply on the raw data:
a. The MACD (Moving Average Convergence
Divergence) is a trend-following momentum
indicator. The MACD line is calculated by
subtracting the 26-day exponential moving
average (EMA) from the 12-day EMA. A 9-day
EMA of the MACD which is called the "signal
line" can be used as a trigger for buy and sell
signals. If MACD is over the signal line, then
there is a buy signal, otherwise, there is a sell
signal. An EMA is a type of moving average that
places a greater weight and significance on the
most recent data points, and therefore, has a more
important effect on recent price changes.
b. The RSI (Relative Strength Index) is a
momentum indicator that measures the magnitude
of recent price changes to evaluate the value
conditions in the price of a stock. RSI is displayed
as an oscillator and it ranges in the interval
[0,100]. A stock is overvalued when the RSI is
above 70, so it indicates that we should sell and
oversold when it is below 30, thus it indicates a
buy signal. If RSI is between 30 and 70, then RSI
does not provide any information and we hold.
c. The stochastic oscillator is a momentum
indicator. It is used to generate overbought and
oversold signals, and also, it ranges in the interval
[0,100]. Typically, if stochastic oscillator is over
80, it is considered overbought, if stochastic
oscillator is under 20 is oversold, and it does not
provide more information when it is in range 20
to 80.
d. The Bollinger Band is a technical analysis
indicator defined by a set of lines plotted two
standard deviations away from a simple moving
average (upper and lower bands). There is the
belief that the closer the prices move to the upper
band, the more overbought the market, and the
closer the prices move to the lower band, the more
oversold the market. Most of the price action
happens between the lower and upper band. If a
breakout occurs above or below these bands is an
uncommon occasion.
4 APPLICATION
4.1 Data and Features
Firstly, we merge all the data that we discussed in
Sections 2 and 3 i.e.,
the daily historical data of the stock ticker for (a)
AAPL, GOOG, NVDA and Nasdaq Composite
Index (because of the correlation between the
stocks and the index) from yahoo finance and (b)
SPIS (S&P 500 Information Technology Sector)
from investing.com and
the sentimental data and the Consumer Sentiment
Index.
Afterwards, the technical analysis indicators are
calculated from the historical data and we add them
in our dataset.
The required features are:
a. The Closing Price of the stock ticker
b. The Closing Price of NASDAQ Composite Index
c. The Volume of NASDAQ Composite Index
d. MACD
e. RSI
f. Stochastic Oscillator
g. Bollinger Bands
h. Consumer Sentiment Index
i. Score of generic lexicon
j. Score of VADER lexicon
k. Score of Loughran-McDonald lexicon
l. Labels
4.2 Creating the Labels and Scaling
In order to predict the trend of the stock ticker 5 days
later, we shift the closing price of the stock ticker for
5 days and later we compare the closing price and the
closing price 5 days ahead to understand if the trend
is bullish, bearish or it does not change significantly,
so we just hold. This is how our labels are created. If
there is a bullish trend then we append number 2 for
the specific day, number 1 for hold and number 0 for
DATA 2021 - 10th International Conference on Data Science, Technology and Applications
108

bearish trend.
The entire dataset except labels is then
transformed via the MinMaxScaler provided by
sklearn (Pedregosa et al., 2011) so that each value in
the dataset belongs to the range [0,1].
4.3 The Datasets
At this point, three datasets are created from the initial
dataset. The first includes all the features listed above
and is called combined dataset. The second one
consists only of the numerical/economical data i.e.,
the closing prices, the volume and the technical
analysis indicators and the labels. The last one is the
sentimental dataset which consists of the Consumer
Sentiment Index, the scores of the three lexicons and
the labels.
4.4 Training/Testing Datasets
The datasets are split into the training and testing
datasets in order to train and test our models. The
training dataset consists of the days between
01.01.2000 until 31.12.2017 and the testing dataset
the days of the following two years, namely,
01.01.2018 until 31.12.2019.
4.5 Sequential Data
For the purpose of proper use of the LSTM model, it
is necessary to create sequential data from our current
datasets. This is an important step because in order to
achieve better results we must take into account the
data of the previous week and not only the data of the
previous day. Thus, in our case, each data point is
created by concatenating the data of 5 days. If our
dataset consists of n days, then our sequential data
are:
{ [x
1
, x
2
, x
3
, x
4
, x
5
], [x
2
, x
3
, x
4
, x
5
, x
6
] ,..., [x
n-4
, x
n-3
,
x
n-2
, x
n-1
, x
n
] }
where x includes all the features (except the labels) of
each day of the original dataset. Each new data point
takes the label of the element corresponding to the last
day i.e., the label of [x
1
, x
2
, x
3
, x
4
, x
5
] is the label of
x
5
, the label of [x
2
, x
3
, x
4
, x
5
, x
6
] is the label of x
6
, the
label of [x
3
, x
4
, x
5
, x
6
, x
7
] is the label of x
7
and so on.
4.6 Machine Learning and LSTM
Last step is to feed our data into the KNN, Decision
Trees and LSTM models.
In the KNN method, we use three nearest
neighbors as the k parameter and for the Decision
Trees method, we set the max depth equal to 5.
The LSTM model consists of 3 stacked layers.
Also, the Dropout function is used in order to avoid
the phenomenon of over fitting. Each of the three
datasets are trained for 30 epochs with batch size 64,
learning rate 10
-4
.
4.7 Strategy
In our approach, the positions are closed (i.e., the buy
and sell decisions are taken) when the 5-day holding
has ended. In our effort to face the strong volatility of
the stock market in the best possible way, we also
employ a simple strategy which is used along with the
LSTM, Decision Trees and KNN methods. The
strategy is as follows: The positions are closed either
when the 5-day holding has ended or when the
percentage of stop loss or the percentage of take profit
are surpassed. Usually, these percentages are -5% and
7% respectively, but they may be different depending
on the asset. It could also be used as a trailing take
profit tool but due to the type of data it is not possible
for back testing. However, it is a very good tool to be
used in real-time and is highly recommended.
4.8 Buy and Hold Strategy
Our results are compared to the results of the Buy and
Hold (B&H) strategy which is a very common stock
market strategy. Investors buy assets (stocks, ETFs,
Indices, etc.) and maintain these assets in the long
run. We can keep in mind that this strategy does not
use technical analysis techniques and is therefore very
simple. The main purpose of hedge fund managers
and many investors is to "beat the market". When
investors use the phrase "beat the market", they refer
to the achievement that they have more cumulative
returns than the B&H strategy.
5 RESULTS
In Subsections 5.1, 5.2 and 5.3 we present the profits
of the deep learning/machine learning methods for
each one of the three datasets. In Subsection 5.4, we
discuss the profits and the accuracy of the methods
when applied on the stock stickers of AAPL, GOOG,
NVDA and SPIS, while in Subsection 5.5 we
compare the returns of the B&H strategy to the ones
of the LSTM method applied on the numerical data.
5.1 Combined Dataset
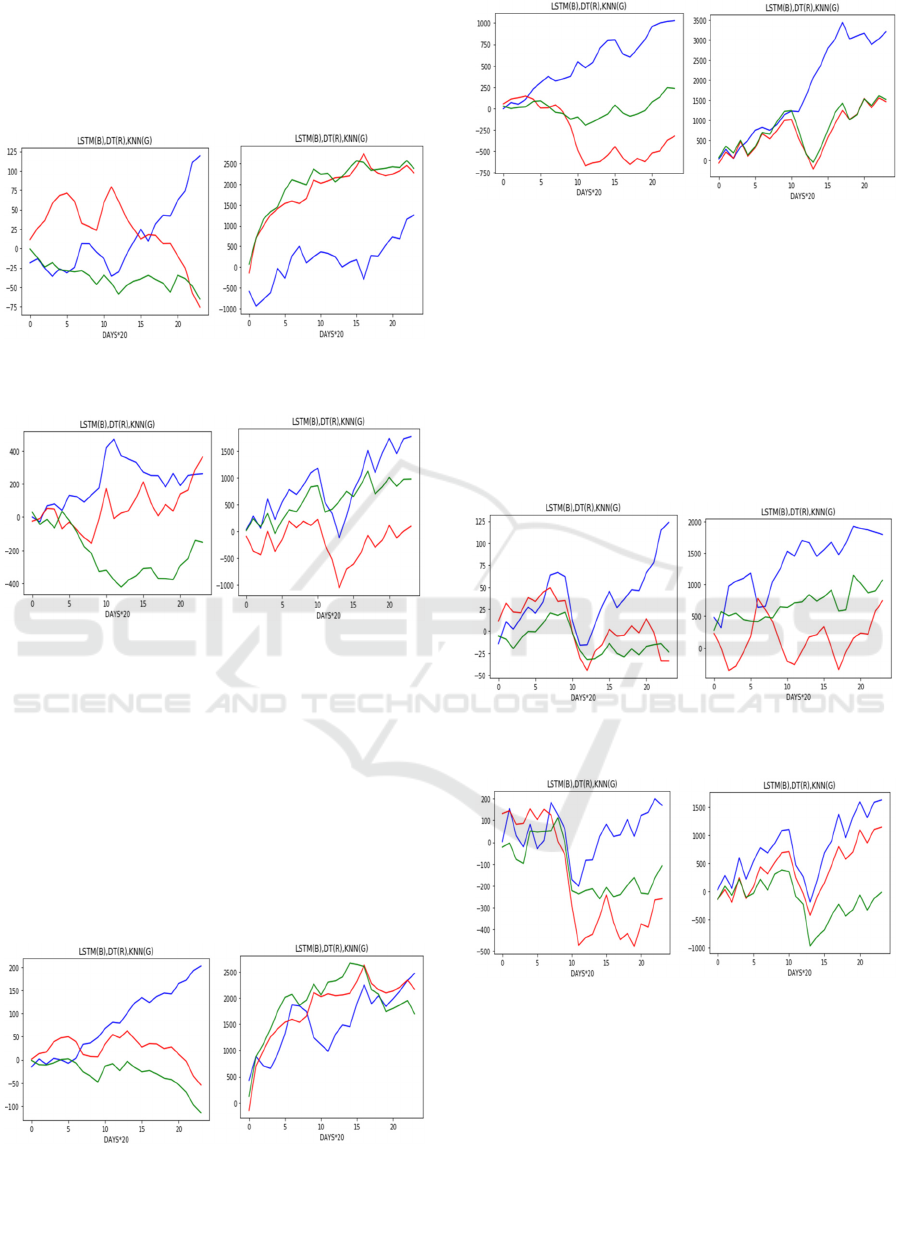
The four graphs in Figure 1 and Figure 2 show the
Forecasting Stock Market Trends using Deep Learning on Financial and Textual Data
109
profits of LSTM (blue line), Decision Trees (red line)
and KNN (green line) methods when applied on
combined datasets for every 20 business days (which
is about a month) for a period of two years
(20*25=500 business days).
Figure 1: Profits of each method for the Combined
Dataset of AAPL (left) and GOOG (right).
Figure 2: Profits of each method for the Combined
Dataset of NVDA (left) and SPIS (right).
For the combined dataset, we can only tell that the
LSTM method is always profitable, but when it
comes to Google and Nvidia tickers, it underperforms
compared to KNN and/or Decision Trees.
5.2 Numerical Dataset
The graphs of Figure 3 and Figure 4 show the profits
of the LSTM, the Decision Trees and the KNN
method, when applied on numerical datasets.
Figure 3: Profits of each method for the Numerical
Data of AAPL (left) and GOOG (right).
Figure 4: Profits of each method for the Numerical
Dataset of NVDA (left) and SPIS (right).
At the numerical dataset, we observe that the
LSTM is doing better than the other machine learning
techniques and 3 out of 4 times quite significantly.
5.3 Sentimental Dataset
The following graphs show the profits the LSTM
(blue line), Decision Trees (red line) and KNN (green
line) when applied on the sentimental dataset.
Figure 5: Profits of each method for the Sentimental
Dataset of AAPL (left) and GOOG (right).
Figure 6: Profits of each method for the Sentimental
Dataset of NVDA (left) and SPIS (right).
In the sentimental dataset, we see that the LSTM
always prevails, in comparison to the other
techniques.
5.4 Statistics
AAPL. The profit of the Buy and Hold strategy for
the AAPL sticker was 139.89$.
DATA 2021 - 10th International Conference on Data Science, Technology and Applications
110
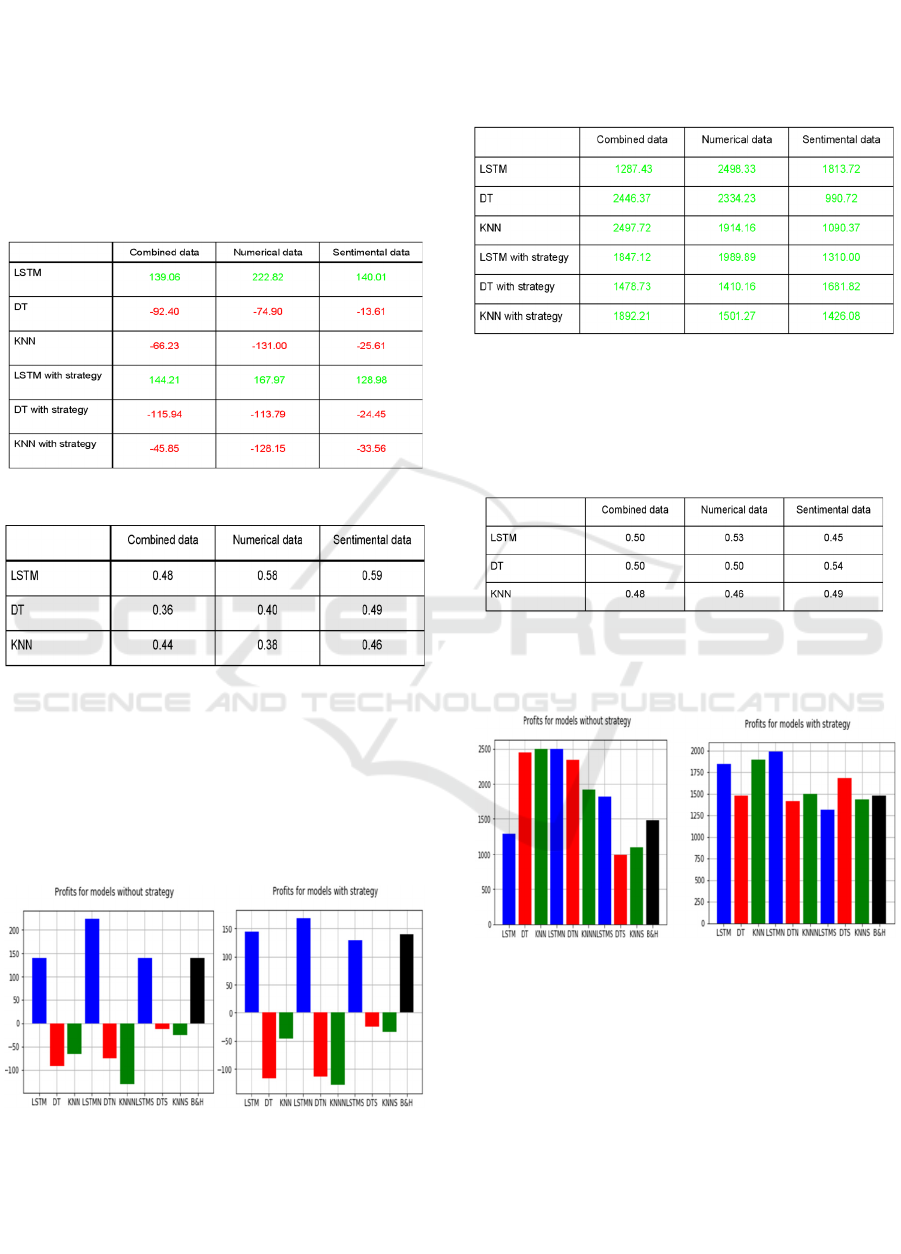
Table 1 presents the AAPL profits of each method
with and without our strategy for each one of the three
datasets in US dollars. Best case scenario for the
AAPL ticker was the LSTM on numerical data.
Table 2 contains the accuracy of each method for
the three datasets. Although LSTM on numerical data
provided us with more profit, the accuracy of LSTM
on the sentimental data was slightly better (59%).
Table 1: AAPL Profits (in US $).
Table 2: AAPL Accuracy of each method.
Figure 7 provides us with the information about
AAPL profits for all methods with or without our
strategy. We use the suffix “N” (“S”) to each method
to denote that the method is applied on numerical data
(resp., sentimental data). When no suffix is used, the
method is applied on the combined dataset (numerical
& sentimental data). B&H is the abbreviation of the
Buy and Hold strategy.
Figure 7: AAPL Profits without strategy (left) and with
strategy (right).
GOOG. The profit of the Buy and Hold strategy for
the GOOG sticker was 1480.85$. Table 3 shows that
the best case scenario for the GOOG ticker was the
LSTM on numerical data, with a very close difference
to the KNN on combined data. It is impressive that
every scenario is profitable.
Table 3: GOOG Profits (in US $).
Table 4 shows that the accuracy of LSTM on
numerical data was 53% while the accuracy of
Decision Trees on sentimental data was slightly better
(54%).
Table 4: GOOG Accuracy of each method.
Figure 8 provides us with the information about
GOOG’s profits for all methods with or without our
strategy.
Figure 8: GOOG Profits without strategy (left) and with
strategy (right).
NVDA. The profit of the Buy and Hold strategy for
the NVDA sticker was 135.50$. Table 5 shows that
the best case scenario for the NVDA ticker was the
LSTM on numerical data.
Forecasting Stock Market Trends using Deep Learning on Financial and Textual Data
111
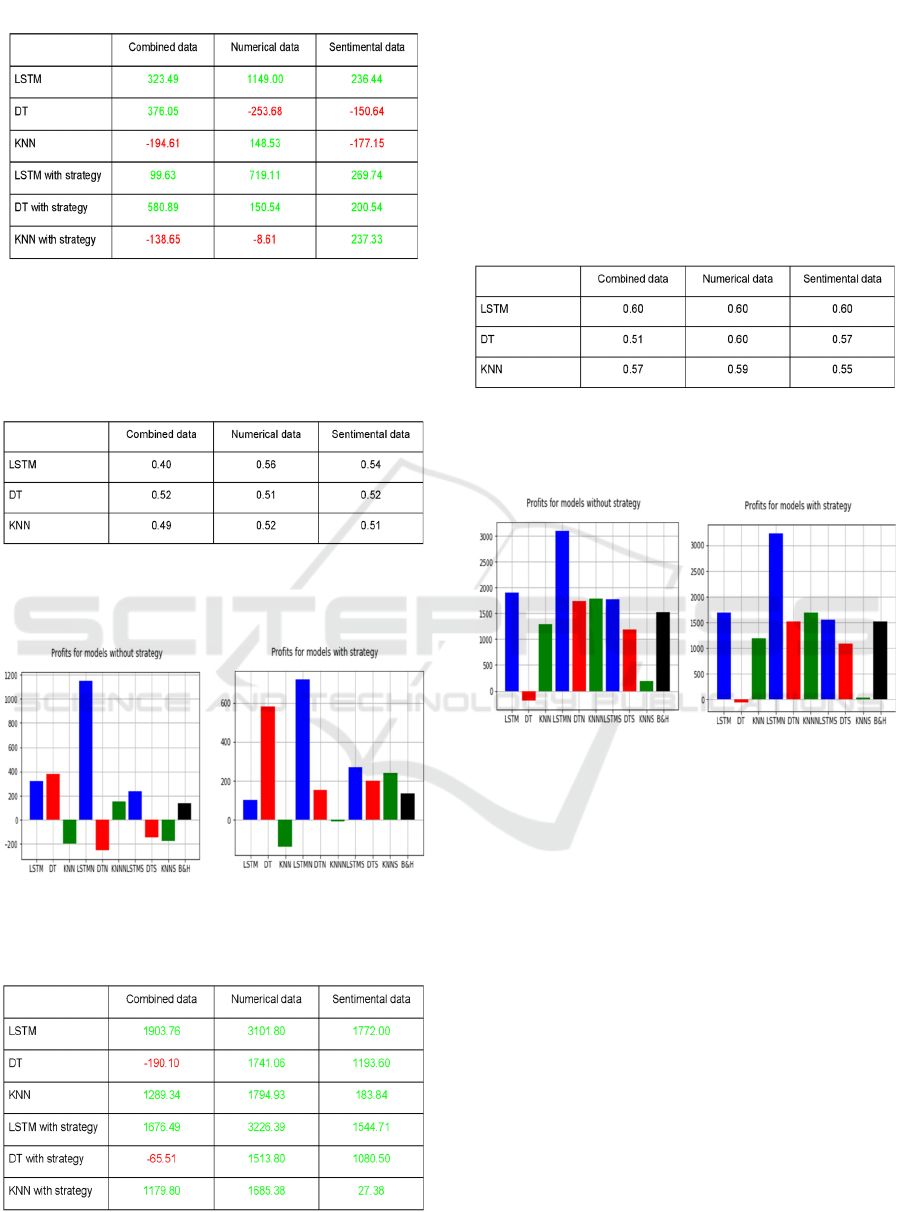
Table 5: NVDA Profit of each dataset (in US $).
Table 6 shows that for the NVDA the most
accurate method is LSTM on numerical data while
the accuracy of LSTM on sentimental data is slightly
worse.
Table 6: NVDA Accuracy of each method.
Figure 9 provides us with the information about
NVIDIA's profits for all methods with or without our
strategy.
Figure 9: NVDA Profits without strategy (left) and with
strategy (right).
Table 7: SPIS Profit of each dataset (in US $).
S&P Information Technology. The profit of the Buy
and Hold strategy for the SPIS index was 1521.35$.
According to Table 7, the best case scenario for the
SPIS ticker was the LSTM with strategy on numerical
data.
Table 8 shows that for the SPIS ticker, the
accuracy of LSTM on all types of data is 60%. The
Decision Trees method on numerical data is 60%
accurate.
Table 8: SPIS Accuracy of each method.
Figure 10 provides us with the information about
SPIS’s profits for all methods with or without our
strategy.
Figure 10: SPIS Profits without strategy (left) and with
strategy (right).
5.5 Comparing Passive Investor’s and
LSTM Method’s Returns
The results of previous subsections show that in
general, the LSTM method applied on numerical data
behaves better than the LSTM on combined or
sentimental data as well as the KNN and the Decision
Trees methods on any type of data. The following
table presents the profits and the returns of the LSTM
method on numerical data and the B&H Strategy.
From Table 9 we can compute the average returns
of each method:
Average returns of B&H: 33,52%
Average returns of LSTM (numerical data): 80,42%
Therefore, the LSTM method on numerical data
offers about 2.5 times more profit on average than the
Buy and Hold strategy (i.e., passive investment on the
assets).
DATA 2021 - 10th International Conference on Data Science, Technology and Applications
112
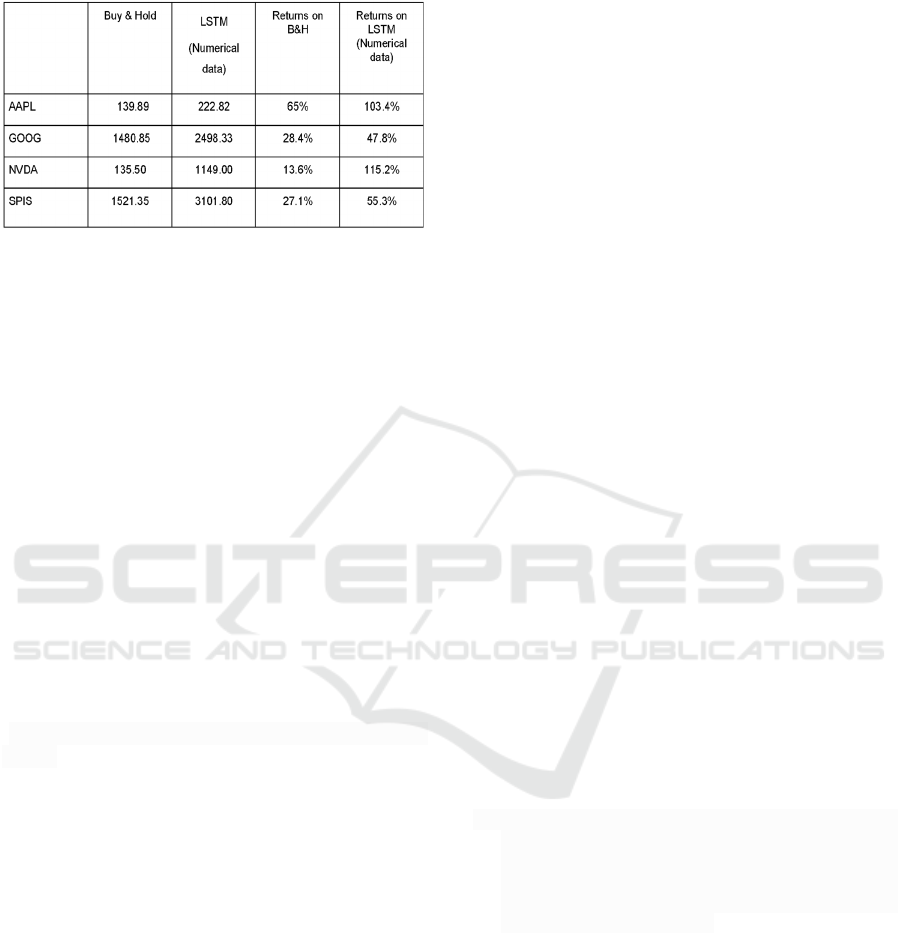
Table 9: Returns of B&H strategy and LSTM on numerical
data.
6 CONCLUSIONS
We developed a system which follows the trends of
stocks. After experimenting with the four stock
tickers and each dataset separately, we concluded that
the best scenario for a potential investor is to follow
the LSTM method with the numerical/economical
data.
Understanding the reasons for this observation,
and more specifically identifying the signal in the
sentiment data, is one of the focuses of our future
work. As a motivation, we note that there are many
cases that the LSTM method with sentiment data had
greater returns in comparison to a passive investor.
We argue that these returns can be possibly improved
in the future by including more quality data such as
news titles or articles, or even increasing the volume
of tweets acquired. There are also different
techniques that could be implemented, like ontologies
(Kontopoulos, Berberidis, Dergiades and Bassiliades,
2013) which with the help of more research could
prove to further enhance the results. Overall,
Sentiment analysis turned out to have some potential
for the future, as it was profitable, and sometimes a
better solution than a passive investment. It was
important to test these results over a long period of
two years (~500 business days) in order to come into
conclusions for the scale of the profits of each
method. Based on our results, it appears that the
LSTM method works better than the other machine
learning methods tested. Our research is based or real
hard and soft stock tickers’ data and provides realistic
results that can be used by financial advisors.
In our future work, we are planning to develop our
system to an autonomous system which predicts, each
day, the trend of the stock ticker. For this to work long
term, it is necessary to train the system online over
time to keep it up to date. We will also try alternative
mechanisms to utilize different types of data, to
further improve the prediction accuracy.
REFERENCES
Liberti, J.M. and Petersen, M. (2019). Information: Hard
and Soft, The Review of Corporate Finance Studies,
Volume 8, Issue 1, March 2019, p. 1–41.
Chong, E., Han, C. and Park, F.C. (2017). Deep learning
networks for stock market analysis and prediction:
Methodology, data representations, and case studies,
Expert Syst. Appl., Vol. 83, pp. 187–205.
Fischer T. and C. Krauss, C. (2018). Deep learning with
long short-term memory networks for _financial market
predictions, Eur. J. Oper. Res., vol. 270:2, pp. 654-669.
Long, W., Lu, Z. and Cui, L. (2019). Deep learning-based
feature engineering for stock price movement
prediction, Knowledge-Based Systems, Vol. 164, pp.
163-173.
Zhong X. and Enke, D. (2019). Predicting the daily return
direction of the stock market using hybrid machine
learning algorithms, Financial Innov., Vol. 5, no. 1, pp.
1–20.
Vignesh, C.K. (2020). Applying machine learning models
in stock market prediction, EPRA Int. J. Res. Develop.,
Vol. 5, no. 4, pp. 395–398.
Nabipour, M., Nayyeri, P., Jabani, H., Mosavi,A. and
Salwana, E. (2020). Deep learning for stock market
prediction, Entropy, Vol. 22, no. 8, p. 840.
Ferreira, F., Gandomi, A. and Cardoso R. (2021). Artificial
Intelligence Applied to Stock Market Trading: A
Review, IEEE Access.
Sun, A. Lachanski, M. and Fabozzi, F. (2016). Trade the
tweet: Social media text mining and sparse matrix
factorization for stock market prediction, Intl. Review
of Financial Analysis, Vol. 48, pp. 272-281.
Shapiro, A.H, Sudhof, M. and Wilson, D. (2017).
Measuring News Sentiment, Federal Reserve Bank of
San Francisco Working Paper 2017-01.
https://doi.org/10.24148/wp2017-01
Pagolu, V., Reddy, K., Panda, G. and B. Majhi, B. (2017).
Sentiment analysis of Twitter data for predicting stock
market movements, in Proc. Int. Conf. Signal Process.,
Commun., Power Emb. Syst., pp. 1345-1350.
Tabari N., Seyeditabari A., Peddi T., Hadzikadic M.,
Zadrozny W. (2019) A Comparison of Neural Network
Methods for Accurate Sentiment Analysis of Stock
Market Tweets. In ECML PKDD 2018 Workshops.
MIDAS 2018, PAP 2018. Lecture Notes in Computer
Science, vol 11054. Springer.
Batra, R. and Daudpota, S.M. (2018). Integrating
StockTwits with sentiment analysis for better
prediction of stock price movement, in Proc. Int. Conf.
Comput., Math. Eng. Technol., pp. 1-5.
Goodfellow, I., Bengio, Y. and Courville, A. (2016) Deep
Learning. MIT Press, 2016.
Ussama, Y., Soon, C., Vijayalakshmi, A. and Jaideep, V.
(2017). Sentiment based Analysis of Tweets during the
US Presidential Elections. 1-10.
10.1145/3085228.3085285
Hutto, C.J. and Gilbert, E. (2015). VADER: A
Parsimonious Rule-based Model for Sentiment
Analysis of Social Media Text. Proc. of the 8th
Forecasting Stock Market Trends using Deep Learning on Financial and Textual Data
113

International Conference on Weblogs and Social
Media, ICWSM 2015.
Loughran, T. and McDonald, B. (2011), When Is a Liability
Not a Liability? Textual Analysis, Dictionaries and 10‐
Ks. J. of Finance, 66: 35-65.
Fiol-Roig G., Miró-Julià M., Isern-Deyà A.P. (2010)
Applying Data Mining Techniques to Stock Market
Analysis. In Trends in Practical Applications of Agents
and Multiagent Systems. Advances in Intelligent and
Soft Computing, vol. 71, Springer.
Kontopoulos, E., Berberidis, C., Dergiades, T. and
Bassiliades, N. (2013). Ontology-based Sentiment
Analysis of Twitter Posts. Expert Systems with
Applications. 40.
Pedregosa et al., (2011). Scikit-learn: Machine Learning in
Python, JMLR 12, pp. 2825-2830.
DATA 2021 - 10th International Conference on Data Science, Technology and Applications
114
