
Inclusion of User Behavior and Social Context Information in ML-based
QoE Prediction
Fatima Laiche
1 a
, Asma Ben Letaifa
2 b
and Taoufik Aguili
1
1
Communication Systems Laboratory, ENIT, University Tunis El Manar, Tunis, Tunisia
2
MEDIATRON LAB, SUPCOM, Carthage University, Tunis, Tunisia
Keywords:
Video Streaming, Influence Factors, QoE, Machine Learning, User Behavior, Context, User Engagement.
Abstract:
The widespread use of online video content in every area of the connected world increases the interest in
Quality of Experience (QoE). QoE plays a crucial role in the success of video streaming services. However,
QoE prediction is challenging as many compelling factors (i.e., human and context factors) impact the QoE
and QoE management solution often neglect the impact of social context and user behavior factors on the end-
user’s QoE. To address these challenges, we have developed a web application to conduct subjective study and
collect data from application-layer, user-level, and service-level. The collected data is then used as training set
for machine learning models including decision tree, K-nearest neighbor, and support vector machine for the
purpose of QoE prediction.
1 INTRODUCTION
With the expansion of video streaming services over
the internet, mobile video traffic is predicted to reach
79 percent of the overall mobile traffic according to
the Cisco Visual Networking Index (VNI) (Ericsson
Mobility Report., 2018). This exponential growth is
due to the ever-increasing popularity of video stream-
ing services. Content providers such as YouTube,
Amazon Prime, and Hulu make decisions on the re-
source allocation based on both operational costs and
user-perceived quality.
Quality of Experience (QoE) is used to enhance
the quality of a service based on taking the user’s
opinion into account and integrating objective Qual-
ity of Service (QoS) and subjective influencing fac-
tors. A common definition of QoE is cited by the Eu-
ropean Network on Quality of Experience as “QoE is
the degree of delight or annoyance of the user of an
application or a service, it results from the fulfillment
of his or her expectations with respect to the utility
and/or enjoyment of the application or service in the
light of the user’s personality and current state.” (Le
Callet et al., 2012). Based on the above definition,
QoE encompasses subjective aspects besides objec-
tive parameters. It is a multidisciplinary domain that
a
https://orcid.org/0000-0002-2752-1709
b
https://orcid.org/0000-0002-1527-2557
covers multiple topics such as engineering, social psy-
chology, computer science, etc. Consequently, this
variety of research aspects has raised the challenges
related to the management of QoE.
As investigating, selecting relevant QoE influenc-
ing factors is the first step towards an accurate QoE
prediction model (Building function model to map
QoE to real number). Through the recent studies,
QoE modeling with influence factors including con-
text (physical location) and human factors (user en-
gagement, interests, user profile) in adaptive video
streaming services have attracted attention. However,
with the ever-growing adoption of adaptive stream-
ing, solutions that rely on in-network measurements
to estimate QoE often neglect user behavior and so-
cial contextual factors and their impact on the per-
formance estimation as they idealize the user’s en-
vironment. A lot of research has depicted the in-
fluence of application-level Key Performance Indica-
tors (KPIs) on the QoE of videos delivered via the
dynamic adaptive streaming over HTTP paradigm.
Client-side monitoring can provide the information
at the application layer and consequently identifying
QoE degradation and according to the analysis con-
ducted with Machine Learning (ML) algorithms (Re-
iter et al., 2014; Barakovic et al., 2019; Juluri et al.,
2015) found that specific application-level KPIs influ-
ence the perceived quality: playout resolution, initial
delay, average bitrate, and stalling. The underlying
Laiche, F., Ben Letaifa, A. and Aguili, T.
Inclusion of User Behavior and Social Context Information in ML-based QoE Prediction.
DOI: 10.5220/0010606405970604
In Proceedings of the 16th International Conference on Software Technologies (ICSOFT 2021), pages 597-604
ISBN: 978-989-758-523-4
Copyright
c
2021 by SCITEPRESS – Science and Technology Publications, Lda. All rights reserved
597

assumption is that ML-based QoE estimation could
be improved with the availability of additional data at
application-level information provided by the service
provider. We identify three main categories of QoE
influence factors that would reflect users’ perceived
quality:
System-related: information about application-
specific parameters such as: buffering, stalling, initial
delay, etc.,
User behavior-related: indicates information about
user engagement (e.g., time spent watching) and user
interaction with the video player (e.g., number and
duration of pauses).
Social context-related: information about the popular-
ity (e.g., number of views) of videos and users’ pref-
erences (e.g., likes, dislikes).
We put emphasis on to what extent social context
and user behavior information could improve QoE es-
timation and what are the factors that have high influ-
ence on the end-QoE this besides specific cause anal-
ysis and efficient QoE management.
In this work, we choose YouTube social plat-
form for data gathering to obtain as much informa-
tion about the user-generated data on YouTube and to
show how exploiting social context and user behavior
information could improve the performance of QoE
estimation models.
To address this issue, we develop a crowdsourc-
ing framework to monitor and collect information
on video streaming services. The monitoring probe
is a web application that embeds YouTube videos,
we study the relation between application-level KPIs,
user behavior, and social contextual parameters, con-
duct features selection, and build a QoE model based
on machine learning to estimate QoE Mean Opinion
Score (MOS) based on highly correlated features re-
lated to objective and subjective aspects.
The remainder of this paper is structured as fol-
lows. Section 2 provides an overview of the state of
art on monitoring and estimating video QoE. Section
3 promotes our contributions. Section 4 reports on
the QoE prediction algorithms and discusses models’
performance results. Conclusion and perspectives are
discussed in Section 5.
2 RELATED WORK
To develop an efficient QoE model it is crucial to
identify which factors cause network degradation and
influence most perceived QoE. QoS fluctuation can
occur in different parts of the video streaming trans-
mission chain. Encryption of video traffic transmitted
over the internet is increasing. Thus, the monitoring
solutions should be deployed at the client-side instead
of different parts on the network (e.g. user equip-
ment, home/access network, core network). To moni-
tor video streaming service on the user-side, (Wamser
et al, 2015) developed a passive android application
to measure the application level KPIs (i.e., video res-
olution, buffer, bit rate) of YouTube videos in the
user’s mobile device, another application for mo-
bile services called YOUQMON (Casas et al., 2013)
was proposed to estimate MOS of YouTube videos
in 3G networks from passively analyzing the traffic.
Stalling events are calculated in real-time using the
QoE model and projected to MOS values. In the
same vein, (Maggi et al., 2019) proposed a technique
to detect stall events and classify them into stalling
caused by poor network quality or user-seeking inter-
actions. It is important to identify root cause anal-
ysis to take immediate actions such as fair reallo-
cation of resources in case stalling caused by net-
work conditions. Hence, crowdsourcing is consid-
ered to enable new functionalities to subjective eval-
uation, it is more time and cost-effective, flexible and
it creates realistic test environment, One initiative in
the direction of collecting wide-scale video stream-
ing usage information for popular video streaming
services (e.g. YouTube, Amazon Prime Video, Net-
flix) (Robitza et al., 2020) have developed a web
browser extension called YTCrowdMon. In most re-
cent research, the potential of ML techniques has been
exploited for KPI and QoE estimation of encrypted
traffic from network/application-level metrics. (Di-
mopoulos et al., 2016) developed an ML-based model
to detect QoE degradation from encrypted traffic.
They used the Random Forest algorithm to classify
video streaming sessions regarding three metrics that
influence adaptive video streaming QoE. i.e. stalling,
the average video quality, and quality variations. In a
more similar approach, in (Orsolic et al., 2017) a sys-
tem called YouQ is developed to monitor application-
level quality features and corresponding traffic traces
per video session to classify YouTube videos using
various models into three QoE classes (“low, medium,
high”, and “low, high”). Instead of technical indi-
cators, there is another influence metric that can be
deemed worthwhile, indirect metadata of different
sources.
Contextual factors can reveal an important amount
of information on the quality of the transmission
chain and content of interest. Also, User engagement
which describes the viewing time of video stream-
ing has been used as a replacement for subjective
QoE. (Moldovan and Metzger., 2016) investigated the
correlation between QoE and user engagement for
on-demand video streaming services, and the results
ICSOFT 2021 - 16th International Conference on Software Technologies
598
show a strong correlation. A large-scale study was
conducted in (Shafiq et al., 2014) to characterize mo-
bile video streaming performance and study how user
engagement impacts to network and application Key
video performance metrics from the perspective of
a network operator. They proposed a model to pre-
dict video abandonment based on a strong correlation
observed between several network features and aban-
donment rate. Other metrics that depict social context
factors include popularity, the number of like-dislike,
and the number of comments. These features are usu-
ally applied on a video level and contribute to the
quality perceived by users. (Wu et al., 2018) inves-
tigated the relationship between the videos with high
engagement and view count using large-scale mea-
surements of YouTube metadata videos collected over
two months, they found engagement metrics more sta-
ble and predictable compared to popularity metrics
which are driven by external promotion. In a simi-
lar work, (Park et al., 2016) demonstrated a positive
correlation between video watching, comment senti-
ment, and popularity metrics. In a realistic environ-
ment, users interact with video players while watch-
ing videos, examples of user interactions are pausing,
playing, seeking, change display quality. (Seufert et
al., 2019) incorporated user interactions when build-
ing ML models for QoE analysis of encrypted traf-
fic in real-time. While (Bartolec et al., 2019) have
trained ML models on data with and without user
playback related interactions to investigate how user
interaction could impact QoE/KPI estimation.
3 METHODOLOGY
3.1 Dataset and Crowdsourced
Measurement
The goal is to provide a measurement tool to mon-
itor specific Key Performance Indicators (KPIs) that
correlate with the perceived quality during a YouTube
session. We build a web QoE monitoring applica-
tion for YouTube crowdsourced QoE measurements.
The tool displays the same functionality as the native
YouTube client app. It gathers information from user-
level, service-level, and application-level using APIs
(e.g., Google, YouTube Data) and built-in functions.
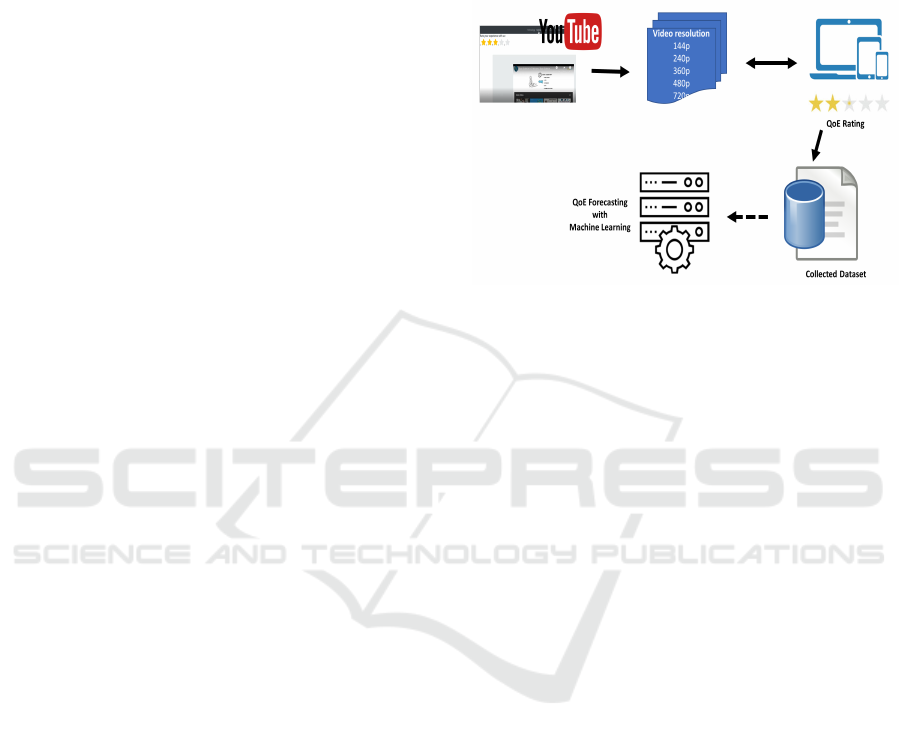
Figure 1 shows the testbed used for data collection.
One hundred individuals participated in the experi-
ment. The participants were randomly selected from
SUP COM school within a university context. They
had invited other people who had prior experience
using a web application to conduct the experiments.
Written instructions were provided. They are asked
to insert their personal information: age, gender, pref-
erences to create a session. Afterward, they watch
videos according to their preferences and rate the per-
ceived quality multiple times. Figure 1 illustrates the
diagram of the QoE experiment testbed.
Figure 1: Proposed QoE forcasting methodology.
The dataset we collected consists of application-
level features, social context parameters, and user
behavior over videos. Table 1 depicts the metrics
reported by the monitoring app. The monitored
application-level data are the most relevant KPIs for
QoE in HTTP adaptive video streaming as initial de-
lay, buffering, stalling, and quality changes (Wamser
et a., 2015). We captured data that is related to user
behavior. User engagement describes the percentage
of the video viewed. We addressed one type of user
interaction with the video player which is the user-
initiated action to pause the video. Social context fac-
tors cover popularity and preferences data extracted
from YouTube metadata information (e.g., number of
views, like and dislike, etc.). To label the played
videos with MOS, the participants were asked to rate
the perceived quality.
We collected 1200 data records for four months con-
taining the subjective and objective measures (Table
1). to create a homogeneous dataset from crowd-
sourcing tests we filtered out the invalid measure-
ments and unreliable instances. After cleaning the
data set we obtained 1010 instances each contains 20
features.
With the new dataset, we can figure out what impact
QoE and build a model based on ML algorithms that
predict accurate MOS values.
3.2 Dataset Characteristics
To study the impact of social context indicators and
user interactions on the end-users QoE we analyzed
the collected data. Figure 2 describes the distribution
of the relevant features for the quality assessment. It
Inclusion of User Behavior and Social Context Information in ML-based QoE Prediction
599

Table 1: Main features of the dataset.
Category Features
Application-level
information
Initial delay, etc.
Buffer level, avg buffer
level, etc.
Stalling, total stalling
length etc.
Quality switches, Avg
bitrate etc.
QoE rating MOS value, content
rating
User behavior
Watch time ratio.
Pause events
Social context View count,
Like/dislike count,
Category title
Figure 2: Relevant features.
shows that the users prefer to watch highly viewed
videos which led to higher content ratings and better-
quality ratings, they tend to give high rates to videos
with a large view count and that confirms the positive
correlation between content popularity and MOS con-
sidering network transmission. Also, a negative rela-
tionship exists between pause events and MOS (Qual-
ity rating). In most of the videos viewed, we reported
the occurrence of stalling events because of drastic
bandwidth changes. We identified a correlation be-
tween user engagement and quality rating given the
fact that a previous study (Park et al., 2016) has iden-
tified this relation. Thus, we observed that the more
the user spent time watching more the MOS rating
is high. To understand the relationship between mul-
tiple features, Figure 3 shows the distribution of the
overall stalling and pause events, it can be noted that
in most videos when stalling happens, users tend to
pause the video for buffering to improve the stream-
ing quality. Figure 3 confirms that stalling impacts
perceived quality as the users give a low rating when
stalling occurs. In the end, we can assume that user
behavior, user interaction, and content-related infor-
mation influence the perceived quality as much as the
stalling.
3.3 Data Preprocessing
In this section, we conduct feature selection and
feature importance to help build an efficient ML
model. The model training component takes relevant
application-level, service-level, and user-level data as
input data. First, the former data is extracted using
APIs and fed to the feature selection algorithm to se-
lect the exact features and labels to be used for the
training of ML models. The collected data is used
as input to the feature selection algorithm to reduce
complexity and improve the performance of the pre-
dictive models by eliminating irrelevant features from
the dataset.
The pertinent features to be utilized are specified by
the feature selection algorithm. In our work, we relied
on the univariate selection method SelectKBest pro-
vided by scikit-learn library. This method enables the
selection of k highest scoring features that have the
strongest relationship with the output feature based
on univariate statistical tests. The algorithm reduced
the number of features to 14, they are listed in Figure
4. The most commonly selected variables are related
to features from different levels. The selected features
from the application level are mostly the features that
were selected in other work (Abar et al., 2017; Casas
et al., 2013; Ben Letaifa., 2018; Ben Letaifa., 2019)
and influence on the end QoE. Our findings show sim-
ilar results presented in the research area. In the case
of popularity metrics and user behavior and regard-
less of feature selection algorithm popularity metrics
have been proved to be highly related and influence
the perceptual quality. Specific user behavioral and
engagement metrics were also selected by the selec-
tion algorithm as they have a relationship with the per-
ceived quality.
To highlight which features may be most relevant to
the output MOS, we used two commons classifiers
Random Forest (RF) and XGB Classifier to provide
an estimation of feature importance for a predictive
modeling problem. XGB algorithm decides on fea-
tures’ importance based on how many times that fea-
ture is used to make key decisions across all the trees.
RF as opposed to XGB method evaluate relative im-
ICSOFT 2021 - 16th International Conference on Software Technologies
600
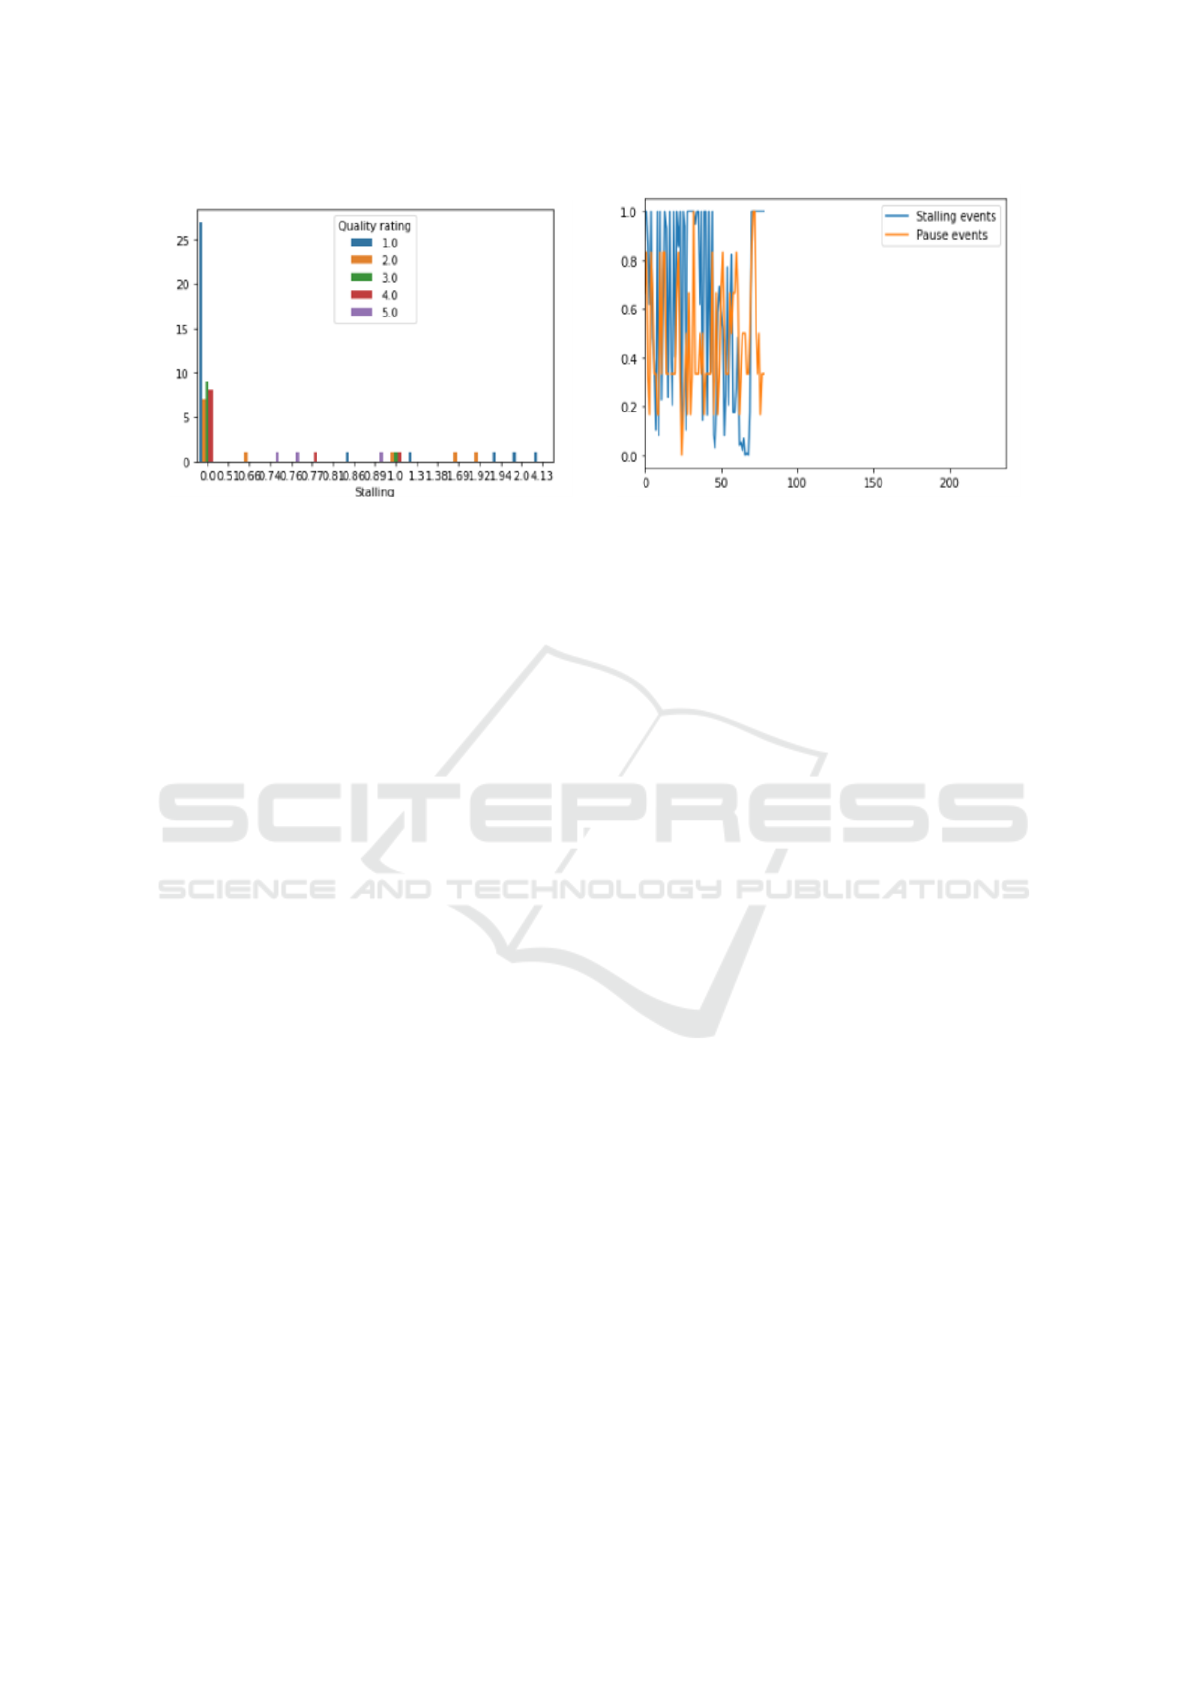
(a) stalling/MOS. (b) Pause events/Stalling events.
Figure 3: Data Visualization.
portance scores for each feature separately. Figure 4
shows results in terms of feature importance with the
two used algorithms. In subfigures, 4a and 4b the im-
portance of features in the feature list differs. It can
be observed that features with less important scores
are different but still relevant such as popularity in-
dicators. Although, important features are almost the
same depending on whether RF or XGB was utilized.
The user behavior (pause events) and popularity indi-
cators contribute equally to the model performance.
To highlight which features may be most relevant to
the output MOS, we used two common classifiers
Random Forest (RF) and XGB Classifier to provide
an estimation of feature importance for a predictive
modeling problem. XGB algorithm decides on fea-
tures importance based on how many times that fea-
ture is used to make key decisions across all the trees.
RF as opposed to XGB method evaluate relative im-
portance scores for each feature separately. Figure 4
shows results in terms of feature importance with the
two used algorithms. In subfigures 4a and 4b, the im-
portance of features in feature list differs. It can be
observed that features with less important scores are
different but still relevant such as popularity indica-
tors, although important features are almost the same
depending on whether RF or XGB was utilized. The
user behavior (pause events) and popularity indicators
contribute equally to the model performance.
3.4 Model Training
In this section, we conduct a feature selection study
to select pertinent features and we build a machine
learning model that predicts accurately QoE. to de-
fine our model, we go with step 1: we use cross-
validation method to split the dataset into three sub-
sets: training, validation, and testing. This method
is more effective than splitting the dataset in training
and test data because it prevents problems like over-
fitting. In step 2: to predict MOS using the most used
prediction models in literature: K Nearest Neighbor,
decision tree, and random forest. we applied a set
of hyperparameters aiming to find the right combi-
nation of values that can help maximize the accu-
racy. In step 3, we evaluate the performance of our
models by measuring accuracy, Pearson correlation,
and F1- score. We end up by selecting the algo-
rithm that gives us the best prediction of MOS. We
build two ML-based models to show how social con-
textual info and user interactions enhance the perfor-
mance of QoE estimation. The models are trained on:
Model1: Application-level data, user engagement in-
dicator Model2: Application-level data, user behavior
info, and social contextual factors. Training ML mod-
els using dataset plays a crucial role to understand
the mathematical endeavor and create the right out-
put. In this work, we use algorithms: Random Forest,
K-Nearest Neighbor (KNN), and Decision Tree (DT),
description of the former ML algorithms and train-
ing phase will be discussed in the following. KNN
solves regression and classification problems by clas-
sifying data points based on similarity measures, it
categorizes data regarding the classes of their clos-
est neighbors. to train KNN model, Euclidean met-
ric with equal distance weights has been selected as
the distance metric, and to avoid overfitting, a cross-
validation technique has been used when using differ-
ent values of K. the performance of KNN has been
presented in Table 2. Random forest inspired by the
DT algorithm; it is a special case of bootstrap bagging
applied to the decision tree. For model training and
from the literature we found the family of tree-based
algorithms perform best (Bartolec et al., 2019; Orso-
lic et al., 2017; Wamser et al., 2015). For the case of
in-network applications, we argue to use decision tree
and random forest as it requires fewer resources and
Inclusion of User Behavior and Social Context Information in ML-based QoE Prediction
601
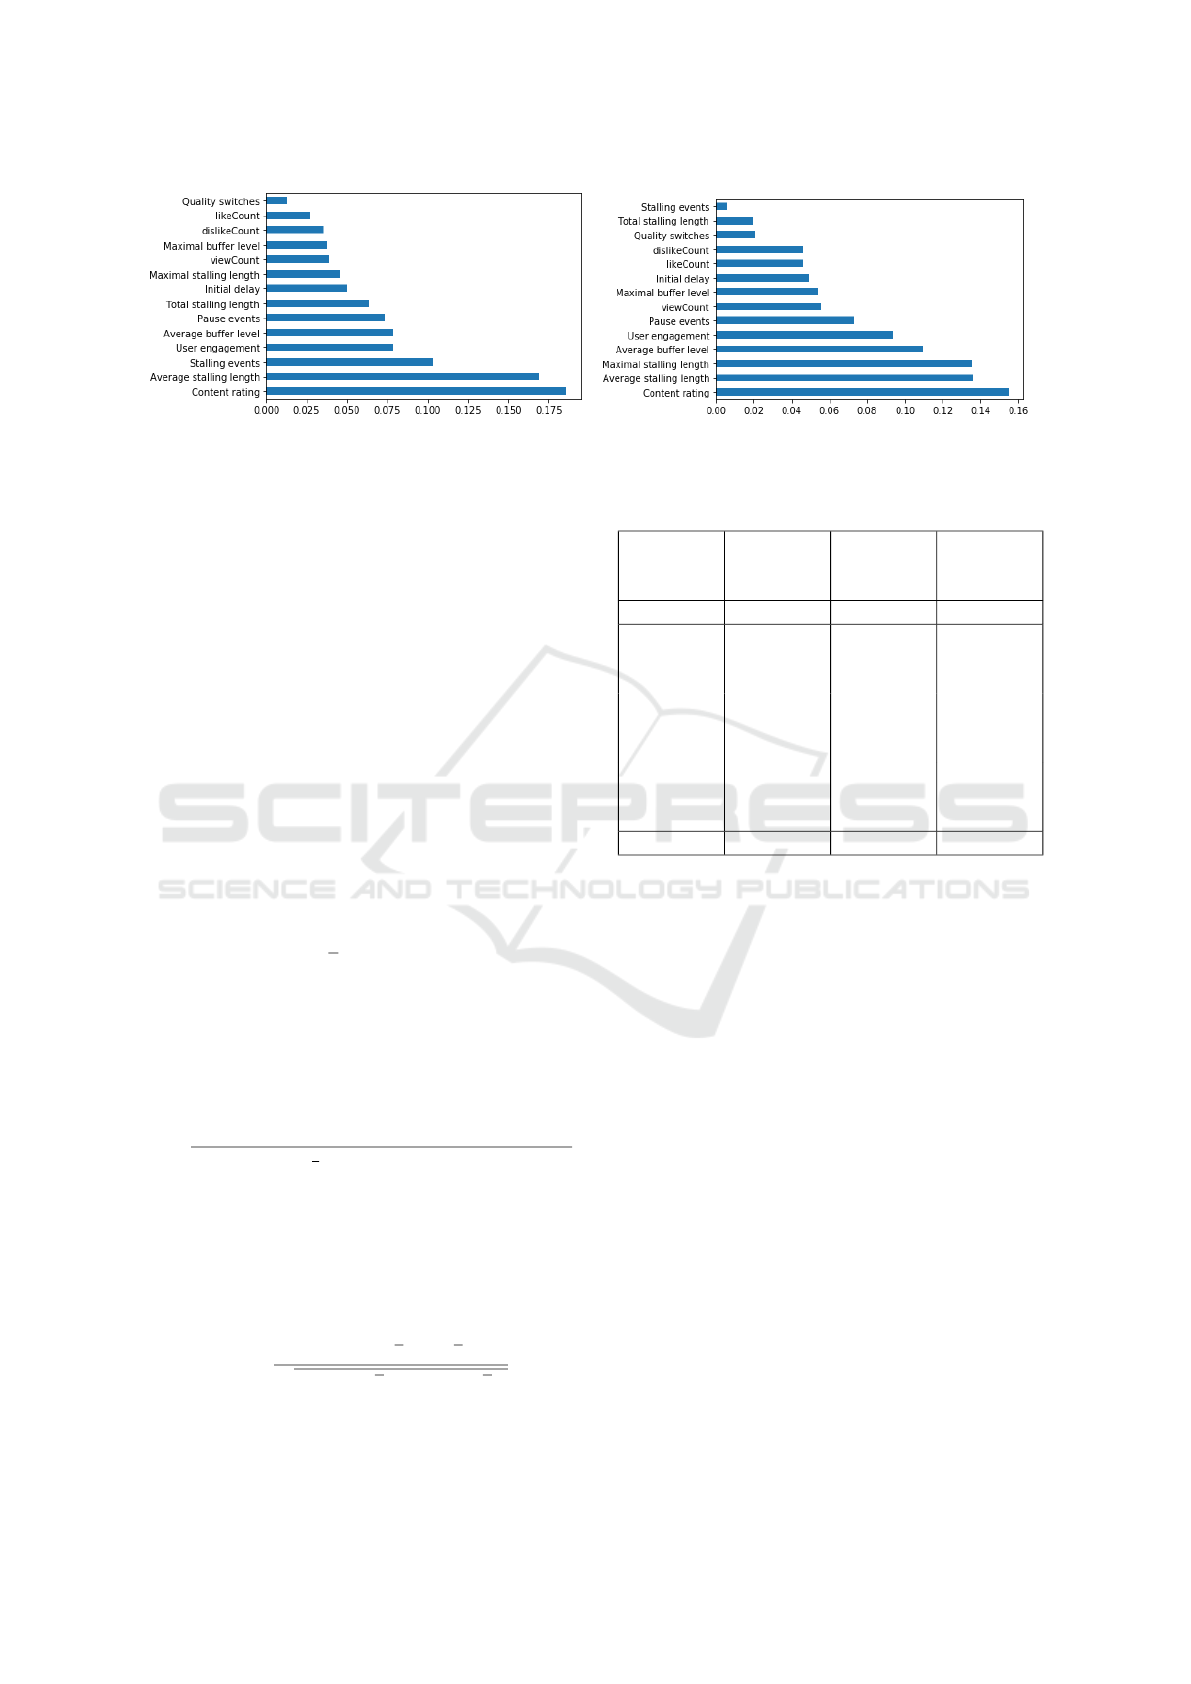
(a) Features selected, XGB model. (b) Features selected, RF model.
Figure 4: Features importance using classification models.
exhibits good performance.
4 EXPERIMENTAL RESULTS
4.1 Performance Evaluation Metric
In this section, we provide a description of per-
formance evaluation metrics. For objective quality
assessment, we use statistical metrics that cover
aspects: linearity, accuracy, and consistency against
subjective data. The statistical evaluation metrics we
used are summarized as follows:
Accuracy The accuracy is the fraction of the number
of correct predictions and it is defined as (Eq.1):
where x
i
is the ground truth, and y
i
is the predicted
value, n denotes the number of samples.
A =
1
n
n
∑
i=1
f (x
i
, y
i
) (1)
F1 score measures the test accuracy it can be inter-
preted as the weighted mean of precision and recall,
it provides a standard scale of [0, 1] and F1 score
(Eq.2) reflects the robustness of the classifier.
F1 =
TruePositives
TruePositives +
1
2
(FalsePositives + FalseNegatives)
(2)
Pearson Linear Correlation Coefficient (PCC).
PCC measures the linear correlation between model’s
output and the subjective QoE. The range of PCC(Eq.
3) is [-1, 1] where 1 indicates positive correlation and
-1 negative correlation.
PCC =
∑
n
i=1
(x
i
− x)(y
i
− y)
p
∑
n
i=1
(x
i
− x)
2
∑
n
i=1
(y
i
− y)
2
(3)
Yi denotes predicted MOS and xi the subjective one.
N indicates the total number of samples.
Table 2: Experiment results of Model2.
Classifier Accuracy F1 Score
(macro-
avg)
PCC
RF 0.875 0.54 072
KNN
(neighbor
= 5)
0.77 0.27 0.56
KNN
(neighbor
= 10)
0.812 0.30 0.62
KNN
(neighbor
= 15)
0.812 0.30 0.62
DT 0.979 0.76 0.883
4.2 Evaluation
We evaluate the performance of QoE models. Table
2 and Table 3 show the performance of classification
models. In the case of model1, our results show that
Decision tree gives the best results which makes it a
perfect candidate for QoE prediction system imple-
mentation. RF learning algorithm shows results better
than KNN although trying different values of neigh-
bors more than 10 didn’t enhanced the performance
of the algorithm. On the contrary, the model which
learns features from contextual, user behavior data be-
sides application KPIs performed better than model
trained only with application-level parameters. For
model2 DT algorithm shows the best results.
5 CONCLUSION
In this work, we presented a WebQoE monitoring ap-
proach and an applied test methodology based on real
time QoE estimation depicted by end users. based on
large dataset collected using WebQoE application a
solution has been proposed using decision tree clas-
ICSOFT 2021 - 16th International Conference on Software Technologies
602

Table 3: Experiment results of Model1.
Classifier Accuracy F1 Score
(macro-
avg)
PCC
RF 0.790 0.47 061
KNN
(neighbor
= 5)
0.50 0.15 0.35
KNN
(neighbor
= 10)
0.612 0.20 0.35
KNN
(neighbor
= 15)
0.612 0.23 0.35
DT 0.779 0.56 0.653
sifier to predict QoE in the context of adaptive video
streaming services. For future work we aim to de-
velop QoE management approach of video services in
SDN/MEC environment where we can implement our
QoE prediction model as in-network solution. our on-
going work will focus on QoE management and con-
trol approach for video streaming services delivered
over the emergent network technologies.
REFERENCES
Le Callet, P., M
¨
oller, S., & Perkis, A. (2012). Qualinet
white paper on definitions of quality of experience.
European network on quality of experience in multi-
media systems and services (COST Action IC 1003),
3(2012).
Reiter, U., Brunnstr
¨
om, K., De Moor, K., Larabi, M. C.,
Pereira, M., Pinheiro, A., ... & Zgank, A. (2014). Fac-
tors influencing quality of experience. In Quality of
experience (pp. 55-72). Springer, Cham.
Barakovi
´
c Husi
´
c, J., Barakovi
´
c, S., Cero, E., Slamnik, N.,
O
´
cuz, M., Dedovi
´
c, A., & Zup
ˇ
ci
´
c, O. (2020). Quality
of experience for unified communications: A survey.
International Journal of Network Management, 30(3),
e2083.
Juluri, P., Tamarapalli, V., & Medhi, D. (2015). Measure-
ment of quality of experience of video-on-demand ser-
vices: A survey. IEEE Communications Surveys &
Tutorials, 18(1), 401-418.
Wamser, F., Seufert, M., Casas, P., Irmer, R., Tran-Gia, P.,
& Schatz, R. (2015, June). YoMoApp: A tool for an-
alyzing QoE of YouTube HTTP adaptive streaming in
mobile networks. In 2015 European Conference on
Networks and Communications (EuCNC) (pp. 239-
243). IEEE.
Robitza, W., Dethof, A. M., G
¨
oring, S., Raake, A., Beyer,
A., & Polzehl, T. (2020, May). Are You Still Watch-
ing? Streaming Video Quality and Engagement As-
sessment in the Crowd. In 2020 Twelfth Interna-
tional Conference on Quality of Multimedia Experi-
ence (QoMEX) (pp. 1-6). IEEE.
Casas, P., Seufert, M., & Schatz, R. (2013). YOUQMON: A
system for on-line monitoring of YouTube QoE in op-
erational 3G networks. ACM SIGMETRICS Perfor-
mance Evaluation Review, 41(2), 44-46.
Dimopoulos, G., Leontiadis, I., Barlet-Ros, P., & Papagian-
naki, K. (2016, November). Measuring video QoE
from encrypted traffic. In Proceedings of the 2016 In-
ternet Measurement Conference (pp. 513-526).
Moldovan, C., & Metzger, F. (2016, September). Bridg-
ing the gap between qoe and user engagement in http
video streaming. In 2016 28th International Teletraffic
Congress (ITC 28) (Vol. 1, pp. 103-111). IEEE.
Shafiq, M. Z., Erman, J., Ji, L., Liu, A. X., Pang, J., &
Wang, J. (2014). Understanding the impact of net-
work dynamics on mobile video user engagement.
ACM SIGMETRICS Performance Evaluation Re-
view, 42(1), 367-379.
Orsolic, I., Pevec, D., Suznjevic, M., & Skorin-Kapov,
L. (2017). A machine learning approach to classify-
ing YouTube QoE based on encrypted network traf-
fic. Multimedia tools and applications, 76(21), 22267-
22301.
ark, M., Naaman, M., & Berger, J. (2016, March). A data-
driven study of view duration on youtube. In Proceed-
ings of the International AAAI Conference on Web
and Social Media (Vol. 10, No. 1).
Wu, S., Rizoiu, M. A., & Xie, L. (2018, June). Beyond
views: Measuring and predicting engagement in on-
line videos. In Proceedings of the International AAAI
Conference on Web and Social Media (Vol. 12, No.
1).
Bartolec, I., Orsolic, I., & Skorin-Kapov, L. (2019, June).
In-network YouTube performance estimation in light
of end user playback-related interactions. In 2019
Eleventh International Conference on Quality of Mul-
timedia Experience (QoMEX) (pp. 1-3). IEEE.
Seufert, M., Casas, P., Wehner, N., Gang, L., & Li, K.
(2019, February). Stream-based machine learning for
real-time QoE analysis of encrypted video stream-
ing traffic. In 2019 22nd Conference on innovation in
clouds, internet and networks and workshops (ICIN)
(pp. 76-81). IEEE.
Letaifa, A. B. (2017, June). Adaptive QoE monitoring ar-
chitecture in SDN networks: Video streaming services
case. In 2017 13th International Wireless Communi-
cations and Mobile Computing Conference (IWCMC)
(pp. 1383-1388). IEEE.
Abar, T., Letaifa, A. B., & El Asmi, S. (2017, June).
Machine learning based QoE prediction in SDN net-
works. In 2017 13th International Wireless Communi-
cations and Mobile Computing Conference (IWCMC)
(pp. 1395-1400). IEEE.
Laiche, F., Letaifa, A. B., & Aguili, T. (2020, Septem-
ber). QoE Influence Factors (IFs) classification Sur-
vey focusing on User Behavior/Engagement metrics.
In 2020 IEEE 29th International Conference on En-
abling Technologies: Infrastructure for Collaborative
Enterprises (WETICE) (pp. 143-146). IEEE.
Inclusion of User Behavior and Social Context Information in ML-based QoE Prediction
603

Ben Letaifa, A. (2019). WBQoEMS: Web browsing QoE
monitoring system based on prediction algorithms.
International Journal of Communication Systems,
32(13), e4007.
Maggi, L., Leguay, J., Seufert, M., & Casas, P. (2019,
June). Online Detection of Stalling and Scrubbing
in Adaptive Video Streaming. In 2019 International
Symposium on Modeling and Optimization in Mobile,
Ad Hoc, and Wireless Networks (WiOPT) (pp. 1-8).
IEEE.
ICSOFT 2021 - 16th International Conference on Software Technologies
604
