
A Study on Model-based Optimization of Vaccination Strategies against
Epidemic Virus Spread
Zonglin Liu, Muhammed Omayrat and Olaf Stursberg
Control and System Theory, Dept. of Electrical Engineering and Computer Science, University of Kassel, Germany
Keywords:
Epidemic Modeling, Markov Process, Infection Control, Optimal Control, Biomedical Systems.
Abstract:
This paper aims at applying optimal control to investigate different vaccination strategies against the epidemic
spread of viral diseases. Background of the study is the situation in the first half of 2021, when many countries
started their vaccination procedures against the COVID-19 disease, but suffered from shortages of vaccines,
such that the efficient distribution of the available amount of vaccine turned out to be crucial to mitigate the
pandemic. The paper first suggests an extended version of a known model of virus spread in order include
the vaccination process. Based on this model, the formulation and solution of optimization problems is used
to determine how available vaccine should be distributed over different age-groups of the population to min-
imize virus spread. Effectiveness of the obtained strategies compared to standard ones is demonstrated in
simulations.
1 INTRODUCTION
In 2020, the outbreak and rapid spread of COVID-
19 affected the life of almost everyone on the planet.
Facing high infection and mortality rates, as well as
the absence of efficient treatment to patients, strict in-
tervention policies (such as lock-down of cities and
restricting social life) were deployed by the govern-
ments to control the spread of the virus. Effectiveness
of these policies, however, were barely satisfactory in
many countries for several months with respect to the
daily number of active cases and the number of fatal-
ities. The successful development of vaccines in the
beginning of 2021, led to the hope that life may re-
turn to normal rather quickly, but limited production
capacities of the vaccines led to the situation that only
a small shares of the population could be vaccinated
during the first half of 2021. Thus, the question of
how to control the vaccination process subject to the
given capacity constraints turned out to be crucial to
mitigate the pandemic – and this, of course, is a cen-
tral question to any future pandemic virus disease.
Before the outbreak of COVID-19, different vac-
cination strategies had been proposed in literature,
including the uniform strategy, see (Pastor-Satorras
et al., 2003), the targeted strategy, see (Liu et al.,
2003), the random strategy, see (Zanette and Kuper-
man, 2002), and the acquaintance strategy, see (Co-
hen et al., 2003). (Preciado et al., 2013) considered
optimal vaccination strategies by taking the vaccina-
tion cost into account, using a Susceptible-Infected-
Susceptible (SIS) epidemic model (see (Kermack and
McKendrick, 1932), (Ganesh et al., 2005)) for de-
scribing the virus spread. (Peng et al., 2010) followed
a similar pattern to develop an optimal vaccination
strategy, but considered additional constraints in op-
timization of the SIS model. (Wan et al., 2007) fo-
cused on the case that the vaccination resources are
limited, and they exploited the topologicalstructure of
the network to eliminate the virus. The resulting vac-
cination strategy was then tested on a model for the
SARS transmission in 2003. The work by (Gourdin
et al., 2011) investigated how to efficiently distribute
available medicine to minimize the overall infection.
Unlike vaccines, which reduce the individual infec-
tion rate, the medicine in the latter work is assumed
to increase the individual curing rate.
Most of these strategies are based on the SIS
model, in which only two states of the individuals are
modelled, namely, to be susceptible for the virus or
being infected. Experiences from COVID-19 have
shown, however, that aspects like the questions of
whether an infected person has symptoms or not, or of
whether she/he can be tested in time (and is isolated
before infecting others) are decisive for the evolution
of the virus spread. Accordingly, the determination
of an optimal (or at least good) vaccination strategy
must also take these aspects into account. In addition,
630
Liu, Z., Omayrat, M. and Stursberg, O.
A Study on Model-based Optimization of Vaccination Strategies against Epidemic Virus Spread.
DOI: 10.5220/0010604006300637
In Proceedings of the 18th International Conference on Informatics in Control, Automation and Robotics (ICINCO 2021), pages 630-637
ISBN: 978-989-758-522-7
Copyright
c
2021 by SCITEPRESS – Science and Technology Publications, Lda. All rights reserved

most of the work mentioned above also assumed that
the population can be modeled homogeneously in the
sense that the same rates of infections, courses of de-
veloping symptoms or being cured apply to anyone.
Observations for the first year of COVID-19 clearly
showed differences, however, with respect to senior
members of the population have significantly higher
mortality rates and lower curing rates than younger
generations.
To capture such characteristics, this paper first re-
views in Sec. 2 recent work on COVID-19 modeling,
and then extends the model proposed in (Giordano
et al., 2020) by including the vaccination process in
Sec. 2. Note that the selected model was proposed to
account for the course of the COVID-19 pandemic in
Italy and it includes already more states than the SIS-
model, but does not account for vaccination. Based
on the extended model, optimal control problems are
formulated and solved in order to determine optimal
vaccination strategies in Sec. 3. The solution takes
into account different age groups of the population
and heterogeneity with respect to infection and curing
rates, as well as different contact situations and limi-
tations of the amount of available vaccines. In Sec. 4,
the computed strategies are simulated exemplarily for
a mid-size city and compared to alternative strategies,
before Sec. 5 concludes the paper.
2 THE EPIDEMIC MODEL
Most literature on epidemic modeling uses the SIS
model to describe the spread of a virus. In this
rather simple model, only two states of any individ-
ual, susceptible and infected, are considered. After
the first outbreak of the COVID-19 pandemic, dif-
ferent groups have invested effort into adapting the
SIS model to the characteristics of this disease: The
work in (Della et al., 2020) considered the networked
structure of different regions in Italy and extended the
SIS model with four more states, i.e., quarantined,
hospitalized, recovered, and deceased. In the work
of (Nda¨ırou et al., 2021), even more COVID-19 re-
lated states are included and the influence of super-
spreading individuals are studied. In (Chaturvedi
and Chakravarty, 2021), the authors applied the SIR
model (with R for recovered) to provide a predic-
tive analysis of when the pandemic can be ended
with the help of vaccination. Among these efforts,
the so-called SIDARTHE model, which was proposed
in (Giordano et al., 2020) and is shown by the part
marked in black in Fig. 1, has been widely adopted
in different work, see (K¨ohler et al., 2020; L´opez and
Rod´o, 2020).
Ineffective
vaccination
Effective
vaccination
Contagion
Contagion
Diagnosis
Diagnosis
Symptoms
Symptoms
Critical
Critical
Death
Healing
Healing
S
i
I
i
D
i
A
i
R
i
T
i
H
i
E
i
U
i
α
i
, β
i
, γ
i
, δ
i
ˆ
α
i
,
ˆ
β
i
,
ˆ
γ
i
,
ˆ
δ
i
χ
i
(t)
ε
i
η
i
ζ
i
ψ
i
(t)
λ
i
κ
i
σ
i
ρ
i
ξ
i
θ
i
µ
i
υ
i
τ
i
Figure 1: The states and transitions in black represent the
original SIDARTHE model, while the parts in red are newly
added to model the vaccination process, as well as are the
indices i to model different groups of persons.
The SIDARTHE model, distinguishes the follow-
ing health status: being susceptible (S
i
), infected (I
i
),
diagnosed (D
i
), ailing (A
i
), recognized (R
i
), threat-
ened (T
i
), healed (H
i
), and extinct (E
i
). The corre-
sponding states represent the percentage of persons
of a given population with the corresponding health
status, and the changes of these percentages is mod-
eled stochastically by a continuous-time Markov pro-
cess. The first extension of this model compared to
earlier papers is to refer to a set of n groups of per-
sons, where the index i ∈ N = {1, ·· · , n} refers to one
these groups. This extension will allow later to refer
to a certain age-group of the population. The sum of
the percentages over the discrete states of the Markov
process for a single group i is always one.
Note that, although the SIDARTHE model can
well represent the development of the pandemic, it
was proposed in March 2020, when vaccines were
still not yet in sight. This can be noticed from the
black part in Fig. 1, since the health status cannot
transition directly from S
i
to H
i
without being in-
fected. Accordingly, the SIDARTHE model is ex-
tended in this paper also to contain the vaccination
process (see the red part in Fig. 1). This includes the
addition of one state U
i
referring to the percentage of
people in group i, for whom the vaccine is ineffective.
In addition, three new transitions are also assigned,
namely, from S
i
to H
i
, from S
i
to U
i
, and from U
i
to
I
i
. In order to model the evolution of the probability
distribution over the discrete states for group i ∈ N,
the following nonlinear dynamics is selected:
˙
S
i
(t) = −S
i
(t)
∑
j∈N
W
ij
(α
i
I
j
(t) + β
i
D
j
(t) + γ
i
A
j
(t)
+ δ
i
R
j
(t)) − (χ
i
(t) + ψ
i
(t))S
i
(t) (1)
A Study on Model-based Optimization of Vaccination Strategies against Epidemic Virus Spread
631

˙
U
i
(t) = −U
i
(t)
∑
j∈N
W
ij
(
ˆ
α
i
I
j
(t) +
ˆ
β
i
D
j
(t) +
ˆ
γ
i
A
j
(t)
+
ˆ
δ
i
R
j
(t)) + χ
i
(t)S
i
(t) (2)
˙
I
i
(t) = S
i
(t)
∑
j∈N
W
ij
(α
i
I
j
(t) + β
i
D
j
(t) + γ
i
A
j
(t)
+ δ
i
R
j
(t)) − (ε
i
+ ζ
i
+ λ
i
)I
i
(t) +U
i
(t)
∑
j∈N
W
ij
(
ˆ
α
i
I
j
(t)
+
ˆ
β
i
D
j
(t) +
ˆ
γ
i
A
j
(t) +
ˆ
δ
i
R
j
(t)) (3)
˙
D
i
(t) = ε
i
I
i
(t) − (η
i
+ ρ
i
)D
i
(t) (4)
˙
A
i
(t) = ζ
i
I
i
(t) − (θ
i
+ µ
i
+ κ
i
)A
i
(t) (5)
˙
R
i
(t) = η
i
D
i
(t) + θ
i
A
i
(t) − (υ
i
+ ξ
i
)R
i
(t) (6)
˙
T
i
(t) = µ
i
A
i
(t) + υ
i
R
i
(t) − (σ
i
+ τ
i
)T
i
(t) (7)
˙
H
i
(t) = λ
i
I
i
(t) + ρ
i
D
i
(t) + κ
i
A
i
(t) + ξ
i
R
i
(t) + σ
i
T
i
(t)
+ ψ
i
(t)S
i
(t) (8)
˙
E
i
(t) = τ
i
T
i
(t) (9)
For consistent initialization of the model in an initial
time t
0
, it is required for any i ∈ N that the sum of
all states is one. Note that the model also satisfies
˙
S
i
(t) +
˙
U
i
(t) +
˙
I
i
(t) +
˙
D
i
(t) +
˙
A
i
(t) +
˙
R
i
(t) +
˙
T
i
(t) +
˙
H
i
(t) +
˙
E
i
(t) = 0 at any time t for any choice of pa-
rameters. These are denoted by α
i
, β
i
, γ
i
, δ
i
, ε
i
, ζ
i
,
λ
i
, η
i
, θ
i
, υ
i
, ξ
i
, τ
i
, ρ
i
, σ
i
, µ
i
, and model the transi-
tion rates in between the pairs of corresponding states.
The different contagion parameters α
i
, β
i
, γ
i
, δ
i
in the
transition from S
i
to I
i
are due to contacts between a
susceptible person and an infected, a diagnosed, an
ailing, or a recognized person according to the orig-
inal paper in (Giordano et al., 2020). These param-
eters together with other transitions rates in Fig. 1
are assumed to be known
1
, but differ among the dif-
ferent groups i ∈ N. In detail and compared to the
original SIDARTHE model, the new model here cov-
ers the following effects in addition: 1.) a success-
ful vaccination step (transition from S
i
to H
i
) with
rate ψ
i
(t) ∈ R
≥0
. The rates ψ
i
(t) will be used as in-
puts determining the vaccination strategy to be opti-
mized in the coming section; 2.) an ineffective vac-
cination step (from S
i
to U
i
) with rate χ
i
(t) ∈ R
≥0
,
where χ
i
(t) is assumed to be proportional to ψ
i
(t),
i.e., χ
i
(t) = q · ψ
i
(t), q ∈ R
>0
; 3.) an infection step
(from U
i
to I
i
) with respective contagion parameters
ˆ
α
i
,
ˆ
β
i
,
ˆ
γ
i
, and
ˆ
δ
i
. Note that the labeling of this tran-
sition with four rates refers to the shares that a per-
son in state U
i
gets infected by contact with a person
in state I
i
, D
i
, A
i
or R
i
respectively (the same princi-
1
In practice, one can only estimate these parameters,
leading to model uncertainty. In order to consider e.g. pa-
rameter intervals, extensions to techniques of robust predic-
tive control could be employed, see (Campo and Morari,
1987), but this is outside of the scope of the present paper.
ple underlies the assignment of four parameters to the
transition from S
i
to I
i
). Note further that the conta-
gion parameters assigned toU
i
→ I
i
are different from
those assigned to S
i
→ I
i
to account for the possibil-
ity that a vaccinated person, which is unaware of the
fact that the vaccination was not successful, will likely
follow relaxed contact patterns, compared to persons
that still wait to be vaccinated.
In order refer to the above model in brief, let it be
denoted by:
˙x
i
(t) = f(x
i
(t), ψ
i
(t)), x
i
(t
0
) = x
i,0
(10)
with state vector x
i
(t) := (S
i
(t),U
i
(t), I
i
(t),
D
i
(t), A
i
(t), R
i
(t), T
i
(t), H
i
(t), E
i
(t)), and the ini-
tial state x
i,0
. Furthermore, the model aims at
considering the spread of the virus across different
age groups of the population. In order to formalize
the contacts between different age groups, and thus
the possibility that infections occur across the groups,
an undirected graph G = {N, E} is set up. In here,
the set N of nodes models the different age groups,
with indices i ∈ N as before. The set E of undirected
edges models the contact between a pair of groups.
To an edge e
i, j
∈ E between the groups with indices
i and j, a positive weight W
ij
∈ R
>0
is assigned,
representing that infections in group j can affect the
infection in group i (and vice versa), see also (1) - (3)
in the model. More precisely, a weight W
ij
models
the average share of time that a person from group
i spends with a person from group j. Accordingly,
a self-loop transition with weight W
ii
is introduced
for any node, and the matrix W ∈ R
n×n
is chosen as
doubly stochastic matrix, i.e.,
∑
j∈N
W
ij
= 1 for all
i ∈ N, and
∑
i∈N
W
ij
= 1 for all j ∈ N.
Note that the model in the present form does not
explicitly account for the necessity that two (or more)
shots of vaccine may be necessary to get from state
S
i
to H
i
. This could be included by introducing inter-
mediate state in between S
i
→ H
i
and S
i
→ U
i
, but is
omitted here to not overload the model.
3 DETERMINATION OF
OPTIMIZED VACCINATION
STRATEGIES
Based on the model introduced before, this section
proposes to determine vaccination strategies for dif-
ferent age-groups of the population based on optimal
control principles. The underlying assumption is that
there is a shortage of available vaccine (as was true for
the COVID-19 pandemic in the first half year after de-
veloping the vaccine). This, together with the obser-
vation that the infection has, on average, more severe
ICINCO 2021 - 18th International Conference on Informatics in Control, Automation and Robotics
632

effects the older the infected person is, motivates to
divide the population into n groups according to their
age. For any age-group with index i ∈ N = {1, ··· , n},
let its share of the total population be denoted by v
i
,
and
∑
i∈N
v
i
= 1. The vaccination of different age
groups (represented in the model from Sec. 2 by the
rates ψ
i
(t) and χ
i
(t)) as well as contacts between age
groups (modelled by the weightsW
ij
) can be expected
to have significant impact on the evolution of the epi-
demic.
3.1 Optimization Objectives and
Constraints
In order to set up the optimal control formulation, first
let an initial time t
0
be given as well as a time inter-
val [t
0
,t
0
+ H], where H is the number of days over
which the vaccine is distributed. Assume that the vac-
cination strategy can only be adjusted every T days of
the horizon, leading to totally
H
T
decision steps. Let
k ∈ { 0, 1, ··· ,
H
T
−1} index these steps. Once the strat-
egy is determined for k it is held constant for the com-
ing T days. Accordingly, the vaccination rate applied
to an age-group i ∈ N on the interval [k· T, (k+ 1) · T[
is referred to by ψ
i,k
. The maximum amount of vac-
cine available for step k over all groups i is denoted
by Ψ
max,k
, leading to the following constraint:
∑
i∈N
P · v
i
· (ψ
i,k
+ χ
i,k
) ≤ Ψ
max,k
, (11)
with a population size P , and P · v
i
representing the
size of age-group i. Corresponding to the relation be-
tween χ
i
(t) and ψ
i
(t) as mentioned in Sec. 2, it fol-
lows that: χ
i,k
:= q · ψ
i,k
.
Given the constraint (11), the task is
now to optimize the vaccination strategy
ψ := (ψ
0
, ψ
1
, .. . ,ψ
H
T
−1
) with ψ
k
= (ψ
1,k
, .. . ,ψ
n,k
)
T
for all age-groups in all decision steps, in order to
minimize the infected share of the population (i.e., all
persons assigned to the states I
i
, D
i
, A
i
, R
i
, T
i
in Fig.
1), as well as the death cases (referring to the state
E
i
). To consider, in addition, the vaccination costs,
an additional term can be introduced, leading to the
following cost function:
J(ψ) :=
∑
i∈N
Z
t
0
+H
t
0
P v
i
(c
1
· (I
i
(t) + D
i
(t) + A
i
(t)
+ R
i
(t) + T
i
(t)) + c
2
· E
i
(t))dt
+c
3
·
∑
k∈{0,···,
H
T
−1}
ψ
i,k
. (12)
The parameters c
1
, c
2
and c
3
(all positive) denote ap-
propriate weights of the terms of the cost function.
Note that J(ψ) may be extended to additional cost
terms to account, e.g., for costs of testing. Likewise,
additional constraints, as limitations in available staff
for vaccination could be considered.
3.2 The Optimization Problem
In order to determine an optimized vaccination strat-
egy, denoted by ψ
∗
, the aforementioned objectives
and constraints together with the model (10) are cast
into the following optimization problem:
Problem 1.
min
ψ
J(ψ) (13)
s.t. for all i ∈ N and given G :
x
i
(t
0
) = x
i,0
, t ∈ [t
0
,t
0
+ H],
dynamics (10),
for all k ∈ {0, . . . ,
H
T
− 1} : (14)
ψ
i,k
≥ 0, (15)
∑
i∈N
P · v
i
· (1+ q)ψ
i,k
≤ Ψ
max,k
. (16)
The optimized strategy ψ
∗
is then determined by
solving this nonlinear continuous-time optimization
problem. The constraint (14) is a local constraint of
group i, while (16) determines a coupling constraint.
The dynamics of the groups is also coupled through
the matrix W affecting (1) - (3).
To solve Problem 1, one can apply, e.g., tech-
niques of multiple shooting, see e.g. (Bock et al.,
2000), which casts the original problem into a finite
dimensional nonlinear programming problem by pa-
rameterizing the input and state space. One should
note, however, that one can only hope to determine a
sub-optimal strategy for the given non-convex prob-
lem (this is why it is referred to an optimized strategy,
rather than the optimal one).
4 SIMULATION
To illustrate the computation of optimized vaccination
strategies and to discuss a number of effects, consider
a midsize city with a population of P = 200, 000. Ac-
cording to a statistics of distribution of the population
over the age groups i ∈ N (in Germany for 2021), con-
sider the following values for the city:
Table 1: Distribution over age groups.
Age 0-19 20-39 40-59 60-79 80+
v
i
18.5% 24.6% 28.8% 21.6% 6.5%
A Study on Model-based Optimization of Vaccination Strategies against Epidemic Virus Spread
633
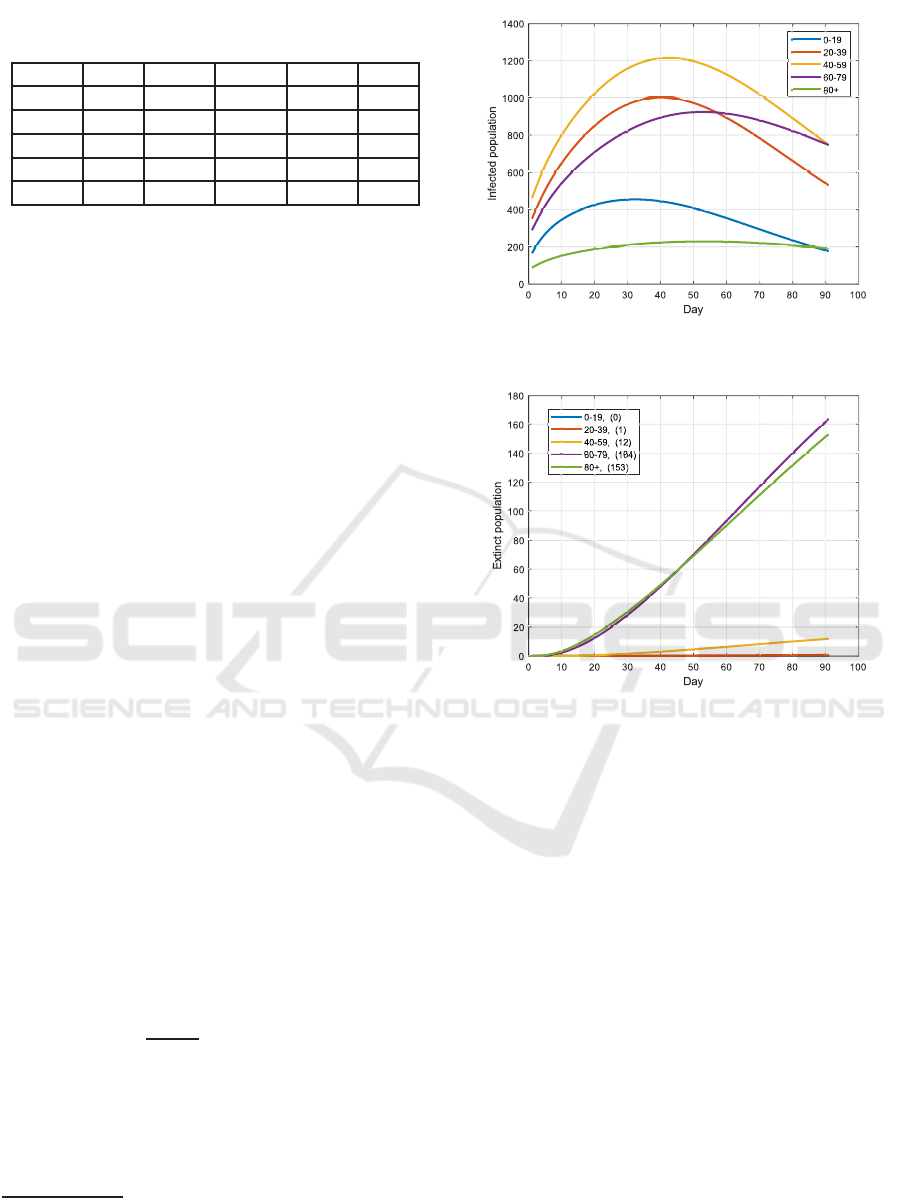
Table 2: Contacts between different age-groups during the
epidemic.
Age 0-19 20-39 40-59 60-79 80+
0-19 31% 34% 25% 8% 2%
20-39 34% 45% 15% 5% 1%
40-59 25% 15% 30% 20% 10%
60-79 8% 5% 20% 50% 17%
80+ 2% 1% 10% 17% 70%
The estimated average time (in percentage) per-
sons of one group spend with those of another is listed
in Table 2, representing the entries of matrix W. Note
that Table 2 also reflects certain intervention policies
deployed in certain phases in Germany, such as that
visiting nursing homes was forbidden (such that the
most senior group had to spent most of their time with
its own), while schools were open during that phase.
The parameters contained in the dynamics (1) - (9)
are chosen similar to (Giordano et al., 2020), except
for the following:
• The contagion parameters
ˆ
α
i
,
ˆ
γ
i
for the transition
from U
i
→ I
i
are larger than for S
i
→ I
i
. This aims
at reflecting the effect that people are less cautious
to the virus after being vaccinated, although the
vaccination may be ineffective.
• Effectiveness of the vaccine is assumed to be 90%
for all age-groups
2
, i.e., χ
i
:= 0.11ψ
i
, i ∈ N.
The initial states for t
0
are chosen according to the
pandemic situation of the city at the end of 2020. The
considered horizon is H = 90 days, and the vaccina-
tion strategy can be changed every T = 30 days (thus,
in total 3 decision steps). The weights in J satisfy
c
2
> c
1
≫ c
3
, i.e., the main goal is to reduce the over-
all number of casualties, while the vaccine costs can
be neglected.
4.1 Uniform Vaccination Strategy
Before the optimized strategy is tested, a uniform
vaccination strategy is first simulated: When assum-
ing that the availability of the vaccine is constant in
all decision steps, i.e., Ψ
max,k
:= Ψ
max
, ∀k ∈ {0, 1, 2},
the ψ
i,k
in the uniform vaccination strategy takes a
value of: ψ
i,k
:=
Ψ
max
P ·(1+q)
for all i ∈ N. The outcome
by adopting this strategy is illustrated in Fig. 2 and
3. Obviously, most of the casualties occur in the
senior groups 60 - 79 and 80+, although the number
of infections (over the states infected (I
i
), diagnosed
(D
i
), ailing (A
i
), recognized (R
i
) and threatened (T
i
))
2
This may be extended to considering different effec-
tiveness rates of the vaccine for different age-groups, or to
different rates for different types of vaccines.
Figure 2: Number of infections when applying the uniform
strategy over H = 90 days.
Figure 3: Casualties for each age group with the uniform
strategy at the end of the 90 days.
in these groups are not the highest. This is mainly
due to the high mortality rate of the two groups.
4.2 Optimized Vaccination Strategy
In the second test, the Problem 1 is solved to deter-
mine the optimal vaccination strategy. The resulting
ψ
∗
i,k
for each group is shown in Fig. 4. By adopting
this strategy, the evolution of the infections and ca-
sualties are illustrated in Fig. 5 and 6. Compared to
the uniform strategy, more infected cases occur in the
groups 20 - 39 and 40 - 59, while less in the groups 60
- 79 and 80+. The casualties for the two senior groups,
however, is significantly reduced by adopting the op-
timized strategy, and this also leads to a decrease of
the total number of casualties from 329 to 174, see
Fig. 7 and 8.
The optimized strategy is further compared to the
popular strategy of first vaccinating the older genera-
tions, see Fig. 9 and 10. In this strategy, all available
vaccine is first provided to the group 80+ in the steps
ICINCO 2021 - 18th International Conference on Informatics in Control, Automation and Robotics
634
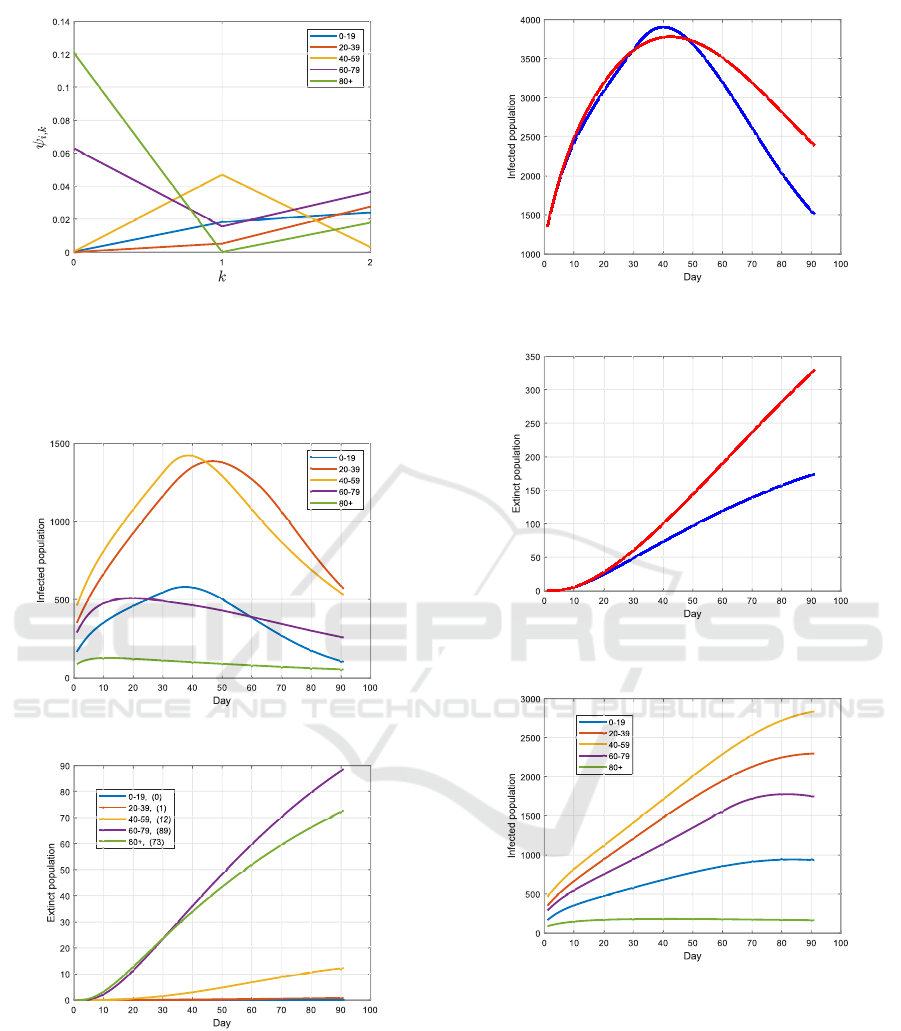
Figure 4: The optimized vaccination strategy from Problem
1: in k = 0, the complete available vaccine is distributed to
the groups 60 - 79 and 80+; in k = 1, most of the vaccine
is distributed to the group 40 - 59, 60 - 79 and 0 - 19; in
the last step k = 2, the vaccine is distributed to all groups
besides the group 40 - 59.
Figure 5: Infections with the optimized strategy.
Figure 6: Casualties with the optimized strategy.
k = 0 and k = 1, and then to the group 60 - 79 for
k = 2. One can notice, however, that only the number
of casualties in the group 80+ is slightly reduced com-
pared to the uniform strategy, while much more occur
in the group 60 - 79. This is due to the larger size of
the latter group than the 80+ group, and to the more
frequent contacts of this group with younger persons.
Uniform strategy
Optimized strategy
Figure 7: Infections over all age-groups by adopting the
uniform vaccination strategy and the optimized one.
Uniform strategy (329)
Optimized strategy (174)
Figure 8: Casualties over all age-groups by adopting the
uniform vaccination strategy and the optimized one.
Figure 9: Infections when applying the older-first strategy.
The immunity of the group 60 - 79 is, however, only
slightly better than for the 80+ group, but much worse
than for the junior groups. Accordingly, the group 60
- 79 should not be ignored in the first step of the vac-
cination process based on the simulation results.
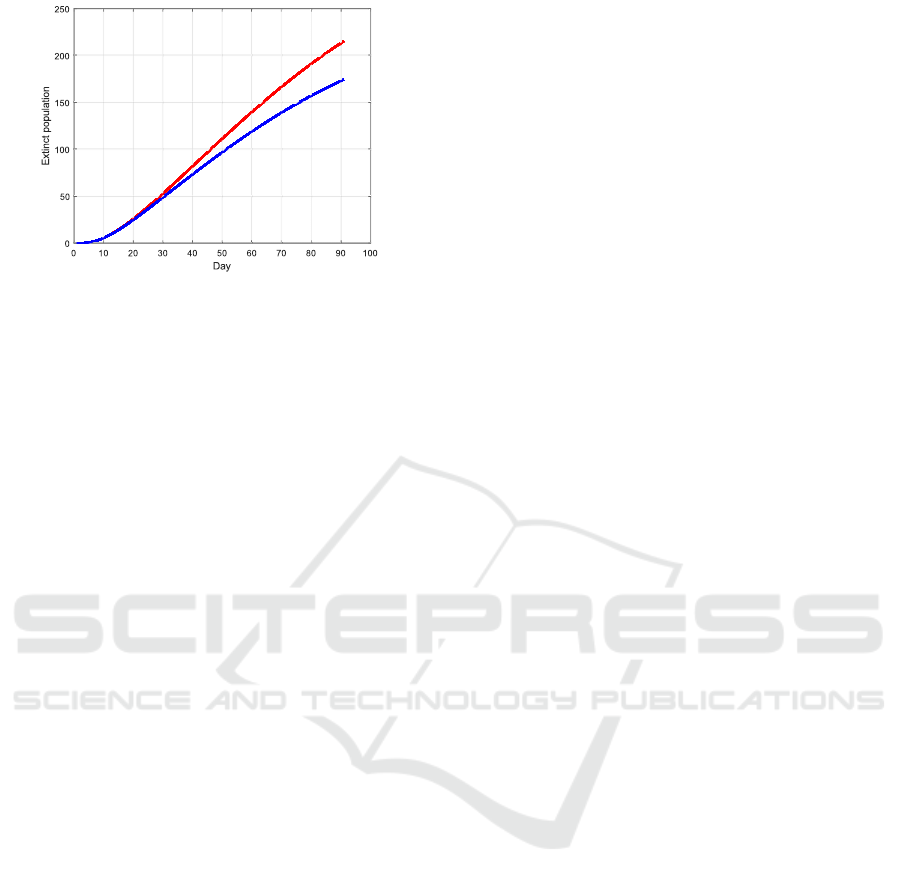
4.3 Increasing Availability of Vaccine
In the third test, it is assumed that more vaccine
can be provided over time, i.e., Ψ
max,k
:= 2
k
· Ψ
max
,
A Study on Model-based Optimization of Vaccination Strategies against Epidemic Virus Spread
635
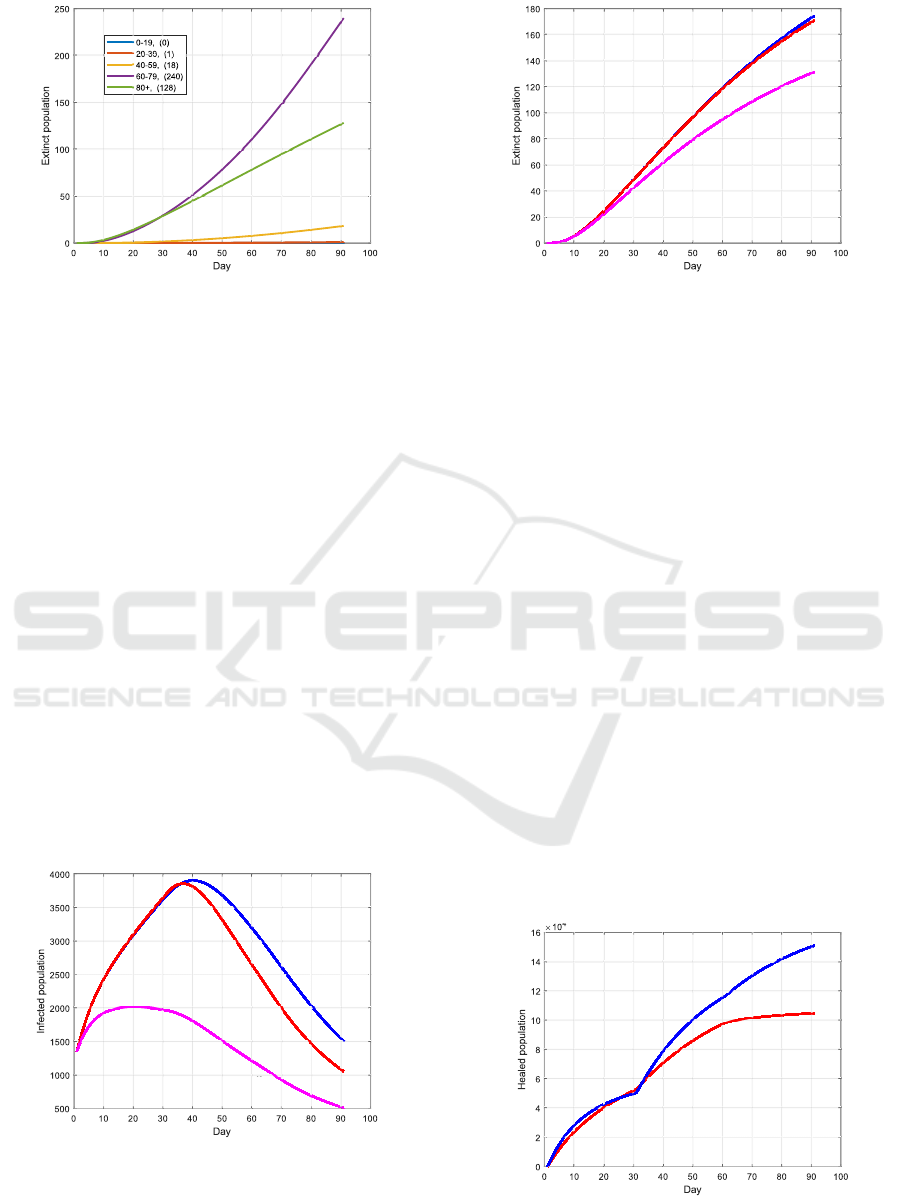
Figure 10: Casualties when applying the older-first strategy.
k ∈ {0, 1, 2}. The new outcome from solving Prob-
lem 1 is illustrated in Fig. 11 and 12. Compared with
the last test, in which the available amount vaccine is
constant over time, the total number of casualties has
been barely reduced, but a decrease of the total num-
ber of infections can be observed after 30 days. In an-
other test with Ψ
max,k
:= 2
k
·Ψ
max
, the infections rates
for the transitions S
i
→ I
i
and U
i
→ I
i
are reduced by
20% compared to the test before for all k ∈ {0, 1, 2}.
This may be achieved by additional intervention poli-
cies such as lock down. Hereby, the number of infec-
tions as well as the number of casualties can be sig-
nificantly reduced, as shown in Fig. 11 and 12 – this
result shows that one should not only rely on vaccina-
tion to mitigate the epidemic fast, i.e., the vaccination
strategy and intervention policies should be optimized
at the same time.
4.4 Effectiveness of the Vaccine
In the last test, a lower effectiveness of the vaccine
(compared to before) is investigated. By assuming
that the effectiveness is χ
i
:= 0.5ψ
i
instead of χ
i
:=
Increased availability
Constant availability
Increased + Lockdown
Figure 11: Infections over all age-groups when: 1.) the
availability of vaccine is constant over time; 2.) the amount
of vaccine increases over the steps; 3.) additional interven-
tion policies are deployed and the amount of vaccine in-
creases over k.
Increased availability (171)
Constant availability (174)
Increased + Lockdown (131)
Figure 12: Casualties by applying the strategies in Fig. 11.
0.11ψ
i
, i ∈ N, the outcome from solving Problem 1 is
shown in Fig. 13 and 14. As could be expected, this
change will lead to less healed cases at the end of the
horizon, as well as an increase of casualties.
5 CONCLUSION
In this paper, the known SIDARTHE model has been
extended in different respects in order to be tailored to
the study of vaccination procedure against epidemic
virus spread. The motivation of these extensions is
the typical shortage of vaccine, if a new virus spreads
and the vaccine first has to be developed. To effec-
tively combat the epidemic with a limited amount of
vaccine, this paper has shown that the solution of opti-
mal control problems serves to determine strategies to
optimally distribute the vaccine among different age-
groups. The contacts between the age-groups, hetero-
geneous infection and mortality rates over the groups,
as well as limited effectiveness of the vaccine can all
be taken into account in the optimization. The model
proposed here can also be adapted straightforwardly
to study some additional problems occurring during
vaccination procedures, such as the effect that a vac-
χ
i
:= 0.5ψ
i
χ
i
:= 0.5ψ
i
χ
i
:= 0.11ψ
i
Figure 13: Number of healed persons of all age-groups for
different effectiveness of the vaccine.
ICINCO 2021 - 18th International Conference on Informatics in Control, Automation and Robotics
636
χ
i
:= 0.5ψ
i
(215)
χ
i
:= 0.11ψ
i
(174)
Figure 14: A less effective vaccine leads to an increase of
the total number of casualties.
cine is less effective or bears danger for certain age
groups, or that a vaccinated person would not get ill
but may still be contagious in case of infection.
Finally, for the situation that the transition rates or
model parameters are only knownwithin certain inter-
vals, the optimal control problem could be modified
into one of optimization under uncertainty, e.g. adopt-
ing techniques of robust optimal control. To account
for the change of the parameters over time (e.g. due
to a virus mutation), the solution of the optimal con-
trol problem could be recursively solved over time,
leading to a strategy of model predictive control.
REFERENCES
Bock, H., Diehl, M., Leineweber, D., and Schl¨oder, J.
(2000). A direct multiple shooting method for real-
time optimization of nonlinear DAE processes. In
Nonlinear model predictive control, pages 245–267.
Springer.
Campo, P. and Morari, M. (1987). Robust model predictive
control. In American control conf., pages 1021–1026.
IEEE.
Chaturvedi, D. and Chakravarty, U. (2021). Predictive anal-
ysis of COVID-19 eradication with vaccination in In-
dia, Brazil, and USA. Infection, Genetics and Evolu-
tion, 92:104834.
Cohen, R., Havlin, S., and Ben-Avraham, D. (2003).
Efficient immunization strategies for computer net-
works and populations. Physical review letters,
91(24):247901.
Della, F., Salzano, D., Di Meglio, A., De Lellis, F., Corag-
gio, M., Calabrese, C., Guarino, A., Cardona-Rivera,
R., De Lellis, P., Liuzza, D., et al. (2020). A network
model of Italy shows that intermittent regional strate-
gies can alleviate the COVID-19 epidemic. Nature
communications, 11(1):1–9.
Ganesh, A., Massouli´e, L., and Towsley, D. (2005). The ef-
fect of network topology on the spread of epidemics.
In 24th Joint IEEE Conf. of the Computer and Com-
munications Societies., volume 2, pages 1455–1466.
Giordano, G., Blanchini, F., Bruno, R., Colaneri, P., Di Fil-
ippo, A., Di Matteo, A., and Colaneri, M. (2020).
Modelling the COVID-19 epidemic and implementa-
tion of population-wide interventions in Italy. Nature
Medicine, pages 1–6.
Gourdin, E., Omic, J., and Van Mieghem, P. (2011). Op-
timization of network protection against virus spread.
In 8th Int. IEEE Workshop on the Design of Reliable
Communication Networks, pages 86–93.
Kermack, W. and McKendrick, A. (1932). Contributions to
the mathematical theory of epidemics. ii.—the prob-
lem of endemicity. Proc. of the Royal Society of Lon-
don. Series A, 138(834):55–83.
K¨ohler, J., Schwenkel, L., Koch, A., Berberich, J., Pauli,
P., and Allg¨ower, F. (2020). Robust and optimal pre-
dictive control of the COVID-19 outbreak. Annual
Reviews in Control.
Liu, Z., Lai, Y., and Ye, N. (2003). Propagation and immu-
nization of infection on general networks with both
homogeneous and heterogeneous components. Physi-
cal Review E, 67(3):031911.
L´opez, L. and Rod´o, X. (2020). The end of social con-
finement and COVID-19 re-emergence risk. Nature
Human Behaviour, 4(7):746–755.
Nda¨ırou, F., Area, I., Nieto, J., Silva, C., and Torres, D.
(2021). Fractional model of COVID-19 applied to
Galicia, Spain and Portugal. Chaos, Solitons & Frac-
tals, page 110652.
Pastor-Satorras, R., Vespignani, A., et al. (2003). Epidemics
and immunization in scale-free networks. Handbook
of Graphs and Networks, Wiley-VCH, Berlin.
Peng, C., Jin, X., and Shi, M. (2010). Epidemic thresh-
old and immunization on generalized networks. Phys-
ica A: Statistical Mechanics and its Applications,
389(3):549–560.
Preciado, V., Zargham, M., Enyioha, C., Jadbabaie, A., and
Pappas, G. (2013). Optimal vaccine allocation to con-
trol epidemic outbreaks in arbitrary networks. In 52nd
IEEE Conf. on Decision and Control, pages 7486–
7491.
Wan, Y., Roy, S., and Saberi, A. (2007). Network design
problems for controlling virus spread. In 46th IEEE
Conf. on Decision and Control, pages 3925–3932.
Zanette, D. and Kuperman, M. (2002). Effects of immu-
nization in small-world epidemics. Physica A: Statis-
tical Mechanics and its Applications, 309(3-4):445–
452.
A Study on Model-based Optimization of Vaccination Strategies against Epidemic Virus Spread
637
