
Estimating Territory Risk Relativity for Auto Insurance Rate Regulation
using Generalized Linear Mixed Models
Shengkun Xie
1
, Chong Gan
2
and Clare Chua-Chow
1
1
Global Management Studies, Ted Rogers School of Management, Ryerson University, Toronto, Canada
2
Department of Mathematics and Statistics, University of Guelph, Guelph, Canada
Keywords:
Generalized Linear Mixed Models, Rate-making, Insurance Rate Regulation, Business Data Analytics.
Abstract:
Territory risk analysis has played an essential role in auto insurance rate regulation. It aims to obtain a set
of regions to estimate their respective relativities to reflect the regional risk. Cluster as a latent variable has
not yet been considered in modelling the regional risk of auto insurance. In this work, spatially constrained
clustering is first applied to insurance loss data to form such regions. The generalized linear mixed model
is then proposed to derive the risk relativities for obtained clusters and then for each basic rating unit. The
results are compared to the ones from generalized linear models. The Forward Sortation Area (FSA) grouping
to a specific region by spatially constrained clustering is to reduce the insurance rate heterogeneity caused by
some smaller number of risk exposures. The spatially constrained clustering and risk relativity estimation help
obtain a set of territory risk benchmarks, which can be used in rate filings within the regulation process. It
also provides guidance for auto insurance companies on rate-making. The proposed methodologies could be
helpful and applicable in many other fields, including business data analytic.
1 INTRODUCTION
Auto insurance rate regulation plays a vital role in
insurance premium rate changes. The rate regulation
is through a rate filing review process. To apply
for a rate change, an insurance company needs
a detailed justification of the use of rate-making
methodologies and risk analysis at the company
level. From insurance regulators’ perspectives, to
make meaningful decisions on applications of rate
changes by insurance companies, an overview of how
rate-making methods work and how they impact the
overall risk at the industry level is required. This
may imply that a set of benchmark estimates as key
metrics used in the review process are essential.
Within auto insurance rate-making, territory risk
analysis is considered one of the most important
aspects due to the dominance of territory as a risk
factor in pricing. Therefore, the classification of
territorial risk and its relativity associated with
each territorial level requires considerable effort, in
particular, for rate regulation purposes. Because of
this, a fair amount of the work in territory analysis
has been done. (Brubaker, 1996; Xie, 2019; Zhang
and Miljkovic, 2019).
The generalized linear model (GLM) has been
widely used in rate-making and is now becoming a
standard approach in deriving risk relativity for a risk
factor at a given level (McClenahan, 2014; Xie and
Lawniczak, 2018). The main benefit of using GLM is
the statistical soundness and its superiority to many
other traditional methods such as linear models and
the minimum bias procedure (Brown, 1988). In fact,
auto insurance companies have widely used GLM for
rate-making and predictive modelling of insurance
risk (Antonio and Beirlant, 2014). However, GLM
aims at capturing the fixed effect contributed by the
risk factor at a given level, which may not be suffi-
cient to fully explain the variation for the response
variable. Although in many applications, explaining
data variation through an estimate of fixed effect
suffices, there are still some concerns in estimating
risk relativity for regulation purposes. In this work,
we try to address this issue within the domain of auto
insurance rate-making and rate regulation.
In territory risk analysis, the residential informa-
tion such as postal codes or zip codes is used as a
basic pricing unit (Yao, 2008). The risk relativity can
be calculated by determining the ratio of the loss cost
per rating unit and the overall average of all rating
units. The risk relativity is then used to calculate
insurance premiums. In rate regulation, often, postal
Xie, S., Gan, C. and Chua-Chow, C.
Estimating Territory Risk Relativity for Auto Insurance Rate Regulation using Generalized Linear Mixed Models.
DOI: 10.5220/0010601003290334
In Proceedings of the 10th International Conference on Data Science, Technology and Applications (DATA 2021), pages 329-334
ISBN: 978-989-758-521-0
Copyright
c
2021 by SCITEPRESS – Science and Technology Publications, Lda. All rights reserved
329

codes or zip codes are further grouped to form a
more prominent territorial region to contain more
risk exposures. This can better reflect the actual loss
pattern and stabilize the risk relativities to minimize
the fluctuation among the calculations using data
from different accident years. A spatial clustering
does this, and a more suitable number of clusters
to be formed to act as new pricing units. Since
postal codes or zip codes are nested in the city or
town, there may be another effect based on different
cities or towns. Those potential effects on insurance
loss may be, in fact, due to some factors associated
with the city or town. For instance, in a city where
commuting buses lack or public transportation is
relatively limited, people tend to drive more to work.
In this work, we propose a method of using Gen-
eralized Linear Mixed Models (GLMM) (Antonio
and Beirlant, 2007) to derive the risk relativity for
different clusters produced by a spatially constrained
clustering(Xie, 2019). GLMM is an extension of
GLM in which the model contains both fixed and
random effects. GLMM can further capture the
impact due to differences among cities or towns
such that the difference in risk relativity associated
with different cities can be better reflected. GLMM
has been successfully used in actuarial science as a
non-life rate-making technique(Jeong et al., 2017),
and a model for credibility(Antonio and Beirlant,
2007). It has also been applied to spatial analysis of
disease spread (Kleinschmidt et al., 2001). We apply
GLMM to model territorial risk in a novelty way and
estimate regional risk relativities. It is considered to
be an extension of the current approach that appeared
in(Xie and Lawniczak, 2018) by further addressing
the impact from other correlated factors on the
territorial risk relativities estimates.
This paper is organized as follows. In Section
2, the data and its basic processing are briefly intro-
duced. In Section 3, the proposed generalized linear
mixed models is discussed. In Section 4, the summary
of the main results are presented. In Section 5, we
conclude our findings and provide further remarks.
2 DATA
In this work, we apply our proposed method to a real
dataset coming from an auto insurance regulator in
Canada. This dataset includes the reported loss in-
formation from all auto insurance companies within
a province for accident years 2009 to 2011. It con-
sists of geographical loss information including postal
codes, cities, reported average loss cost and earned
exposures. The geographical information refers to the
residential places of insured drivers who had reported
the loss, rather than the place where the insured suf-
fered the accident. The reported average loss cost
is the projected ultimate expected loss. The earned
exposures refer to the total number of insured vehi-
cles within a policy year. In this dataset, we first re-
trieved all postal codes that are associated with the
same FSA, where FSA is the first three characters of
postal codes. For each FSA, the postal codes were
further geo-coded using a geo-coder. The obtained
geo-coding contains both latitude and longitude val-
ues that are used to represent the center of a given
FSA. The centroid of FSA is used to identify its loca-
tion.
3 METHODS
This work’s main objective is to estimate each clus-
ter’s risk relativity obtained from a spatial clustering.
At a given level, the relativity of a risk factor is the
risk level relative to the overall averages for all levels
that we consider. In this work, the loss cost at a given
level is divided by the average loss cost across all lev-
els within a risk factor to calculate the risk relativity.
Here we consider the territory risk. The level of terri-
tory risk is at the FSA level, and we try to derive the
relativity associated with each FSA. Data input to the
spatial clustering is three-dimensional, consisting of
normalized lost cost, normalized latitude and normal-
ized longitude. Although the optimal number of clus-
ters is important, it has been fully addressed in (Xie,
2019) using an entropy-based approach. This work is
considered a follow-up study after a spatial clustering
of loss data to determine each FSA’s relativity.
In rate-making, Generalized Linear Models
(GLM) have been widely used because an exponen-
tial family distribution is a better choice for the error
distribution instead of a normal distribution assump-
tion, which is the case in linear models. The main idea
of using GLM for territory risk analysis is to model a
transformation of the expected value of loss cost so
that the predictors have a linear relationship with the
transformed loss cost values. In territory analysis, the
loss cost is defined as the average loss level per vehi-
cle for a defined basic rating unit such as the postal
code. In this work, we extend GLM to the general-
ized linear mixed model (GLMM) (Antonio and Beir-
lant, 2007) to further explain the random effect from a
considered rating variable. Since a city has its own in-
frastructure and public transportation, the underlying
risk of causing accidents is dependent of a city. To
explain the GLMM, let us assume that the loss data
DATA 2021 - 10th International Conference on Data Science, Technology and Applications
330
has been spatially clustered to N clusters, and in total,
there are M different cities associated with this insur-
ance loss cost data. Therefore, the loss cost associ-
ated with cluster i and City j is defined as L
i j
, where
i = 1, 2, . . . , N and j = 1, 2, . . . , M. We further define
the expected value of loss cost as µ
i j
= E(L
i j
). This
expected value is then transformed by a given func-
tion g and defined as η
i
= g(µ
i j
). This transformation
function is called the link function. The model that
is used to explain the transformation function g is a
linear mixed effect model that contains both fixed and
random effects, and it can be written as follows:
g(µ
i j
) = β
0
+ β
1i
x
i
+ v
j
, (1)
where x
i
represents the fixed effect of the ith cluster,
and v
j
represents the random effect of City. In gener-
alized linear model, the variance of model residual ε
i j
is assumed to have the following functional relation-
ship with the mean response:
Var(ε
i j
) =
φV (µ
i j
)
ω
i j
, (2)
where V (x) is called a variance function. This is an
immediate result of the fact that the error distribution
belongs to the exponential family distribution. The
parameter φ scales the variance function V (x), and
ω
i j
is a constant assigning a weight. The case when
V (x) = 1 implies a normal distribution. If V (x) = x,
then the distribution is Poisson. If V (x) = x
2
, then it
is a gamma distribution, and if V (x) = x
3
, then it is
an inverse Gaussian distribution. These are the dis-
tributions used in this work. They are considered to
be some special cases of Tweedie distribution that of-
ten used in the actuarial domain(Xacur and Garrido,
2015).
To derive the relativities for each FSA, we first de-
termine the relativity of fixed effect of clusters, which
is exp{
ˆ
β
1i
} for the ith fixed effect. The purpose of
this is because the log link function is used there. The
estimate of v
j
is the conditional mode, which is the
difference between the average predicted response for
a given set of fixed-effect values and the response pre-
dicted for a particular individual. Technically speak-
ing, they are the solutions to a penalized weighted
least-squares estimation procedure. We can think of
these as individual-level effects, i.e. how much does
any individual lost cost differ from the population due
to the jth City? Because of this, the relativity corre-
sponding to jth City becomes exp{ ˆv
j
}. Therefore, the
relativities due to both fixed and random effect are
then calculated as exp{
ˆ
β
1i
+ ˆv
j
}, and then normalized
by the mean value of exp{
ˆ
β
1i
+ ˆv
j
}.
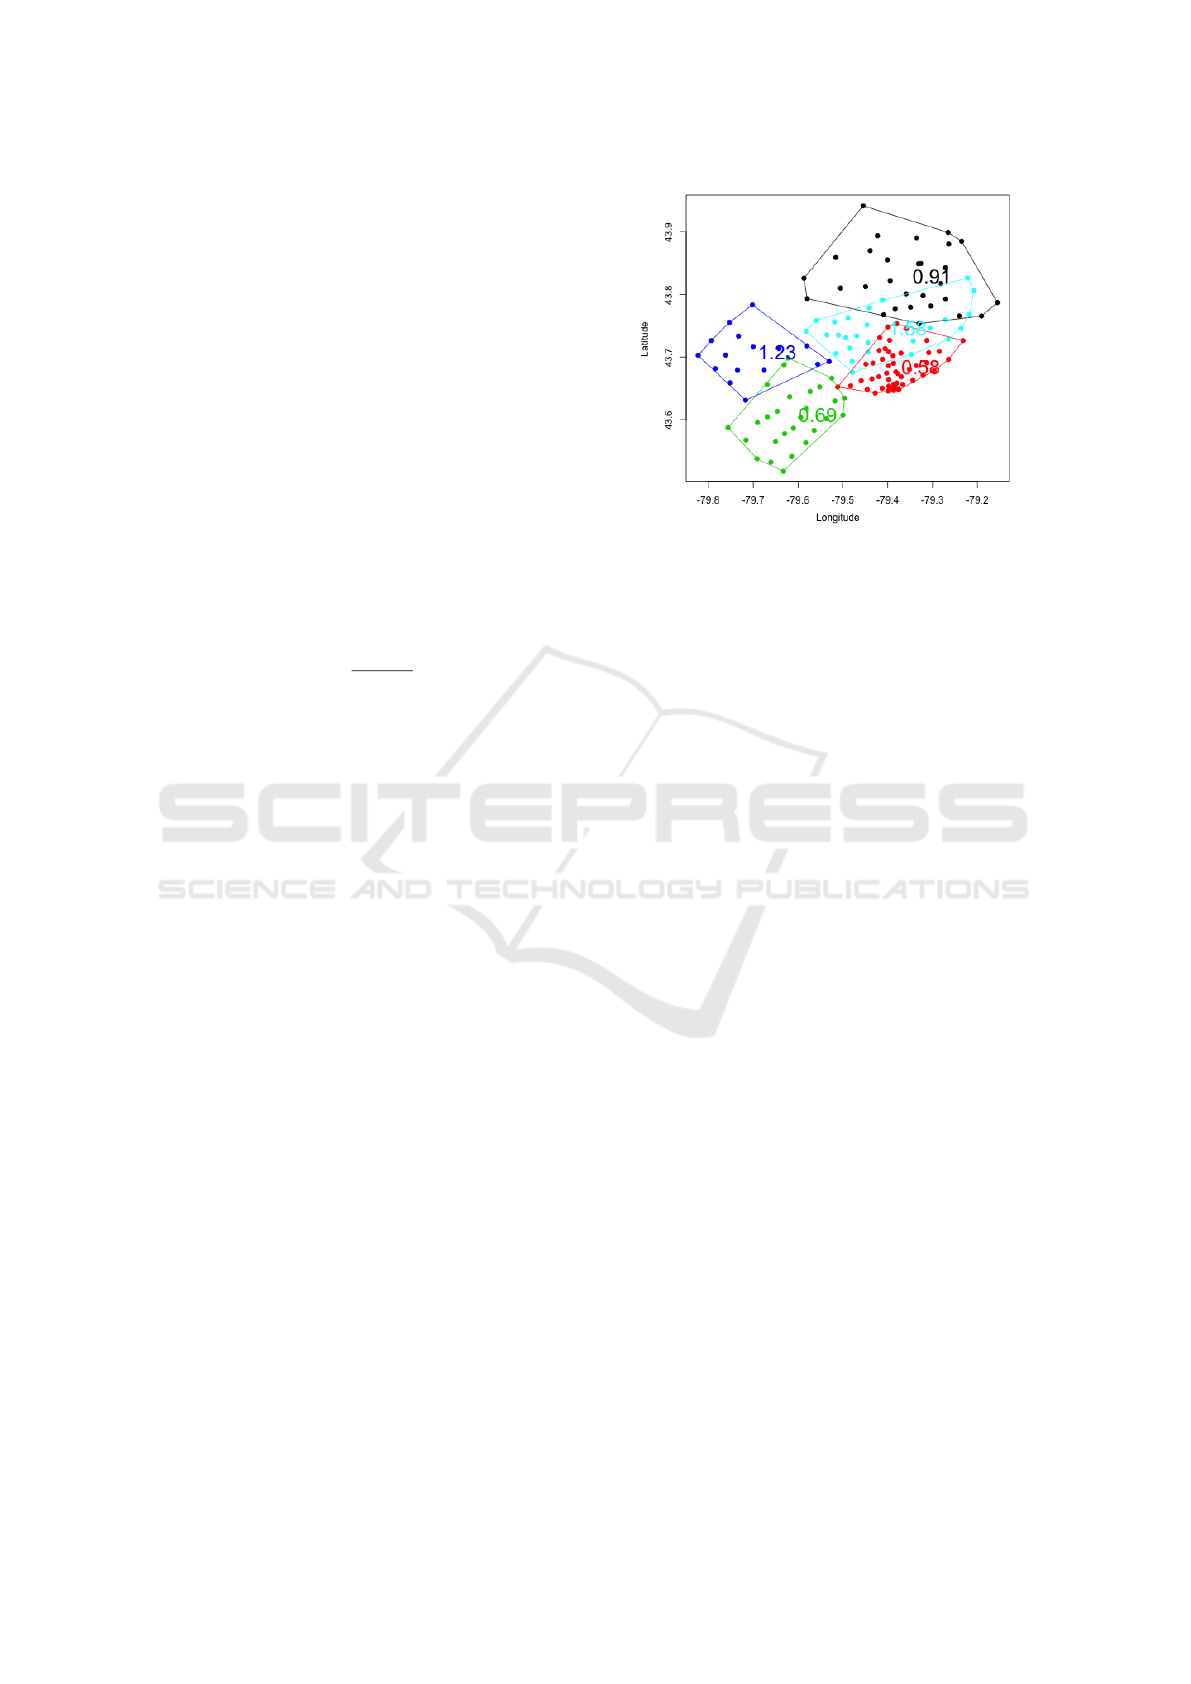
Figure 1: The empirical estimate of the risk relativities for
the obtained five clusters.
4 RESULTS
In this section, we discuss the results of relativities us-
ing empirical, GLM and GLMM models. The method
of spatially constraint K-means clustering was first
carried out to group the territories. To investigate how
the number of clusters (K) affects the results of rela-
tivities, we let K take the values of 5, 10, 15 and 20,
respectively. Note that to avoid the non-contiguous
points, the clusterings below have applied the Delau-
nay triangulation approach. After finding the clus-
ter index for each FSA as the covariate, we apply
the generalized linear model and generalized linear
mixed model with spatially correlated random effects
”City”, weighted by risk exposures to fit the loss cost.
Table 1 shows an example of modelling loss cost
by 5 clusters, using Gaussian, Poisson, Gamma and
Inverse Gaussian as the error function in the GLM
model. We can observe that the estimates of rela-
tivities are consistent among different distributions.
It is interesting to see that the error distributions in
GLM will not contribute significant influences to each
cluster’s relativities. When considering only two dec-
imal places, the risk relativities do not depend on the
given model’s error distribution. However, consider-
ing the goodness of the fit, the Gaussian error distri-
bution achieves the lowest AIC and BIC, which may
due to the loss data not following a heavy-tailed distri-
bution so that we can rely more on the Gaussian GLM
model. After that, we conducted a similar analysis on
the rest of the K and GLMM models, and we obtained
the same findings and conclusions
Recall that the empirical risk relativity is calcu-
lated by the overall ratio of average loss within each
cluster, relatively to the grand average loss. It can
be treated as the benchmark to compare the perfor-
Estimating Territory Risk Relativity for Auto Insurance Rate Regulation using Generalized Linear Mixed Models
331
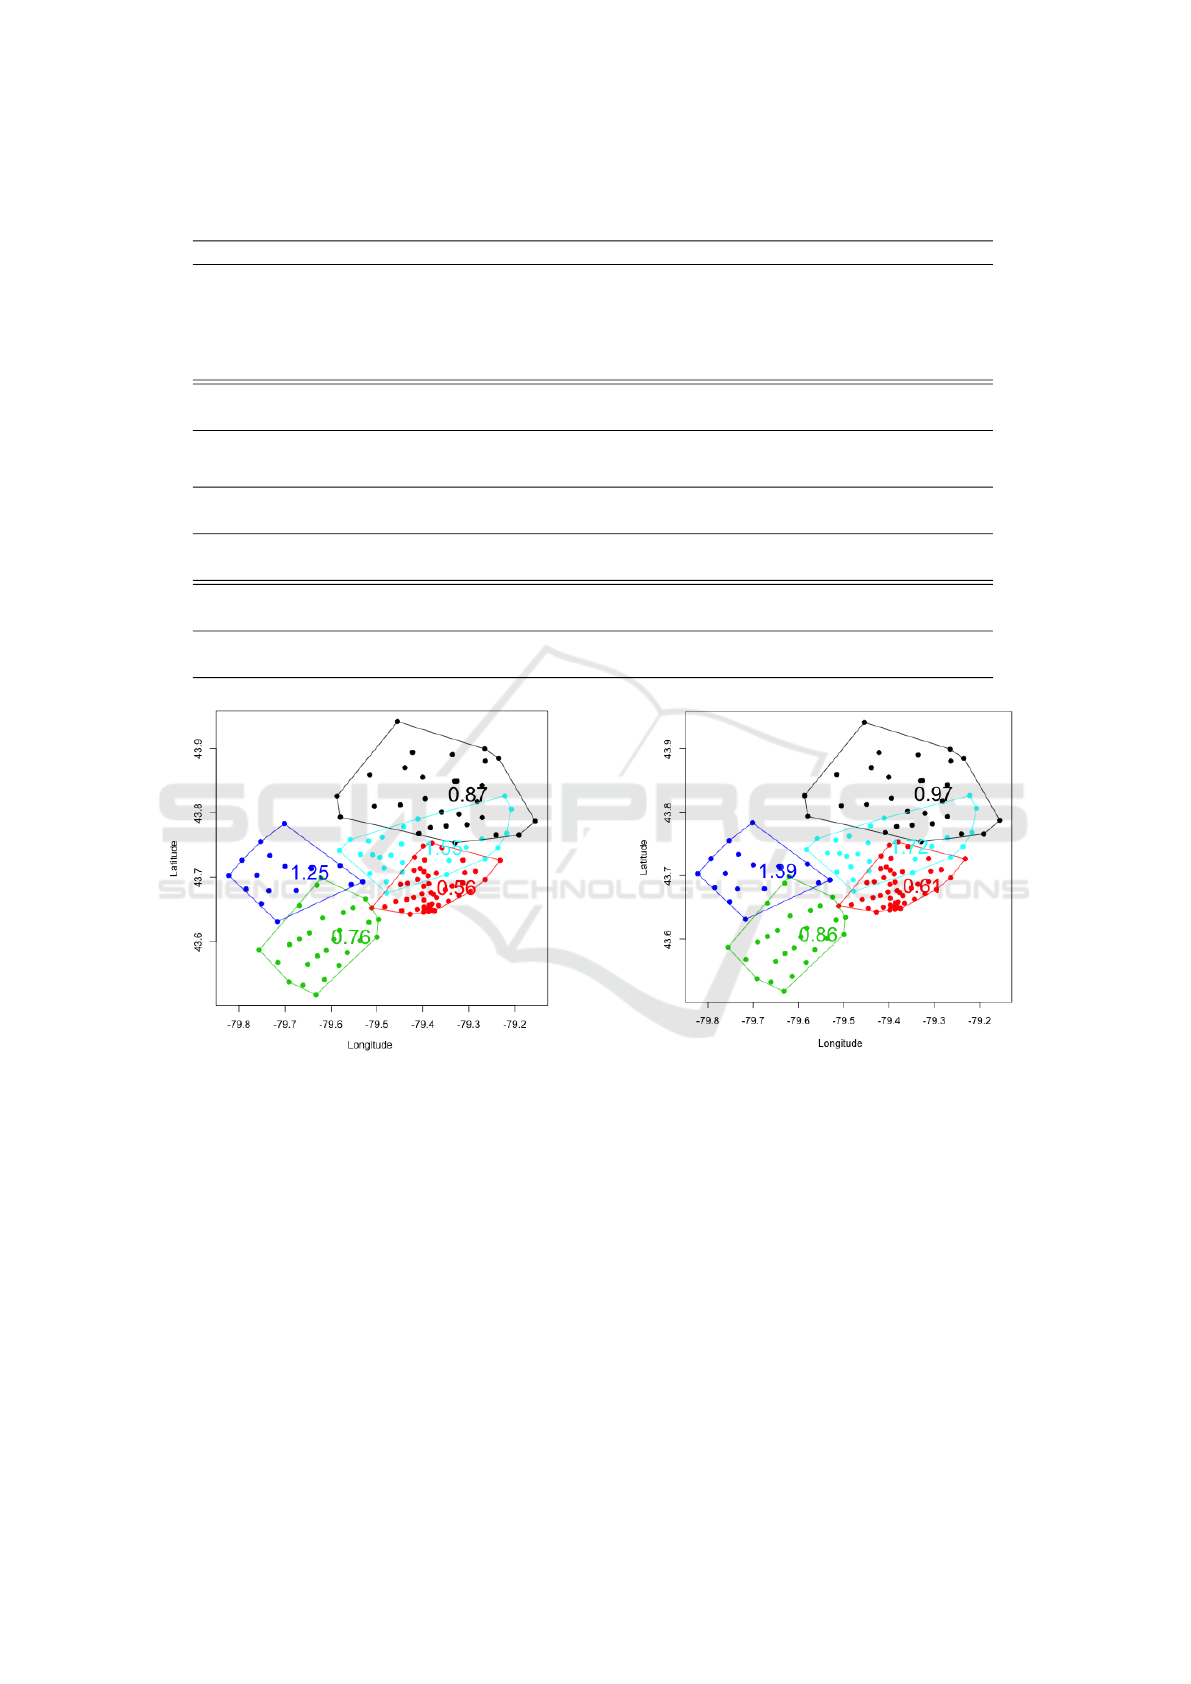
Table 1: The GLM estimates of risk relativities for the obtained five clusters, using Gaussian, Poisson, Gamma, inverse
Gaussian error function, along with AICs and BICs.
Relativity Gaussian Poisson Gamma Inverse Gaussian
cluster 1 0.87 0.87 0.87 0.87
cluster 2 0.56 0.56 0.56 0.56
cluster 3 0.76 0.76 0.76 0.76
cluster 4 1.25 1.25 1.25 1.25
cluster 5 1.55 1.55 1.55 1.55
AIC 2403.75 324546794.5 30078415.55 31491160.07
BIC 2421.82 324546809.5 30078433.62 31491178.14
Table 2: RMSE and MAD of the relativity for selected number of clusters 5, 10, 15, 20, using GLM and GLMM models.
GLM model
Number of Clusters 5 10 15 20
RMSE 0.0405 0.0464 0.0717 0.0731
MAD 0.0360 0.0383 0.0443 0.0494
GLMM model
Number of Clusters 5 10 15 20
RMSE 0.1254 0.1886 0.0729 0.0862
MAD 0.1120 0.1620 0.0443 0.0576
Figure 2: The GLM estimate of risk relativities for the ob-
tained five clusters.
mance of pricing among different models and the dif-
ferent number of clusters. Table 2 lists the RMSE
and MAD of the relativities for K = 5, 10, 15, 20, us-
ing GLM and GLMM models. Overall, the empirical
and estimated relativities do not differ much, which
shows that our proposed methods are reliable and con-
sistent with the benchmark estimate. The difference
of relativity between the empirical and GLM models
is slightly smaller than GLMM models, while the in-
crease of K in the GLMM model reversely improves
the performance. Among the K values we consider,
GLMM produce a more realistic number of clusters
in terms of a smaller RMSE or MAD. Table 2, we ob-
serve that when K=15, RMSE or MAD is the smallest.
Figure 3: The GLMM estimate of risk relativities for the
obtained five clusters. Cluster has fixed effect and City is
considered as a random effect.
To visualize the grouping structures and estimated
relativities of obtained clusters, we produce the plots
displayed in Figures 1 - 6. Within the Figures, the x
axis represents longitude, and the y axis represents lat-
itude. Through K-means clustering, the points within
the same cluster boundary are homogeneous, sharing
the common information of relativities. Figure 1 - 3
displays the results for K = 5, using empirical, GLM,
GLMM models, while Figure 4 - 6 displays the clus-
ters and relativities for K = 10. Again, comparing
the estimated relativities among these three methods,
we can find that there are no significant differences,
and the estimated values seem reasonable. For exam-
DATA 2021 - 10th International Conference on Data Science, Technology and Applications
332
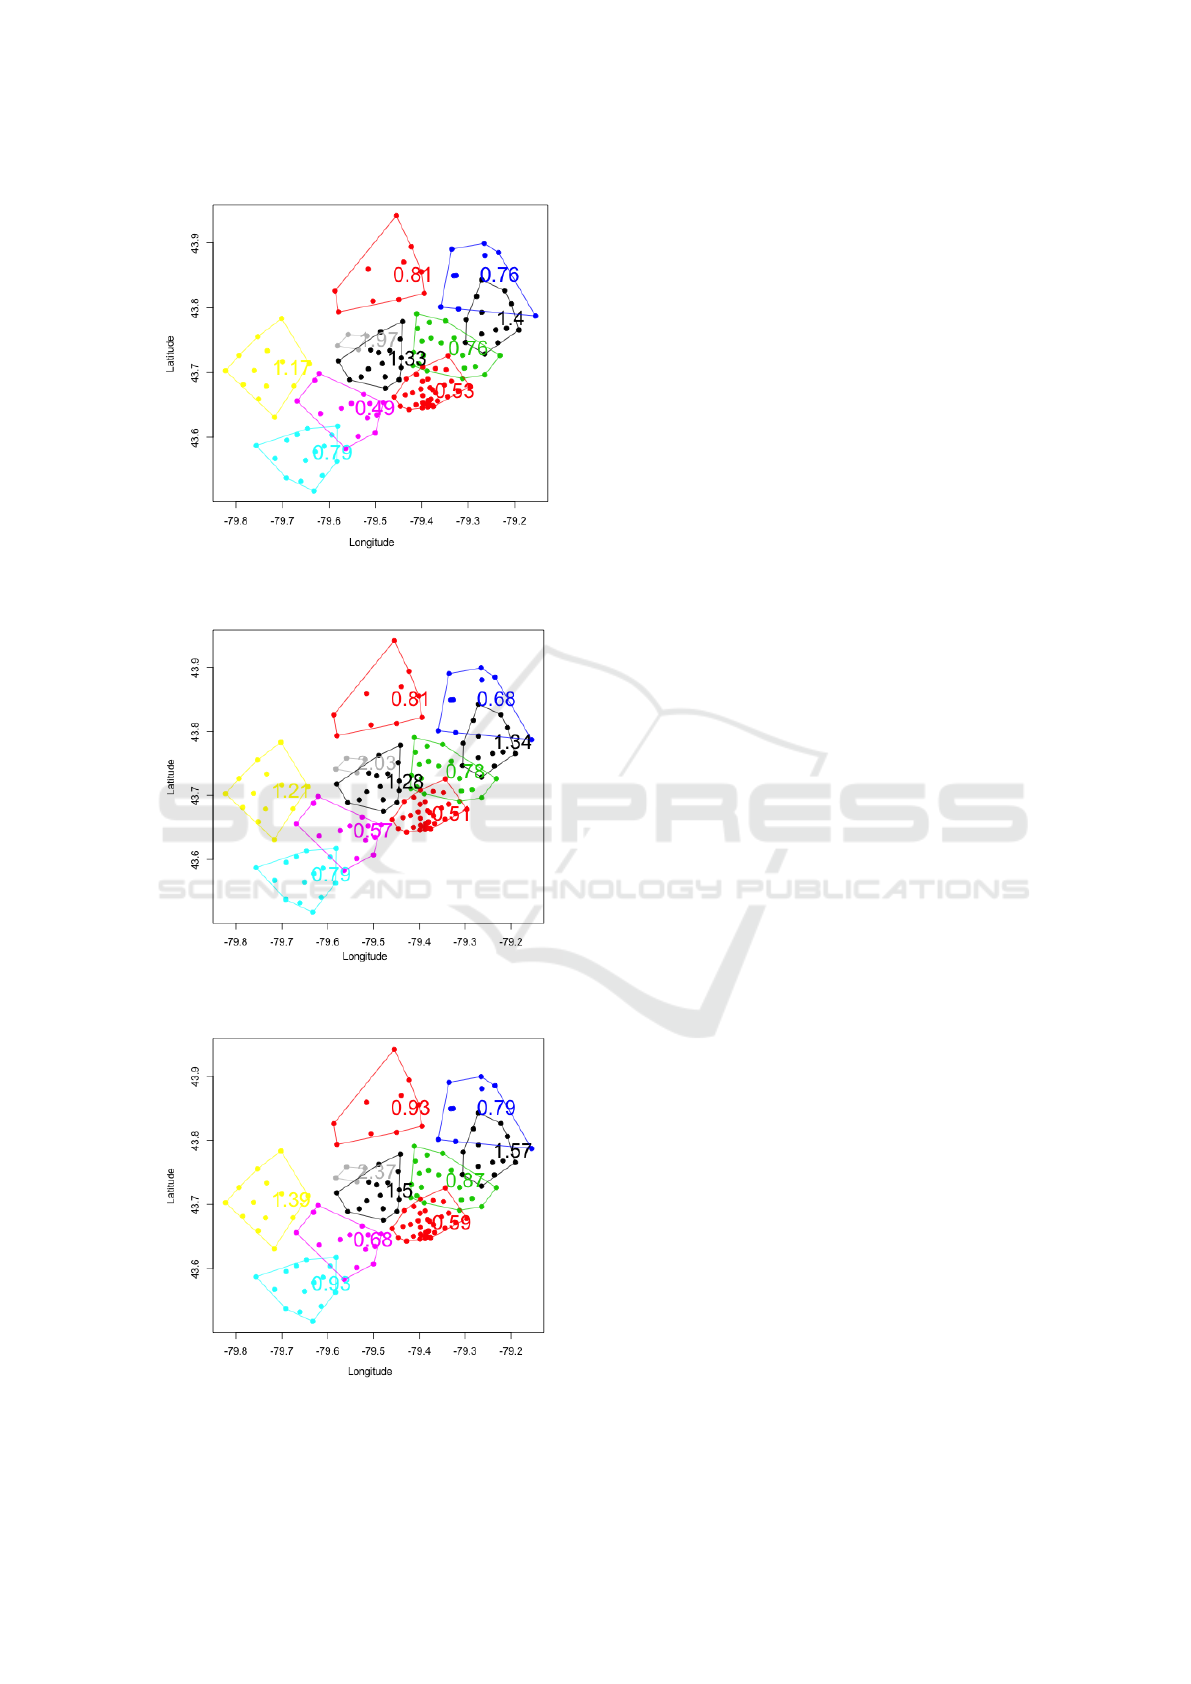
Figure 4: The empirical estimate of risk relativities for the
obtained ten clusters.
Figure 5: The GLM estimate of risk relativities for the ob-
tained ten clusters.
Figure 6: The GLMM estimate of risk relativities for the
obtained ten clusters. Cluster has fixed effect and City is
considered as a random effect.
ple, in the case of K = 5, relativities in the blue and
light blue clusters are higher than those of red and
blue clusters, which indicates that the region of North
York and Brampton has a higher risk than Etobicoke
and Mississauga. It can be explained by the differ-
ent driving behaviours and traffic volumes in differ-
ent districts. However, the generalized linear mixed
model gave slightly higher relativities in each cluster,
which may lead to the overestimation of the pure pre-
mium, but this method considers the spatial random
effect of cities. With the increase of numbers of clus-
ters, the risk assessment can be more accurate and ex-
plicit in response to small cluster boundaries. That is,
some points (FSAs) are not necessary to evaluate in
the same risk. For example, the black cluster in Fig-
ure 2 (K = 5) is partitioned into several clusters in Fig-
ure 5 (K = 10). In Figure 5, red includes the regions
of Thornhill and Richmond hill while blue represents
Markham’s area. It is reasonable to have the differ-
ent relativities in these two clusters. Another impor-
tant finding is that as the number of clusters increases,
there are fewer overlaps between clusters. We prefer
the separated clusters because it has a more practical
meaning that we can easily define the relativities of
other FSAs within the cluster boundaries. However, if
we allow a too large number of clusters, it will over-
fit the data and become meaningless to let each FSA
have its own risk relativity. It is important for a regu-
lator to consider the trade-off between the complexity
of clusters and geographical information. Often the
selection of the optimal number of clusters is based on
the sum of squares data variation, but our experiments
show that the sum of squares-based methods produces
a small number of clusters which has no meaning in
the actual application of territory risk classification.
5 CONCLUDING REMARKS
Generalized linear models and generalized linear
mixed models are now gaining significant attention in
insurance pricing and many other fields involving pre-
dictive modelling techniques, particularly for auto in-
surance rate-making. GLMs and GLMMs have been
discussed as actuarial statistical techniques in the cur-
rent literature, but they are not being widely used
for regulatory purposes. In this work, we proposed
a GLMM to estimate risk relativities after obtaining
spatial clusters for a given set of spatial loss data. Our
study illustrated the suitableness of using GLMMs to
estimate the risk relativities for obtained spatial clus-
ters so that the risk relativity of a basic rating unit
(such as FSA) can be calculated, for auto insurance
regulation purposes. The spatially constrained clus-
Estimating Territory Risk Relativity for Auto Insurance Rate Regulation using Generalized Linear Mixed Models
333

tering aims to produce more homogeneous groups.
The GLMM is used to model the loss cost by explain-
ing the variation of the loss cost through both fixed
and random effects. The obtained results suggest that
GLMM is promising in estimating the risk relativity
for spatially constrained clustering. Our future study
will investigate how it differs when moving from hard
clustering (e.g. K - means clustering) to soft clus-
tering (Fuzzy C-means clustering) and the impact of
fuzzy computing on the estimate of territory risk rel-
ativities. We will also investigate how risk relativities
can be integrated to the part of the criterion for de-
termining the optimal number of clusters in spatially
constrained clusterings.
REFERENCES
Antonio, K. and Beirlant, J. (2007). Actuarial statistics with
generalized linear mixed models. Insurance: Mathe-
matics and Economics, 40(1):58–76.
Antonio, K. and Beirlant, J. (2014). Risk classification in
nonlife insurance. Wiley StatsRef: Statistics Reference
Online.
Brown, R. L. (1988). Minimum bias with generalized lin-
ear models. In Proceedings of the Casualty Actuarial
Society, volume 75, pages 187–217. Citeseer.
Brubaker, R. E. (1996). Geographic rating of individual
risk transfer costs without territorial boundaries. In
Casualty Actuarial Society Forum, pages 97–127.
Jeong, H., Valdez, E. A., Ahn, J. Y., and Park, S. (2017).
Generalized linear mixed models for dependent com-
pound risk models. Available at SSRN 3045360.
Kleinschmidt, I., Sharp, B., Clarke, G., Curtis, B., and
Fraser, C. (2001). Use of generalized linear mixed
models in the spatial analysis of small-area malaria in-
cidence rates in kwazulu natal, south africa. American
journal of epidemiology, 153(12):1213–1221.
McClenahan, C. L. (2014). Ratemaking. Wiley StatsRef:
Statistics Reference Online.
Xacur, O. A. Q. and Garrido, J. (2015). Generalised lin-
ear models for aggregate claims: to tweedie or not?
European Actuarial Journal, 5(1):181–202.
Xie, S. (2019). Defining geographical rating territories
in auto insurance regulation by spatially constrained
clustering. Risks, 7(2):42.
Xie, S. and Lawniczak, A. (2018). Estimating major risk
factor relativities in rate filings using generalized lin-
ear models. International Journal of Financial Stud-
ies, 6(4):84.
Yao, J. (2008). Clustering in ratemaking: Applications in
territories clustering. Casualty Actuarial Society Dis-
cussion Paper Program Casualty Actuarial Society-
Arlington, Virginia, pages 170–192.
Zhang, J. and Miljkovic, T. (2019). Ratemaking for a
new territory: Enhancing glm pricing model with a
bayesian analysis.
DATA 2021 - 10th International Conference on Data Science, Technology and Applications
334
