
Towards a Neural Network based Reliability Prediction Model
via Bugs and Changes
Camelia S¸erban
a
and Andreea Vescan
b
Department of Computer Science, Babes¸-Bolyai University, M. Kogalniceanu 1, Cluj-Napoca, Romania
Keywords:
Reliability, Metrics, Assessment, Prediction, Neural Network, Object-oriented Design.
Abstract:
Nowadays, software systems have become larger and more complex than ever. A system failure could threaten
the safety of human life. Discovering the bugs as soon as possible during the software development and
investigating the effect of a change in the software system are two main concerns of the software developers
to increase system’s reliability. Our approach employs a neural network to predict reliability via post-release
defects and changes applied during the software development life cycle. The CK metrics are used as predictors
variables, whereas the target variable is composed of both bugs and changes having different weights. This
paper empirically investigates various prediction models considering different weights for the components
of the target variable using five open source projects. Two major perspectives are explored: cross-project to
identify the optimum weight values for bugs and changes and cross-project to discover the best training project
for a selected weight. The results show that for both cross-project experiments, the best accuracy is obtained
for the models with the highest weights for bugs (75% bugs and 25% changes) and that the right fitted project
to be used as training is the PDE project.
1 INTRODUCTION
Software systems have become larger and more com-
plex than ever. A minor change in one part of the sys-
tem may have unexpected degradation of the software
system design, leading in the end to multiple bugs and
defects. The impact of unreliable software resides in
critical damages, business reputation or even lost of
humans life.
Software practitioners have made significant ef-
fort to achieve high reliability for the systems during
testing process. Therefore, the assessment of software
system is of utmost importance in order to keep track
of implications that could appear after a change has
been applied. The main interest is to control the soft-
ware quality assurance process by predicting the fail-
ures and trigger a warning when the failure rate would
have fallen below an acceptable threshold.
Considering that the internal structure of the sys-
tem and also the changes applied successively influ-
ences the software reliability to a great extent, us-
ing history information from other projects, an auto-
matic prediction of the number of defects in a soft-
a
https://orcid.org/0000-0002-5741-2597
b
https://orcid.org/0000-0002-9049-5726
ware system may help developers to efficiently allo-
cate limited resources. Our approach uses a neural
network to predict reliability via post-release defects
and changes applied during the software development
life cycle. As independent variables in the predic-
tion model we use CK metrics and as target variable
we combine bugs (categorized by severity and prior-
ity) with changes (version, fixes, authors, codeChurn,
age) using different weights.
This paper empirically investigates various pre-
diction models using five open-source projects. The
performed experiments are cross-project, two major
perspectives being explored: to identify the optimum
weight values for bugs and changes and to identify the
optimum weight values for bugs and changes and to
discover the suitable project to be used as training.The
results show that for both cross-project experiments,
the best model is obtained with 75% bugs and 25%
changes and PDE is the proper project to be used as
training.
The paper is organized as follows: Section 2 de-
scribes related work approaches and discusses our ap-
proach in relation to them. Section 3 outlines our re-
search design, the experimental setup that we employ
to address the research questions: dataset, metrics,
method, and analysis. Section 4 reports the results,
302
¸Serban, C. and Vescan, A.
Towards a Neural Network based Reliability Prediction Model via Bugs and Changes.
DOI: 10.5220/0010600703020309
In Proceedings of the 16th International Conference on Software Technologies (ICSOFT 2021), pages 302-309
ISBN: 978-989-758-523-4
Copyright
c
2021 by SCITEPRESS – Science and Technology Publications, Lda. All rights reserved

mapping each experiment with the research question.
Section 5 discuses about the threats to validity that
can affect the results of our study. The conclusions of
our paper and further research directions are outlined
in Section 6.
2 RELATED WORK
Reliability is one of the most important measurements
when we describe safety-critical systems. It is so im-
portant because a fail in such a system could produce
life loses. This subject was of major interest in last
years and several research works studied its impact
on software safety, as well as methods through which
we can predict and accomplish a high reliability value
from the earliest development stages.
How reliability predictions can increase trust in re-
liability of safety-critical systems was studied in pa-
per (Schneidewind, 1997). The author determines a
prediction model for different reliability measures (re-
maining failure, maximum failures, total test time re-
quired to attain a given fraction of remaining failures,
time to next failure), concluding that they are useful
for assuring that software is safe and for determining
how long to test a piece of software.
Another approach (Chitra et al., 2008) defined
a classifier (with 37 software metrics) and use it to
classify the software modules as fault-none or fault-
prone. They compared their works with others and
concluded that their model has the best performance.
The approach in (Li et al., 2016) proposes a new tool
named Automated Reliability Prediction System for
predicting the reliability of safety-critical software.
An experiment was conducted where some students
used this tool. The result was that they made fewer
mistakes in their analysis.
The work described in (Merseguer, 2003) tries to
solve the problem of determining the error rate of the
electronic parts of a track circuit system (which is a
safety critical system) by using Markov chains in or-
der to predict the reliability of the fault-tolerant sys-
tem. The paper (Lou et al., 2016) proposes an ap-
proach for predicting software reliability using Rele-
vance vector machines as kernel-based learning meth-
ods that have been adopted for regression problems.
In relation to existing approaches, ours investi-
gates how we can use CK metrics (Chidamber and
Kemerer, 1994) to predict reliability and relates to ap-
proaches (Chitra et al., 2008), (Shrikanth et al., 2021),
(Carleton et al., 2020), (Nayrolles and Hamou-Lhadj,
2018), with the difference that we use CK metrics in-
stead of cyclomatic complexity, decision count, deci-
sion density, etc., and we predict a reliability value
for each class in the project, instead of classifying the
design classes in two categories – faulty or healthy.
Our approach investigates different weights values
for post-release defects and changes using five open
projects by exploring two perspectives: cross-project
to discover best weighs for bugs and changes, and to
explore and identify the proper project to be used as
training project. This has also been explored in prior
studies by Geremia and Tamburri (Geremia and Tam-
burri, 2018) where they propose decision mechanisms
to support the selection of the best defect prediction
model using contextual factors of project lifetime.
3 RESEARCH DESIGN
Nowadays, when software systems are very complex
applications and resources are limited, automatically
predicting the number of failures in software modules
helps developers and testers to efficiently allocate the
resources in order to increase software system relia-
bility.
Various aspects in the software development life
cycle may be the cause of a software failure. The cur-
rent paper approaches the failures identified as post
release bugs that are caused by defects from source
code. Machine learning is not always suitable for
bugs prediction due to the highly unbalanced data
(Mahmood et al., 2015), few design entities are found
to be defected in comparison with the total number of
entities from the system. Thus, to cope with this lim-
itation the current approach aims to define a metric as
dependent variable of the target value used in the pre-
diction algorithm that considers, in a certain weight,
changes that are met in the source code. This met-
ric is named “reliability via bugs and changes”. The
reasoning in take into account changes registered dur-
ing software development is due to the fact that these
changes influence also system’s reliability.
Thus, in this paper we empirically investigate, us-
ing five open source projects, what is the best linear
combination between bugs and changes that can be
used as target value to define a prediction model based
on Neural Network having as independent variables
CK (Chidamber and Kemerer, 1994) metrics.
Therefore, we aim to introduce a cross-project ap-
proach analysis having two objectives:
• finding the best Bugs-Changes weight: for each
considered project various Bugs-Changes weights
are explored (50B50C, 25B75C, 75B25C); the
analysis is conducted between any two percentage
combination.
• finding the suitable project to be considered
Towards a Neural Network based Reliability Prediction Model via Bugs and Changes
303

as training project considering various Bugs-
Changes percentages: for each percentage combi-
nations, all projects are used as training; the anal-
ysis is conducted between all projects.
More specifically, the study aims at addressing the
following research questions:
RQ1: What is the best Bugs-Changes percent-
ages to be used 50B50C, 25B75C, 75B25C for
defect prediction?
RQ2: What is the proper project to be used
for training a reliability prediction model?
Figure 1 presents the overview of our approach,
graphically representing the training Project A and the
testing Project B, the structure of the Neural Network,
the input layer (CK metrics) and the prediction mod-
els with various weights for reliability by bugs and
changes.
The rest of the section details the experimental de-
sign we employed to address the research questions
above.
3.1 Dataset
The dataset used in our investigation is public avail-
able
1
. This dataset includes: JDTCore
2
increamen-
tal java compiler; PDE-UI
3
Eclipse plug-in devel-
opment tool; Equinox
4
implantation framework for
OSGI core componenets; Lucene
5
java based search
technology.
These software systems have been extensively
studied in research literature of bug-prediction
(D’Ambros et al., 2010). The reason reason for us-
ing these dataset, beyond its public availability, is due
to the fact that it contains bugs and changes log.
The granularity level performed by the analysis is
class design entity. Therefore, for each class of the
last version of the system the dataset provide informa-
tion regarding Chidamber and Kemer metrics values
(Chidamber and Kemerer, 1994), the number of bugs
(trivial, major, critical, high priority) categorized by
severity and priority and the changes applied during
the system development.
In Table 1 the number of classes in each
project and the number of bugs may be visualized
1
http://bug.inf.usi.ch/index.php
2
https://www.eclipse.org/jdt/core/index.php
3
https://www.eclipse.org/pde/pde-ui/
4
https://projects.eclipse.org/projects/eclipse.equinox
5
http://lucene.apache.org/
(#C=number of total classes, #CB=number of classes
with Bugs, #B=number of Bugs, #NTB=number of
Non Trivial Bugs , #MB =number of Major Bugs,
#C=number of Critical Bugs, #HPB=number of High
Priority Bugs), and #Bugs - number of bugs that were
not categorized.
Table 1: Dataset description.
#C #CB #B #NTB #MB #CB #HPB
JDT 997 206 374 17 35 10 3
PDE 1497 209 341 14 57 6 0
EQ 324 129 244 3 4 1 0
LU 691 64 97 0 0 0 0
MY 1862 245 340 187 18 3 36
The characteristics used in our investigation related to
the considered projects are: UI, Framework, Index-
ing and search technology, Plug-in management and
Task management. We mention next for each project
two characteristics: JDT (UI, IndexSearch), PDE (UI,
PlugIn), Equinox (UI, Framework), Lucene (UI, In-
dexSearch), Mylyn (UI, Task).
3.2 Metrics
The current section provides some details regard-
ing the metrics used in the proposed neural network
model to predict reliability. As independent variables
in the prediction model we use CK metrics and as tar-
get variable we combine bugs (categorized by sever-
ity and priority) with changes (version, fixes, authors,
codeChurn, age) using different weights.
3.2.1 CK Metrics
The metrics selected as independent variables for the
proposed reliability prediction model based on bugs
and changes are the CK (Chidamber and Kemerer,
1994) metrics suite: Depth of Inheritance Tree (DIT),
Weighted Methods per Class (WMC), Coupling Be-
tween Objects (CBO), Response for a Class (RFC),
Lack of Cohesion in Methods (LCOM), Number of
children of a class (NOC). The definitions of the these
metrics are briefly presented in what follows:
• Depth of Inheritance Tree (DIT) is defined as the
length of the longest path of inheritance from a
given class to the root of the tree;
• Weighted Methods per Class (WMC) metric de-
fined as the sum of the complexity of all methods
of a given class. The complexity of a method is
the cyclomatic complexity;
• Coupling Between Objects (CBO) for a class c is
the number of other classes that are coupled to the
class c, namely that Two classes are coupled when
ICSOFT 2021 - 16th International Conference on Software Technologies
304
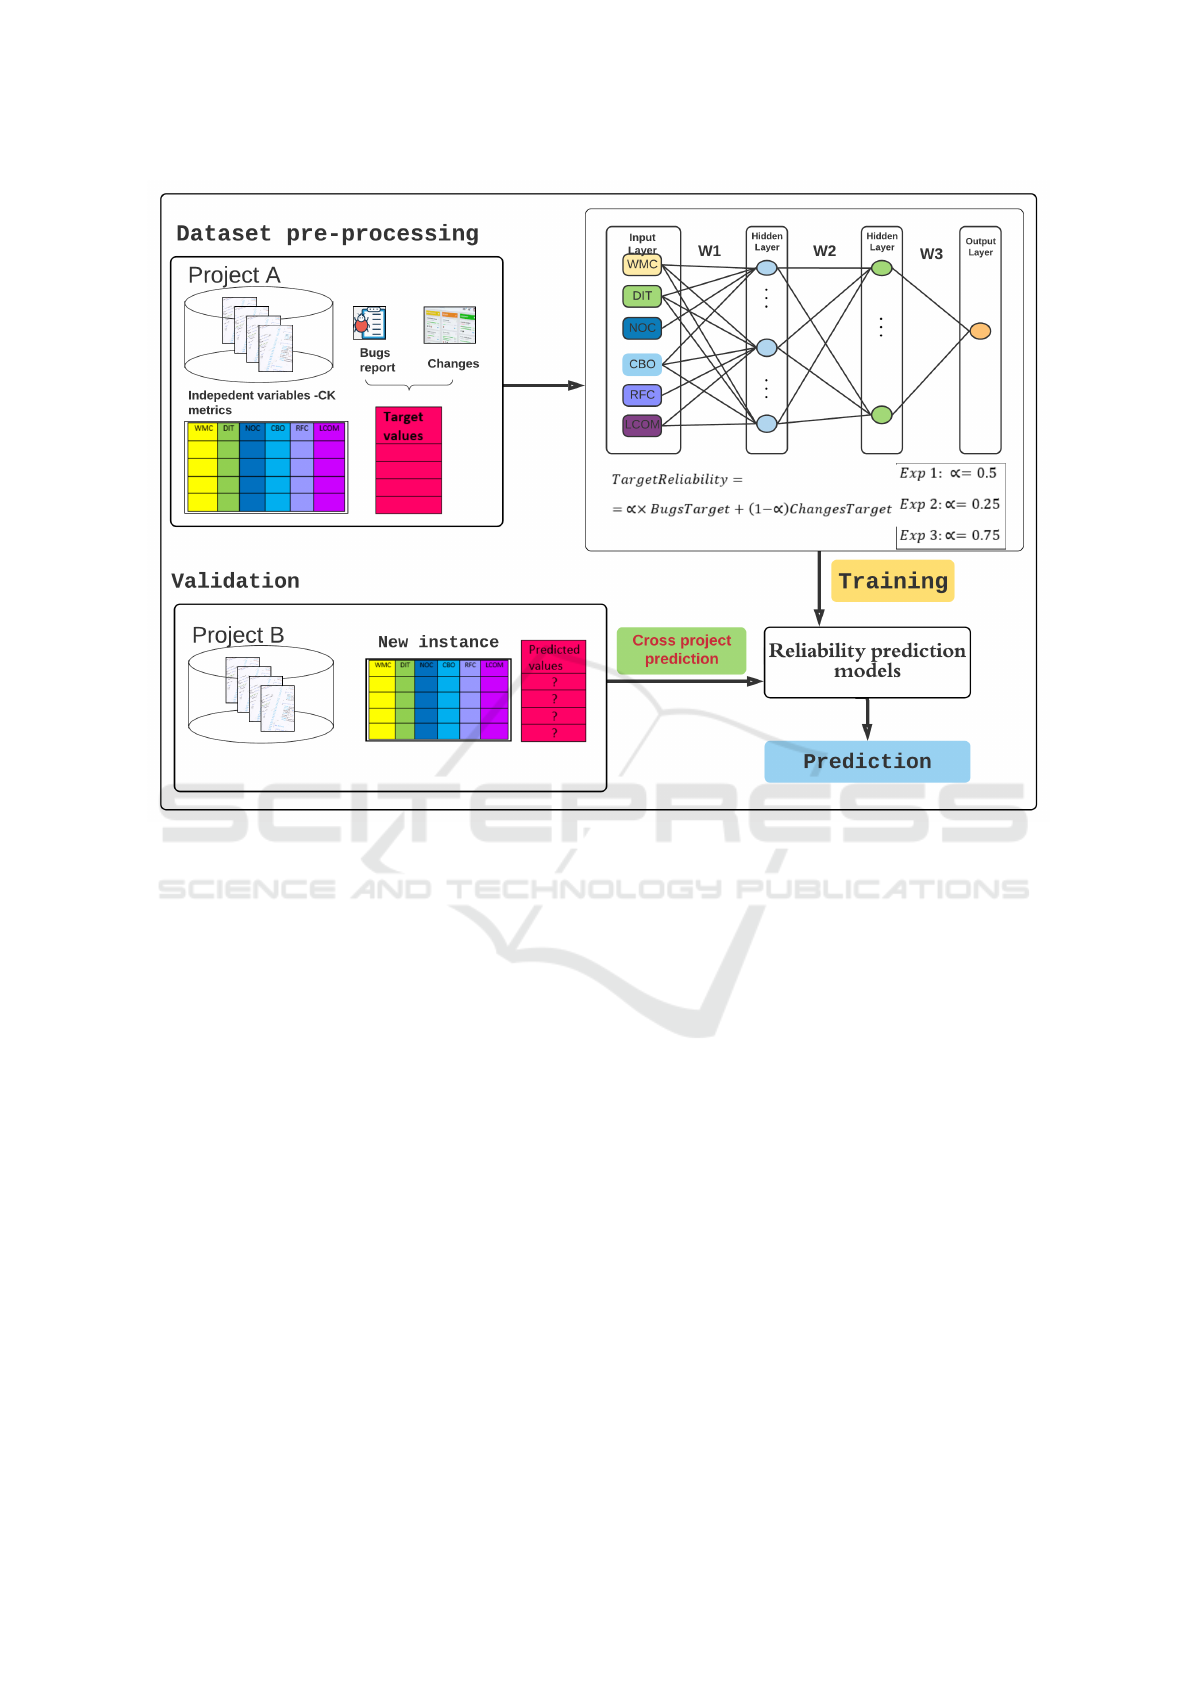
Figure 1: Our approach overview.
methods declared in one class use methods or in-
stance variables defined by the other class;
• Response for a Class (RFC) metric is defined as
the total number of methods that can be invoked
from that class;
• Lack of Cohesion in Methods (LCOM) is defined
by the difference between the number of method
pairs using common instance variables and the
number of method pairs that do not use any com-
mon variables.
• Number of children (NOC) of a class is the num-
ber of immediate sub-classes subordinated to a
class in the class hierarchy. Theoretical basis of
NOC metric relates to the notion of scope of prop-
erties. It is a measure of how many sub-classes are
going to inherit the methods of the parent class.
One of the reason in selecting these metrics is due
to the fact that they are linked to four internal char-
acteristics that are essential to object-orientation: -
i.e. coupling, inheritance, cohesion and structural
complexity (Marinescu, 2002). At the same time
they were validated as being good predictors for soft-
ware quality. Tang et al. (Tang et al., 1999) vali-
dated CK’s metrics using real-time systems and the
results suggested that WMC can be a good indica-
tor for faulty classes. Li (Li, 1998) theoretically val-
idated CK’s metrics using a metric-evaluation frame-
work proposed by Kitchenham et al. (Kitchenham
et al., 1995). Thus, metrics considered for our study
have been selected based on these arguments.
Thus, the goal of this study is to explore the re-
lationship between object-oriented metrics and relia-
bility at the class level. To attain this, a target metric
for reliability is needed. In the following sections we
aim to define this metric as an aggregated measure of
two components: the first component takes bugs into
account and the second component considers changes
during the software development life cycle.
3.2.2 Bugs Metrics
The bugs described by our used dataset are grouped in
four categories considering their severity and priority.
Thus, the following types of bugs were reported by a
bug tracking system:
• #HighPriorityBugs (#HPB) - number of bugs con-
sidered to be a priority;
• #NonTrivialBugs (#NTB) - number of bugs being
non trivial;
Towards a Neural Network based Reliability Prediction Model via Bugs and Changes
305

• #MajorBugs (#MB)- number of bugs having a ma-
jor importance;
• #CriticalBugs (#CB) - number of bugs considered
to be critical;
• #Bugs - number of bugs that were not categorized.
Our goal is to used these categories of bugs in order to
define an aggregate metric that will be used as target
value for reliability prediction. We establish weights
for each of the above four categories of bugs consid-
ering an order relation that establishes a priority in
solving these faults/bugs. Therefore, for bugs hav-
ing “high priority” and for those being “major” and
“critical” we assigned a weigh value equals with the
value 25, whereas for “non-trivial” bugs and not cat-
egorized bugs we assigned the weighs values equals
with 15 and 10 respectively.
The Equation 1 defines the target value component
for reliability prediction having the granularity level
the “class” entity from object-oriented design model.
The values of these metrics are collected during test-
ing, operation and maintenance in order to conclude
about the reliability of the system. The weight values
defined for the metrics come from empirical observa-
tions.
BugsTarget = (0.25 ∗#HPB + 0.15 ∗ #NT B+
0.25 ∗ #MB + 0.25 ∗ #CB + 0.10 ∗ #Bugs).
(1)
3.2.3 Change Metrics
To quantify the changes we use the catalog of four
level process metrics introduced by Moser et al.
(Moser et al., 2008):
• Number of fixies (NFIX)
• Number of authors (NAUTH)
• Number of revisions (NR)
• Code Churn (CHURN)
• Age (in number of weeks)
• Weighted age (AGE) for a class
The granularity of the level is “class” considering de-
sign entities from the object-oriented design model.
All the above metrics are used to define a mea-
sure for reliability via changes as a linear combination
having the weights values equals to the value 0.2. See
Equation 2.
ChangesTarget = (0.20 · NR + 0.20 · NFIX+
0.20 · NAUTH + 0.20 ·CHURN + 0.20 · AGE).
(2)
Remark: Current investigation considered equal im-
portance of each element, future investigation will
vary the importance of the elements.
3.2.4 Target Reliability Prediction Metric
As mentioned earlier, to cope with unbalanced data,
we also employed the changes performed in the
source code in our defect–based model. The used
dataset (D’Ambros et al., 2010) contains also histor-
ical data, such as versions, fixes and authors, refac-
toring made, data that could be used further in the
reliability estimation model. Thus, our experiments
investigate an aggregated metric used as dependent
variable, target value, for predicting reliability based
on two components each of them having into ac-
count several aspects as discussed in previous sec-
tions. These components are bugs and changes hav-
ing different assigned weights. Equation 3 describes
the target value for reliability prediction via bugs and
changes aspects. The proposed validation model ex-
plores several values for the value of α weight from
this equation.
Reliability = α · BugsTarget+
(1 − α)·ChangesTarget
(3)
3.3 Applied Method
In order to predict the reliability, a feed-forward neu-
ral network (Russel and Norvig, 1995) with back-
propagation learning is used, with the following struc-
ture: six nodes on the input layer (one for each con-
sidered metric), one node on the output layer and two
hidden layers, each of them having four nodes. Each
node uses the bipolar sigmoid activation function.
Remark: The current investigation considered only
this type of neural network, the focus being to study
various percentages for bugs and change metrics. Fu-
ture investigation will vary the architecture of the neu-
ral network.
The CK metrics mentioned above are chosen to be
the input vector of the neural network. The reliability
metric computed using bugs and changes is chosen to
be the expected output vector. We have applied Min-
Max normalization to all considered metrics (WMC,
RFC, NOC, LCOM, DIT, CBO) and also to the bugs
and changes - based reliability metric definition.
The termination condition of training is either the
error to be less or equal then 0.001 or the number of
epochs to be at most 10000. After training this neu-
ral network, we obtained a neural network model for
reliability prediction.
We performed cross-project validation with two
viewpoints: to discover the best percentages for Bugs
and Changes and to discover for a given project what
is the proper project used as training.
We thus have 15 prediction models (5 projects,
each with 3 different percentages combinations):
ICSOFT 2021 - 16th International Conference on Software Technologies
306

JDT-training, PDE-training, EQ-training, LU-
training, and MY-training, each with 50B50C-
25B75C, 50B50C-75B25C, 25B75C-75B25C. For
each experiment the other four projects were con-
sidered for testing phase of that specific prediction
model, for example the PDE, EQ, LU, MY projects
were used for the JDT-based training prediction
model. For example, in Figure 1 one prediction
model considers as “Project A” the JDT project and
“Project B” is in turn changed with PDE, then EQ,
then LU, and finally MY.
3.4 Analysis and Metrics Used to
Compare the Models
3.4.1 Wilcoxon Signed-Rank Test
The Wilcoxon signed ranks test (Derrac et al., 2011)
is used to answer the following question: do two sam-
ples represent two different populations? It is a non-
parametric procedure employed in hypothesis testing
situations, involving a design with two samples. It is a
pairwise test that aims to detect significant differences
between two sample means, that is, the behavior of
two algorithms.
We applied the Wilcoxon signed ranks test for
each train-based project, comparing the difference be-
tween the target and predicted values between any two
percentage configurations for Bugs and Changes.
3.4.2 Root Mean Squared Error Metric
The standard deviation of residuals or The Root Mean
Squared Error (RMSE) metric is used to validate our
model. RMSE is a quadratic scoring rule that also
measures the average magnitude of the error. It‘s the
square root of the average of squared differences be-
tween prediction and actual observation. RMSE is the
standard deviation of the residuals (prediction errors).
Residuals are a measure of how far from the regres-
sion line data points are; RMSE is a measure of how
spread out these residuals are. In other words, it tells
you how concentrated the data is around the line of
best fit.
4 RESULTS
We outline in what follows the results obtained for
the two viewpoints: discover the best percentages
between Bugs and Changes and discover the proper
project to be used as training.
4.1 Results for Finding the Best
Bugs-Changes Weights
The obtained results for discovering the best Bugs-
Changes percentages 50B50C, 25B75C, 75B25C are
provided in Table 2, the RMSE values are provides
for the set of 15 models (5 projects as training, each
with 3 different Bugs-Changes percentages). In-
specting the results in the table we notice that for
each project considered as training, the validation for
all the other projects obtained better results for the
75B25C weights, except for the EQ training with MY
validation (50B50C). We colored the background in
gray for the best results in Table 2.
Thus, we can better predict reliability using CK
metrics with the percentages 75% Bugs and 25%
Changes.
Table 2: Best percetages using JDT as basic training -
RMSE values.
JDT-training RMSE values using JDT
50B50C 25B75C 75B25C
PDE 0.186713665 0.19178037 0.128103826
EQ 0.167290821 0.240823187 0.111970291
LU 0.197666134 0.22655712 0.132700984
MY 0.140745789 0.157392999 0.129820001
PDE-training RMSE values using PDE
50B50C 25B75C 75B25C
JDT 0.191519539 0.228295332 0.113529354
EQ 0.098123535 0.212072039 0.071749605
LU 0.090000284 0.139059219 0.071018641
MY 0.167089293 0.152016918 0.065734533
EQ-training RMSE values using EQ
50B50C 25B75C 75B25C
JDT 0.201938201 0.221695527 0.14487756
PDE 0.12452203 0.155362424 0.108192312
LU 0.12821925 0.154952299 0.112043172
MY 0.1663265 0.169592095 0.17973771
LU-training RMSE values using LU
50B50C 25B75C 75B25C
JDT 0.203440049 0.248372703 0.161926514
PDE 0.075215563 0.106751237 0.058844177
EQ 0.116125632 0.194066449 0.087798055
MY 0.178258072 0.1855377 0.080880523
MY-training RMSE values using MY
50B50C 25B75C 75B25C
JDT 0.096448833 0.129577655 0.068157969
PDE 0.130031612 0.15239775 0.066020455
EQ 0.124221025 0.239512919 0.067693738
LU 0.140360207 0.184442734 0.073102356
Another conducted analysis investigated if there is a
difference between the various considered percent-
ages 50B50C, 25B75C, 75B25C using the Wilcoxon
signed ranks test. The results are provided in Table 3
that contains the results of the p-value.
We can notice that for most of the projects and
comparisons there are a significant difference be-
tween 50B50C-25B75C, 50B50C-75B25C, 25B75C-
75B25C. We colored the background in gray the cells
Towards a Neural Network based Reliability Prediction Model via Bugs and Changes
307
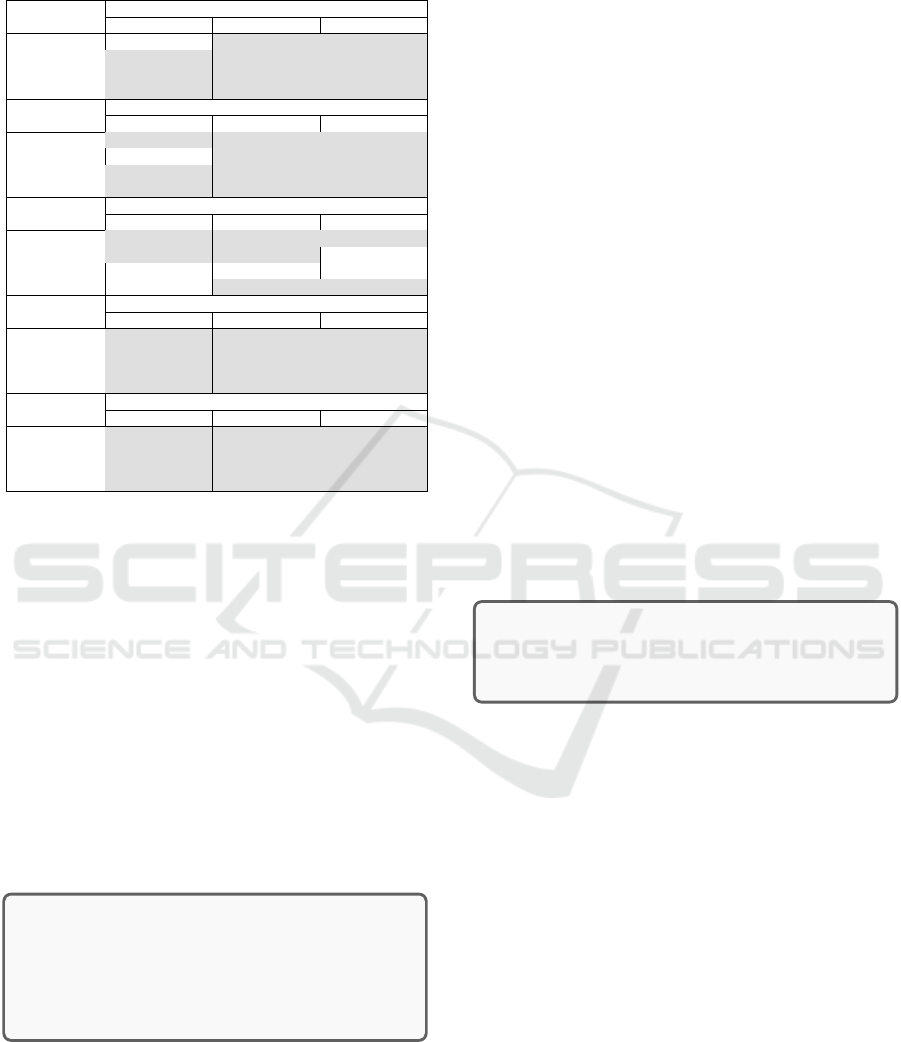
Table 3: Best percetages using All projects as basic training
- p-values for the Wilcoxon Test.
JDT-training Best percentages using JDT
50B50C-25B75C 50B50C-75B25C 25B75C-75B25C
PDE 0.673737672 5.12475E-76 6.223E-127
EQ 2.84336E-07 5.21292E-64 8.9038E-110
LU 6.17709E-80 6.7404E-125 4.4931E-131
MY 1.32409E-56 4.91555E-52 2.52494E-39
PDE-training Best percentages using PDE
50B50C-25B75C 50B50C-75B25C 25B75C-75B25C
JDT 6.0425E-31 6.8483E-214 2.4489E-237
EQ 0.310320414 0.004673915 4.04916E-16
LU 1.2526E-148 6.8599E-140 8.72272E-67
MY 4.03857E-07 2.9011E-104 1.4325E-180
EQ-training Best percentages using EQ
50B50C-25B75C 50B50C-75B25C 25B75C-75B25C
JDT 3.38737E-07 3.94959E-30 7.10449E-42
PDE 2.31386E-12 2.83819E-05 0.846571122
LU 0.326247909 0.240985176 0.110562683
MY 0.820209572 2.3176E-14 1.85178E-27
LU-training Best percentages using LU
50B50C-25B75C 50B50C-75B25C 25B75C-75B25C
JDT 9.59941E-64 2.37645E-92 1.07116E-96
PDE 7.21815E-94 4.64797E-74 1.62081E-23
EQ 1.10368E-12 3.17302E-21 3.84541E-27
MY 2.65776E-39 5.515E-103 1.5352E-110
MY-training Best percentages using MY
50B50C-25B75C 50B50C-75B25C 25B75C-75B25C
JDT 3.84706E-76 4.83066E-66 4.80661E-34
PDE 2.00215E-15 2.2138E-176 3.3781E-272
EQ 2.0122E-124 2.813E-211 1.5807E-219
LU 2.2717E-201 1.685E-274 1.1776E-291
where the p value is ≤ 0.05. There are cases in which
the value of p is 0.05: JDT-training with PDE
validating and PDE-training with EQ validating for
50B50C-25B75C, EQ-training with PDE validating
with 25B75C-75B25C, with LU validating for all con-
figurations and with MY validating for the 50B50C-
25B75C configuration.
Inspecting the results in Table 3 for all considered
projects as basis training we can conclude that, in gen-
eral, there is a significant difference between the ob-
tained models when varying the Bugs and Changes
percentages.
In summary, with respect to our RQ1, namely
What is the best Bugs-Changes percentages to be used
50B50C, 25B75C, 75B25C for defect prediction?, we
elaborate the following response:
The experiments using cross-project predic-
tion models identified that the best prediction
is obtained using 75B25C Bugs and Changes
percentages, independent of the project use as
training.
4.2 Results for Only Bugs and Bugs and
Change
This analysis aims to determine for each project
what is the appropriate project to be used as training
project. Thus, in Table 2 we seek for each project
what is the best training project. For example, for the
JDT project, for the 50B50C experiment, we compare
the RMSE results considering for it the PDE-training,
EQ-training, LU-training and MY-training, the mini-
mum value being for MY, and for the other percent-
ages (25B75C and 75B25C) the values are still mini-
mum for MY. We use bold for the best values for each
project and for each percentages, thus for JDT in the
MY-training we bolded the values for all percentages
expriments for the JDT line. Next, we outline the
results for each remained projects: for PDE project
the best project used as training is LU for all percent-
ages, for EQ different projects for different percent-
ages (PDE for 50B50C, LU for 25B75C and MY for
75B25C), for LU is PDE for all percentages, and for
LU is PDE for 25B75C and 75B25C and is JDT for
50B50C.
Scrutinizing the results in bold in Table 2 we dis-
cern that the project with maximum number of better
predictions is PDE (UI, PlugIn) having six such val-
ues, followed by the LU (UI, IndexSearch) and MY
(UI, Task) projects with four values, whereas EQ (UI,
Framework) has no such values.
In summary, with respect to our RQ2, namely
What is the proper project to be used for training a
reliability prediction model?, we elaborate the follow-
ing response:
The experiments using cross-project predic-
tion models identified that the best prediction
is obtained using the PDE training.
5 THREATS TO VALIDITY
The reliability prediction approach, as every experi-
mental analysis, may suffer from some threats to va-
lidity that can affect the results of our study.
Threats to internal validity refer to the subjectiv-
ity introduced in setting the weights for the reliability
estimation equation. To minimize threats to internal
validity, we considered various weights for bugs and
changes: 50B50C, 25B75C and 75B25C. Also, the
use of bugs to predict reliability could be considered
too simplistic, due to the fact that reliable software
systems are not achieved simply by removing bugs.
However, our approach does not consider all aspects
of reliability but only those aspects related to bugs and
those ones that influences the increasing in number of
bugs, i.e changes applied during the system develop-
ment.
Threats to external validity are related to the gen-
ICSOFT 2021 - 16th International Conference on Software Technologies
308

eralization of the obtained results. Only five open-
source projects were considered for evaluation, writ-
ten in the same programming language (Java) and
considering a single version. However, we performed
cross-project validation, for each prediction model we
used four other projects to validate it.
6 CONCLUSION AND FUTURE
WORK
Reliability of a system is investigated in this paper
via bugs and changes. Our approach exploits a neural
network model to predict reliability considering two
relevant aspects: post-release defects and changes ap-
plied during the software development life cycle. The
CK metrics are used as independent variables in the
prediction model.
Five open-source projects are used to design the
experiments, two major perspectives being explored,
both using cross-project experiments: to identify the
optimum weight values for bugs and changes and to
discover the proper project used for training.
The results show that for both cross-project exper-
iments, the best accuracy is obtained for the models
with the highest weights for the bugs, thus 75B25C
and that the appropriate project to be used as training
is the PDE project.
As one of our future work, we aim to extend the
proposed model for reliability prediction and to bet-
ter emphasize its applicability through more case-
studies. At the same time, further investigation on
how to empirically determine the metric weights will
be considered.
REFERENCES
Carleton, A. D., Harper, E., Menzies, T., Xie, T., Eldh, S.,
and Lyu, M. R. (2020). The ai effect: Working at the
intersection of ai and se. IEEE Software, 37(4):26–35.
Chidamber, S. and Kemerer, C. F. (1994). A metrics suite
for object oriented design. IEEE Transactions on Soft-
ware Engineering, 20(6):476–493.
Chitra, S., Thiagarajan, K., and Rajaram, M. (2008). Data
collection and analysis for the reliability prediction
and estimation of a safety critical system using airs. In
2008 International Conference on Computing, Com-
munication and Networking, pages 1–7.
D’Ambros, M., Lanza, M., and Robbes, R. (2010). An ex-
tensive comparison of bug prediction approaches. In
2010 7th IEEE Working Conference on Mining Soft-
ware Repositories (MSR 2010), pages 31–41.
Derrac, J., Garcia, S., Molina, D., and Herrera, F. (2011). A
practical tutorial on the use of nonparametric statisti-
cal tests as a methodology for comparing evolutionary
and swarm intelligence algorithms. Swarm and Evo-
lutionary Computation, 1:3–18.
Geremia, S. and Tamburri, D. A. (2018). Varying de-
fect prediction approaches during project evolution:
A preliminary investigation. In 2018 IEEE Workshop
on Machine Learning Techniques for Software Quality
Evaluation (MaLTeSQuE), pages 1–6.
Kitchenham, B., Pfleeger, S. L., and Fenton, N. E. (1995).
Towards a framework for software measurement vali-
dation. IEEE Transactions on Software Engineering,
21(12):929–944.
Li, W. (1998). Another metric suite for object-oriented
programming. Journal of Systems and Software,
44(2):155 – 162.
Li, X., Mutha, C., and Smidts, C. S. (2016). An automated
software reliability prediction system for safety crit-
ical software. Empirical Softw. Engg., 21(6):2413–
2455.
Lou, J., Jiang, Y., Shen, Q., Shen, Z., Wang, Z., and Wang,
R. (2016). Software reliability prediction via rele-
vance vector regression. Neurocomput., 186(C):66–
73.
Mahmood, Z., Bowes, D., Lane, P. C., and Hall, T. (2015).
What is the impact of imbalance on software defect
prediction performance? In Proceedings of the 11th
International Conference on Predictive Models and
Data Analytics in Software Engineering, pages 1–4.
Marinescu, R. (2002). Measurement and Quality in Object
Oriented Design. PhD Thesis, Faculty of Automatics
and Computer Science, University of Timisoara.
Merseguer, J. (2003). Software Performance Engineering
based on UML and Petri nets. PhD thesis, University
of Zaragoza, Spain.
Moser, R., Pedrycz, W., and Succi, G. (2008). A com-
parative analysis of the efficiency of change metrics
and static code attributes for defect prediction. In
2008 ACM/IEEE 30th International Conference on
Software Engineering, pages 181–190.
Nayrolles, M. and Hamou-Lhadj, A. (2018). Clever: Com-
bining code metrics with clone detection for just-in-
time fault prevention and resolution in large indus-
trial projects. In Proceedings of the 15th Interna-
tional Conference on Mining Software Repositories,
page 153–164. Association for Computing Machin-
ery.
Russel, S. and Norvig, P. (1995). Artificial intelligence: a
modern approach. Englewood Cliffs, N.J. : Prentice
Hall.
Schneidewind, N. F. (1997). Reliability modeling for
safety-critical software. IEEE Transactions on Reli-
ability, 46(1):88–98.
Shrikanth, N., Majumder, S., and Menzies, T. (2021). Early
life cycle software defect prediction. why? how? In
2021 IEEE/ACM 43rd International Conference on
Software Engineering (ICSE), pages 448–459.
Tang, M.-H., Kao, M.-H., and Chen, M.-H. (1999). An em-
pirical study on object-oriented metrics. In Proceed-
ings Sixth International Software Metrics Symposium
(Cat. No.PR00403), pages 242–249.
Towards a Neural Network based Reliability Prediction Model via Bugs and Changes
309
