
A Study on the Effects of Response Time on Travel Package
Attributes
Usha Ananthakumar and Sagun Pai
Indian Institute of Technology Bombay, Mumbai, India
Keywords: Consumer Behavior, Conjoint Analysis, Demographic Profiling, Tourism Preferences, Willingness to Pay.
Abstract: The rapid growth of online surveys in the past decade has raised questions about the effects of response time
on the results. The focus of our current study is to discuss the impact of response time on various travel
package attributes, thereby understanding consumer cognitive process. This study makes use of a recently
conducted conjoint analysis experiment on travel package preferences in order to gain insights into the impact
of response time on attribute importance and willingness to pay (WTP). Accordingly, the respondents are
grouped as fast and slow depending on their response time and their differences in conjoint attribute
importance estimates are investigated. The study also examines the changes in consumer willingness to pay
for the two groups. Additionally, the distinctions in socioeconomic characteristics between the fast and slow
respondents are also analyzed. The results and conclusions obtained from this research will help tour operators
to scrutinize the time taken by consumers and thereby deploy appropriate marketing strategy based on the
respective importance values and WTP trends.
1 INTRODUCTION
Survey based research has been one of the most
prominent mechanisms to elicit social response
through both direct and indirect techniques. With the
advent of the internet, online surveys have become a
popular way to conduct survey research due to better
data management, cost-effectiveness, wider target
population and higher user interactivity (Benfield and
Szlemko, 2006; Couper, 2000; Malhotra, 2008; Van
Selm and Jankowski, 2006; Höhne et al, 2018). The
use of online surveys also provides respondents the
flexibility to take as much time to think as required
because of absence of external pressure (Cook et al,
2011). The response time taken to fill up the survey
can be easily measured in case of online surveys
without obstructing the respondent’s thinking
process. The time thus gathered, can be used to derive
valuable insights into consumer behavioral patterns
and decision making process (Baxter and Hinson,
2001; Skowronski and Carlston, 1987; Mayerl et al,
2019; Gibbons and Rammsayer, 1999; Hertel et al,
2000; Sheppard and Teasdale, 2000; Mayerl, 2013).
Although response time is well researched to have
impact on customers, not many studies analyze the
impact of response time on the importance given by
customers to various product attributes. One such
study was done by Holmes et al (1998) wherein they
observed willingness to pay trends according to
survey response time for a conjoint analysis setup.
Conjoint analysis is a popular indirect measurement
technique used to understand consumer preferences
and tradeoff depending upon product attributes
(Green and Wind, 1975; Ryan, 1999). Consumers are
asked to rate different product profiles with varying
attributes in order to understand changes in their
underlying importance (Hobbs, 1996; Phillips et al,
2002). These ratings are then modified to part worth
utilities and relative importance measures for product
attributes so as to evaluate consumer preferences. In
addition to determining product attribute utilities,
conjoint analysis has also been used to estimate
willingness to pay for changes in certain attributes
(Gensler et al, 2012; Palumbo, 2011; Breidert et al,
2006). However, the existing literature on conjoint
analysis with implications of response time is limited
and it fails to provide a detailed analysis of the effects
of time on importance values of product attributes.
The focus of our current study is to discuss the
impact of response time on conjoint importance
values, thereby understanding consumer cognitive
process. This study makes use of the survey results
carried out to find out the importance and willingness
Ananthakumar, U. and Pai, S.
A Study on the Effects of Response Time on Travel Package Attributes.
DOI: 10.5220/0010600600790087
In Proceedings of the 10th International Conference on Data Science, Technology and Applications (DATA 2021), pages 79-87
ISBN: 978-989-758-521-0
Copyright
c
2021 by SCITEPRESS – Science and Technology Publications, Lda. All rights reserved
79

to pay for different attributes of tour packages on
analyzing tourist preferences (Pai & Ananthakumar,
2017). In order to examine the effects of response
time, we categorize the survey respondents into two
types, namely slow and fast, as per their survey
response times. We then move on to identify
differences between the two groups depending upon
their preference for certain attributes. We also aim to
examine the changes in consumer willingness to pay
for the two groups. The differences between the two
groups in terms of both attribute importance and
willingness to pay can be utilized while developing
effective marketing strategies.
The remainder of the paper is structured as
follows: Section 2 involves related literature review
for response time effects on consumer decisions;
Section 3 describes our data and methodology;
Section 4 provides the results of our analysis and
Section 5 presents the conclusions and marketing
implications of our study.
2 LITERATURE REVIEW
For answering a typical survey question, the
respondents are required to complete multiple
cognitive tasks such as question comprehension,
judgment, choice comparison, response formatting
(Tourangeau et al, 2000) and hence the entire process
of survey completion involves significant cognitive
efforts. Prior to the advent of internet-based surveys,
researchers explored the effect of respondents’ time
to think on survey responses (Svedsater 2007; Cook
et al. 2007, 2012). It was observed that time to think
reduces uncertainty about response as well as the
willingness to pay (WTP). Cook et al (2012) also
found a correlation between individual reflection time
and demand for the product to be valued under the
valuation task.
With the increase in the number of online and
computer assisted surveys, multiple studies have tried
to explore the impact of objectively measured
response time on the responses. Holmes et al (1998)
observed that response time systematically affects the
preference structure for rainforest protection in an
adaptive conjoint analysis experiment. They also
found that an increase in response time also results in
an increase in preference intensity, i.e. how strongly
respondents prefer one product over another. Haaijer
et al (2000) used a multinomial probit (MNP) model
to show that greater response time results in more
systematic responses due to decrease in the error
variance.
Rose and Black (2006) demonstrate that response
time not only influence heterogeneity within the mean
of parameter distributions, but also has a significant
influence upon variance heterogeneity. Brown et al
(2008) noticed that responses become more stable
with time and the response time falls with increase in
the number of comparison tasks, due to increasing
familiarity and experience. Bonsall and Lythgoe
(2009) examined the determinants of response time in
a choice experiment survey and showed that
demographic factors such as age, education level as
well as choice order and scenario complexity
influence the response time. Hess and Stathopoulos
(2013) deployed a response time model using survey
engagement as a latent variable and observed positive
correlation between response time and engagement.
Campbell et al (2018) extended the latent class time
model with different scales across classes to reveal
that response becomes more and more deterministic
with increase in response time. In a recent research,
Marquis (2021) utilized the response times to study
the problem of cheating in political knowledge tests
and clearly indicated response time analysis to be a
promising strategy for alleviating the problem of
cheating behaviour.
The causes for faster or slower response times can
differ for various respondents. Well informed,
opinionated individuals may respond quicker than
their counterparts (Krosnick 1989; Bassili 1993).
Alternatively, individuals with lesser motivation or
cognitive skills might rush through the survey and
hence report lower response times (Malhotra 2008).
The mode and format of survey administration, online
or offline, might also affect the response times.
Heerwegh (2002) compared the response times for
radio buttons and drop-down boxes and found that
radio buttons recorded faster response time.
Additionally, respondent involvement has also
been known to have a significant impact on
willingness-to-pay estimates (Berrens et al 2004).
Svedsater (2007) found that giving respondents time
to think decreased WTP for donations to an
environmental program among students. Macmillan
et al (2002) found that respondents who were not
given time to think had mean WTP 2–4 times greater
than those who were given significant time. Similarly,
Subade (2007) observed that WTP estimates reduced
without intervention of interviewers, who would
otherwise control the flow of the survey and thereby
increase the completion time. Cook et al (2012) argue
that time to think removes interviewer bias and helps
interviewees take well informed choices after
properly researching or consulting with their friends
and family. However, the literature lacks when it
DATA 2021 - 10th International Conference on Data Science, Technology and Applications
80

comes to studying the effects of response time
specifically on conjoint analysis estimates of WTP.
This motivates our study to answer how exactly
response time affects importance attached by
consumers to various attributes and WTP values.
3 DATA AND METHODOLOGY
This study uses data from a survey that investigates
the importance of various travel package attributes in
a conjoint analysis setup (Pai & Ananthakumar,
2017). The main aspects of this work are stated so that
it can be taken forward in the present study. Conjoint
analysis is a popular marketing analysis technique
used to estimate both the individual importance
values of product attributes as well as its combined
influence with other attributes on customers’ product
choices (Lewis, Ding and Geschke, 1991). To
conduct a conjoint analysis experiment, three main
steps must be followed: (1) identify the attributes, (2)
determine attribute levels, and (3) compile the
attribute profiles (Van der Pol and Ryan,1996). For
this study, a conjoint analysis experiment to explore
consumer preferences for travel packages was
conducted. Six different travel package attributes
including price, length of stay, hotel rating, season of
travel, destination and mode of transport were chosen.
Each of the six attributes was further expanded into
five levels as described in Table 1. By applying the
principles of orthogonal array design, the entire full
factorial design of all levels (5x5x5x5x5x5 i.e 15625
profiles) was reduced to 25 tour packages so that the
effects of attributes could be studied without any
interference (Green, 1974; Hair et al., 2006).
A comprehensive online questionnaire
comprising 33 questions split into two segments was
devised. The first segment included questions to
assess the socioeconomic background of the survey
participant. Details such as gender, age, occupation,
income and marital status were gathered in this
segment. In the second segment, the participants were
asked to rate the 25 tour packages on a scale of 1 to
10, with 10 representing most interested and 1
representing least interested. Instead of just providing
plain textual description, the 25 tour packages were
accompanied with pictures displaying features of the
corresponding package so that the participants would
get a better idea of the levels. A total of 168
individuals completed the survey, out of which 153
responses (15 incomplete responses removed) were
used for the analysis. Details of the respondents’
backgrounds are described in Table 2.
Table 1: Tour package attributes and levels.
A
ttributes
L
evels
Price < 20k, 20 - 35k, 35 - 50k, 50 - 75k, > 75
k
Len
g
th of sta
y
<3, 4, 5 - 7, 8 - 10, >11
Hotel ratin
g
1, 2, 3, 4, 5
Season Winter(December - February),
Spring(March - April), Summer(May -
June), Monsoon(July - September),
Autumn(Septembe
r
- November)
Destination Adventure & Activity, Beach, Hill
station, Herita
g
e & Wildlife, Pil
g
rima
g
e
Mode of
transport
Flight, Train, Bus, Car, Minibus
Table 2: Socioeconomic characteristics of the sample.
Characteristic %
Gender:
Male 48
Female 52
Ag
e
(y
ears
)
:
Less than 25 27
25 - 40 18
40
–
60 49
60 o
r
above 6
Famil
y
Status:
Single 34
Marrie
d
66
Occupation:
Working 69
Non-working* 31
Income (in INR):
Less than 0.2 million 29
0.2 - 0.6 million 22
Greate
r
than 0.6 million 49
*Non-working refers to respondents who are students or
retired or unemployed
Conjoint analysis gives attribute importance and
part-worth utilities at both aggregate as well as
individual level (North, De Vos, & Kotze, 2003).
Part-worth utility values measure the consumer
preference for levels within attributes, with greater
values denoting higher consumer liking for the level.
The basic conjoint analysis model used in our study
is as follows:
𝑟=𝛽
+𝛽
𝑑
+𝛽
𝑑
+𝛽
𝑑
+𝛽
𝑑
+𝛽
𝑑
+𝛽
𝑑
+𝜀 (1)
where r denotes user rating for corresponding tour
package, d1 denotes price, d2 denotes length of stay,
d3 denotes hotel rating, d4 denotes season, d5 denotes
destination, d6 denotes mode of transport, βs the
corresponding coefficients and ε denotes the error
term. The six tour package attributes were chosen as
independent variables whereas respondent ratings
A Study on the Effects of Response Time on Travel Package Attributes
81

were chosen as the dependent variable. Using the
estimated beta values, relative importance of the
attribute is a measure to understand how important a
particular attribute is compared to the rest (Orme,
2010) and can be given as:
𝑅𝐼
=
∑
(2)
where βjkl indicates the corresponding conjoint
model weights for attribute k. Additionally, we also
estimate the marginal willingness to pay (MWTP) for
certain attribute level changes. MWTP can be viewed
as the marginal rate of substitution (MRS) between
price and non-price attributes. It provides a monetary
value to identify fluctuations in the utility associated
with product adjustments. Utility and price can be
used to estimate MWTP from level l to level h of
attribute k for an individual j as follows (Jedidi and
Jagpal, 2009):
𝑀𝑊𝑇𝑃
ℎ,𝑙
=
𝛽
−𝛽
(3)
where pj denotes the levels of the price attribute and
the βj1l represents the corresponding part-worth
utilities. The minimum and maximum price levels used
for computing minimum MWTP values were 20,000
and 75,000 INR respectively. In order to compute
MWTP, classes were identified for the attributes. For
hotel ratings, the classes were - Budget hotels (1, 2 star)
and Luxurious hotels (3, 4, 5 star). Similarly, the length
of stay was divided into two categories - Short stay (4
or less), and Long stay (5 or more). Mode of transport
was divided into flight and land routes. Minimum
attribute MWTP values were found by considering
maximum difference in the change of class by using
minimum utility value from the higher class and the
maximum utility value from the lower class. It was
observed that under the given conditions, the best
representative based on the frequencies of budget hotel
to luxurious hotel was 2 star to 3 star, and for short stay
to long stay was less than 3 days to greater than 11
days. Trains were selected for representing land-based
mode of transport due to their maximum utility value.
Yan and Tourangeau (2008) found multiple item
specific features involving response time of survey
such as question length, toughness of the question and
position of the question within the survey. Total
completion time averages out the effects of such
various factors pertaining to each question and hence
in our study, the total survey completion time (in
minutes) was recorded for response time analysis.
Descriptive statistics for completion time are presented
in Table 3.
To analyze the survey response time, the
respondents are divided into two groups.
Respondents with response time less than 7 minutes
are classified as fast respondents whereas those with
response time greater than or equal to 7 minutes are
classified as slow respondents. The chosen time
boundary value is the greatest integer completion
time less than the median completion time. In order
to identify differences between the groups,
multivariate analysis of variance (MANOVA) test is
carried out on the attribute importance values derived
from the conjoint analysis. This is followed by
analysis of variance (ANOVA) on each of the six
attribute importance to recognize where the
difference stems from within the groups. Similarly,
the three MWTP values are also tested for differences
by using MANOVA, followed by ANOVA. We also
analyze the groups to determine which group
dominates for the individual willingness to pay.
Following this, we conduct a thorough profiling of the
socioeconomic data gathered from the survey and
attempt to figure out the slow and fast groups based
on their demographic features. Subsequent to this,
appropriate statistical tests are carried out to confirm
if the groups are different based on various
demographic characteristics.
Table 3: Descriptive Statistics.
Measure
Completion time (mins)
Mean 7.57
Median 7.27
Standar
d
deviation 3.13
Maximu
m
14.67
Minimu
m
1.77
33
rd
p
ercentile 5.8
66
th
p
ercentile 8.45
4 RESULTS AND DISCUSSION
The following subsections contain a detailed
discussion of the most noteworthy findings of our
study.
4.1 Differences based on the Response
Time
The relative importance values estimated by the
conjoint analysis technique can be used to get an idea
of the desirability of each of the travel package
attributes. Figure 1 shows the aggregate average
relative importance values for all the attributes. The
attributes in descending order of importance are hotel
DATA 2021 - 10th International Conference on Data Science, Technology and Applications
82
rating (21.57%), price (19.58%), length of stay
(16.63%), mode of transport (14.98%), destination
(13.99%) and season (13.25%). Tables 4 and 5
respectively describe the MANOVA and ANOVA
results for the conjoint importance values for the two
groups. MANOVA reveals that there are significant
differences between the importance values for slow
and fast respondents (p < 0.05). ANOVA results show
that among the attributes, importance for length of
stay, hotel ratings, destination and mode of transport
differed between the two groups. Price and season are
found to have more or less the same importance for
all the respondents. This could be because, price of a
tour package is a factor which is somewhat pre-
decided by individuals depending upon their budget.
Likewise, season is another factor which is given
similar importance by all consumers probably due to
high preference for a pleasant travel weather which
matches their work schedule.
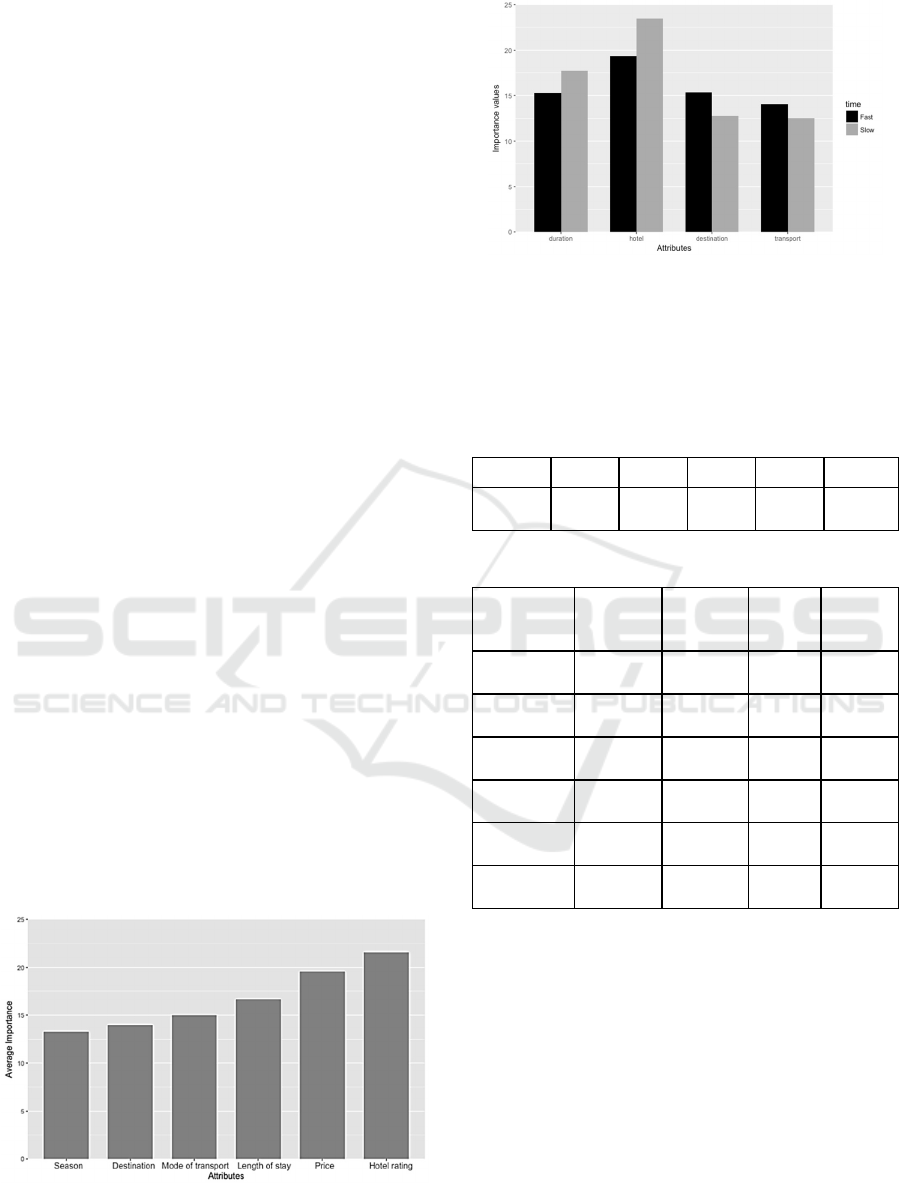
The group means for the four significantly
different attributes are compared to each other. It is
found that mean importance for duration (Mfast =
15.32, Mslow = 17.74) and hotel rating (Mfast =
19.31, Mslow = 23.46) are greater for slow
respondents compared to fast respondents. On the
other hand, mean importance for destination (Mfast =
15.39, Mslow = 12.79) and mode of transport (Mfast
= 14.09, Mslow = 12.54) are found to be higher for
fast respondents. Duration and hotel ratings are found
to have higher importance values in the aggregate
results whereas destination and mode of transport
feature in the bottom two attributes. It is also found
that the mean importance values for all the four
attributes are somewhat similar for fast respondents
whereas slow ones specifically show more
importance towards overall importance attributes i.e
duration and hotel ratings. This suggests that slow
respondents actually gave a more careful thought
while deciding the importance attributes and not so
Figure 1: Average importance of the attributes in
percentage in increasing order.
Figure 2: Average importance values in percentage for fast
and slow groups.
much for the relatively unimportant attributes. Figure
2 shows the comparisons between importance values
for the fast and slow respondents.
Table 4: MANOVA results for conjoint importance values.
Statistic Value F Num Df Den Df Pr (>F)
Wilk’s
Lambda
0.853 4.208 3 146 0.00062
Table 5: ANOVA results for conjoint importance values.
Attribute
used for the
test
Source Mean
square
F value Pr (>F)
Price Model
Residual
121.64
56.76
2.143 0.1453
Duration Model
Residual
350.86
52.90
6.632 0.0109
Hotel rating Model
Residual
620.99
74.04
8.839 0.0434
Destination Model
Residual
310.67
60.726
5.116 0.0251
Season Model
Residual
62.3
33.258
1.873 0.1731
Mode of
trans
p
ort
Model
Residual
850.20
47.79
17.79 4.2e-05
When it comes to marginal willingness to pay
(MWTP), MANOVA results suggest that there are
differences between the groups (p < 0.05). ANOVA
reveals that the source of these differences is the
MWTP for transport (train to flight) and duration
(short to long stay) to some extent (p < 0.10). The
remaining MWTP value i.e budget to luxurious hotel
is found to be consistent across the groups. Thus,
hotel rating, which was relatively an important
attribute, show similar willingness to pay in spite of
differences in importance. It is also found that MWTP
for train to flight is considerably larger for fast
respondents (Mfast = 18983 INR) as opposed to slow
ones (Mslow = 5448 INR). Similarly, MWTP for
A Study on the Effects of Response Time on Travel Package Attributes
83
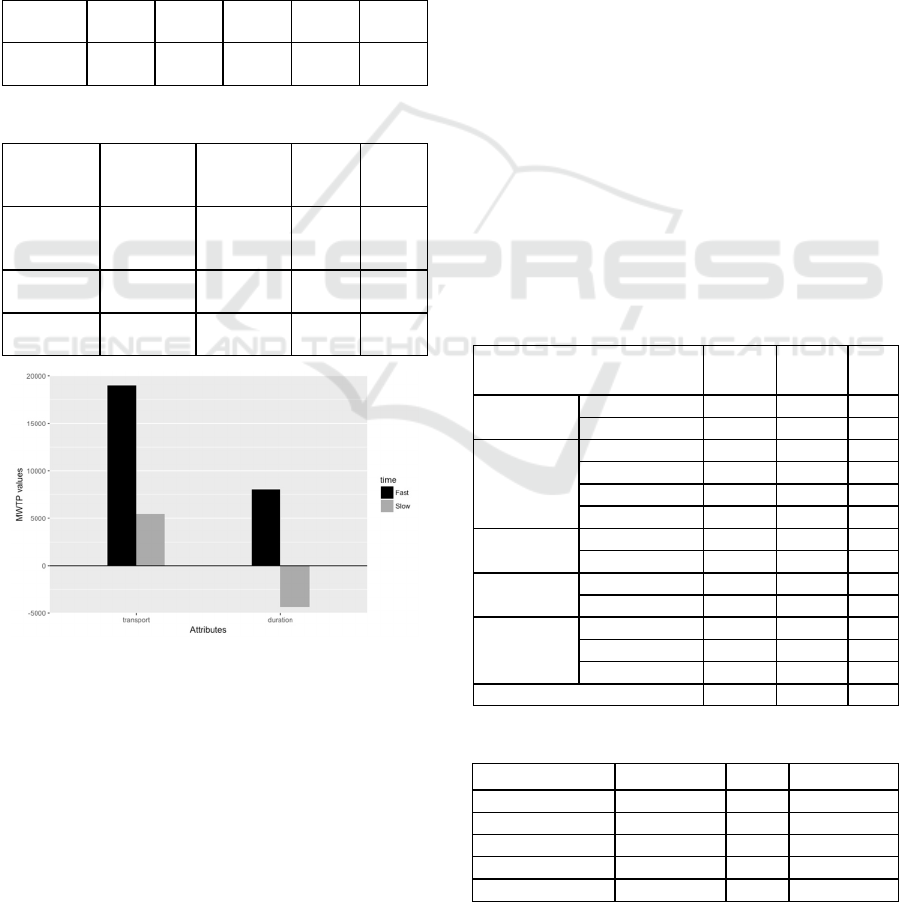
short to long stay is higher for fast respondents (Mfast
= 8073 INR) as compared to their slow counterparts
who have negative MWTP values (Mslow = -4355
INR). This means that for a travel agent willing to
make economic benefits from tweaking the travel
package attributes, the best option is to change mode
of transport and duration rather than any other feature.
The huge difference in the MWTP values reveals that
fast respondents have a strong opinion both in terms
of importance as well as spending budget for
transport and duration. Tables 6 and 7 respectively
describe the MANOVA and ANOVA results and
Figure 3 depicts the MWTP values.
Table 6: MANOVA results for willingness to pay.
Statistic Value F
Num
Df
Den
Df
Pr
(
>F
)
Wilk’s
Lambda
0.929 3.74 3 149 0.0125
Table 7: ANOVA results for willingness to pay.
Attribute
used for the
test
Source
Mean
square
F value Pr (>F)
Budget to
luxurious
hotel
Model
Residual
1.66e+09
1.03e+09
1.603 0.207
Short to
long sta
y
Model
Residual
5.86e+09
2.07e+09
2.83 0.0946
Train to
fli
g
ht
Model
Residual
6.96e+09
1.60e+09
4.343 0.0388
Figure 3: Average MWTP values in INR for fast and slow
groups.
4.2 Demographic Analysis of the
Respondents
As suggested by past studies, it is found that slow and
fast respondents indeed show different preference
structures. Importance for length of stay and hotel
rating are observed to be high amongst slow
respondents. These two attributes have considerable
share of importance in the overall travel package
combination. Fast respondents show higher affinity for
destination and mode of transport, both of which had
relatively low contribution to the travel package. This
demonstrates that slow respondents give more careful
thought in relatively important variables. However,
fast respondents are found to be more strongly
opinionated about their choices, which can be seen in
the high value of their MWTP for both transport and
duration. These findings align well with previously
conducted studies (Bassili 1993, Malhotra 2008).
Since we have established that response time does
have effects on consumer preferences, it is of interest
to study the characteristics of a customer and thereby
find whether a particular customer would take less or
more time. Accordingly, we decide to analyse the
demographic characteristics of the respondents in fast
and slow groups. The demographic details of the fast
and slow groups are described in Table 8.
In terms of demographics, respondents in the slow
group (n = 83) are more than that of fast group (n =
70). The slow group has more middle-aged adults
over the age of 40 and senior citizens. This group also
consists mainly married, working individuals within
the higher income group (greater than 0.6 million
INR). The fast group has more of younger population
of the age group below 25 years. This group consists
Table 8: Demographic profiles of the respondents.
Demographic attribute Group 1
(slow)
Group 2
(fast)
Total
Gender Male 47 32 79
Female 36 38 74
Age Less than 25 11 30 41
25 - 40 11 16 27
40
–
60 56 20 76
60 o
r
above 5 4 9
Family
Status
Marrie
d
67 34 101
Single 16 36 52
Occupation Working 62 44 106
Non-working 21 26 47
Income < 0.2 m 21 24 45
0.2 - 0.6 m 18 15 33
> 0.6 m 44 31 75
Average time taken (mins) 9.87 4.85
Table 9: Chi-square test results.
Attribute Chi-square df p value
Gende
r
2.7773 1 0.2494
A
g
e 22.081 1 2.613e-06
Famil
y
Status 16.093 1 6.032e-05
Occu
p
ation 1.9765 1 0.1598
Income 0.8342 1 0.361
DATA 2021 - 10th International Conference on Data Science, Technology and Applications
84

of mostly unmarried individuals. This profiling
indicates that the response time of an older customer
who is married is higher than a younger, single
person. It is interesting to note that the two groups did
not show any significant difference with respect to
gender, occupation and income. On inspection of the
average time to respond for the two groups, the slow
respondents clocked 9.87 minutes while fast
respondents took approximately half the time.
In order to confirm the differences between the
groups in terms of different demographic
characteristics, hypothesis testing was carried out for
each of the attributes. For comparing gender, we
chose the null hypothesis (H0) that the percentage of
male members is same for both the groups. For
comparing age, the null hypothesis was the
percentage of people above 40 years is the same for
both the groups. For comparing family status, the null
hypothesis was the percentage of married people is
the same for both the groups. For comparing
occupation, the null hypothesis was the ratio of
working people in both the groups was the same.
Finally, for income, the null hypothesis was the
fraction of people with income higher than 0.6 million
was the same in both the groups. Results of the chi-
square test for these hypotheses are shown in Table 9.
Based on the p value, we can reject the null
hypotheses for age and family status. This confirms
our claims that the two groups have differences
mainly in case of age and family status.
5 CONCLUSIONS
The focus of this study was to comprehend the effects
of response time on preferences of Indian travellers
for different tour package attributes. The results of the
conducted study have direct implications on key
purchase decisions as it aids travel agents in
understanding the consumer preferences. The results
from this research can be applied in tourism
management to create effective marketing strategies
that attract potential clients.
Based on the preliminary analysis, price, hotel
rating and duration were found to be relatively crucial
attributes whereas destination, season and mode of
transport were less important. This is consistent with
previously conducted studies on tour package
attributes (Jacoby and Olson, 1977; Chan and Wong,
2006). The classification of respondents into fast and
slow groups also provided key insights into the
consumer decision making process. Price is more or
less determined by the spending power of the
individual and not so much by the time taken.
Similarly, season of travel is something for which
consumers have a clear preference. Apart from these
two attributes, other four had significant differences
depending on the response time of respondents. Slow
respondents demonstrated a more careful attitude by
showing more importance for overall important
attributes such as duration and hotel ratings and less
for others. On the other hand, fast respondents
showed similar importance for all the attributes and
hence, had relatively more importance for mode of
transport and destination as compared to slower
individuals. This suggests that slow respondents are
more careful in their choices and spend more effort in
determining the overall important attributes as
compared to fast ones.
When it comes to willingness to pay, both the
groups showed similarities for MWTP for budget to
luxurious hotels. Though hotel ratings attributes were
more important for slow respondents, no significant
differences within MWTP were observed. This
means that although slow respondents identify these
as important attributes, they are not willing to shell
out more money. Alternatively, fast respondents were
found to have significantly larger MWTP for
transport (train to flight) and duration (short to long
stay). Transport was initially found to have more
importance for fast individuals and they also showed
larger economic preference towards the same. This
can be interpreted as faster individuals having strong
opinions about their preferences. On the other hand,
in case of duration, even though slow respondents
showed higher importance, they were not willing to
pay as much as the fast ones. Travel agents can use
this information to change transport factors in their
travel packages so as to maximize their economic
profits. Future studies can use these results and
attempt to identify random outliers such as older,
married people with faster responses, so as to
effectively analyze survey findings.
The demographic profiling of our slow and fast
respondents revealed that older, married, working
individuals tend to take higher time. This can be
attributed to their eagerness to understand more about
the products which they plan to purchase. On the
other hand, the younger, single, non-working
population showed a significantly lower time to
respond. This brings into light the effects of advances
in technology and social media that has created a
more informed youth population having lower
attention span. The way of handling response time in
our study can also be used in case of online marketing
wherein travel websites can track user behavior to
classify the respondent as fast or slow and thereby
provide suitable tour packages.
A Study on the Effects of Response Time on Travel Package Attributes
85

Few recent developments with regard to attributes
are worth considering for future studies. Gonzalez
(2019) focuses on the aspect of variation in attribute
importance measures and highlights the need for
reporting how these measures are obtained for better
comparison and interpretation. Though previous
literature is used to select the attributes in our present
study, Webb etal. (2021) has used best-worst scaling
survey to come up with certain criteria to guide
attribute selection for discrete choice experiments.
There are some shortcomings to this research.
Convenience sampling method was deployed to
collect the data because of limited availability of
manpower and resources. Therefore, the results
obtained in the study may not represent the entire
tourism sector. Orthogonal array design method was
applied in converting the full factorial design into a
smaller one that was finally used for the survey. There
could be some initial biases in the respondents due to
the order of survey questions, which could have been
reduced by randomizing the order of questions.
Lastly, this study was conducted for the Indian
tourism market and hence, all results might not be
directly extended to other regions. However, there is
good scope for future research broadening the
findings from this study, which can improve the
quality of tour packages provided and thereby the
global tourism industry.
REFERENCES
Bassili, J.N. (1993). Procedural efficiency and the
spontaneity of trait inference. Personality and Social
Psychology Bulletin, 19(2): 200-205.
Baxter, B.W., Hinson, R.E. (2001). Is smoking automatic?
Demands of smoking behavior on attentional resources.
Journal of Abnormal Psychology, 110(1): 59-66.
Benfield, J.A., Szlemko, W.J. (2006). Internet-based data
collection: Promises and realities. Journal of Research
Practice, 2(2), Retrieved from http://jrp.icaap.org/
index.php/jrp/article/viewFile/30/122.
Berrens, R.P., List, J.A., Bohara, A.K., Joe Kerkvliet, J.
(2004). Examining the role of social isolation on stated
preferences. American Economic Review, 94(3): 741-
752.
Breidert, C., Hahsler, M., Reutterer, T. (2006). A review of
methods for measuring willingness-to-pay. Innovative
Marketing, 2(4): 8-32.
Brown, S.D., Heathcote, A. (2008). The simplest complete
model of choice response time: Linear ballistic
accumulation. Cognitive psychology, 57(3): 153-178.
Bonsall, P., Lythgoe, B. (2009). Factors affecting the
amount of effort expended in responding to questions
in behavioural choice experiments. Journal of Choice
Modelling, 2(2): 216-236
Campbell, D., Mørkbak, M.R., Olsen, S.B. (2018). The link
between response time and preference, variance and
processing heterogeneity in stated choice experiments.
Journal of Environmental Economics and
Management, 88: 18-34.
Chan, E.S.W., Wong, S.C.K. (2006). Hotel selection: when
price is not the issue. Journal of Vacation Marketing,
12 (2): 142–159.
Cook, D.A., Thompson, W.G., Thomas, K.G. (2011). The
motivated strategies for learning questionnaire: score
validity among medicine residents. Medical education,
45(12): 1230-1240.
Cook, J., Jeuland ,M,, Maskery, B., Whittington, D. (2012).
Giving stated preference respondents “time to think”:
results from four countries. Environmental and
Resource Economics, 51(4): 473-496.
Cook, J., Whittington, D., Canh, D.G., Johnson, F.R.,
Nyamete, A. (2007). Reliability of stated preferences
for cholera and typhoid vaccines with time to think in
Hue, Vietnam. Economic Inquiry, 45(1): 100-114.
Couper, M.P. (2000). Usability evaluation of computer-
assisted survey instruments. Social Science Computer
Review, 18(4): 384-396.
Gensler, S., Hinz, O., Skiera, B., Theysohn, S. (2012).
Willingness-to-pay estimation with choice-based
conjoint analysis: Addressing extreme response
behavior with individually adapted designs. European
Journal of Operational Research, 219(2): 368-378.
Gibbons, H., Rammsayer, T.H. (1999). Differential effects
of personality traits related to the P-ImpUSS dimension
on latent inhibition in healthy female subjects.
Personality and Individual Differences, 27(6): 1157-
1166.
Gonzalez, J.M. (2019). A Guide to Measuring and
Interpreting Attribute Importance. Patient 12: 287–295
Green, P.E. (1974). On the design of experiments involving
multifactor alternatives. Journal of Consumer
Research, 1: 61-68.
Green, P.E., Wind, Y. (1975). New way to measure
consumers’ judgments. Harvard Business Review,
53(4): 107-117.
Haaijer, R., Wagner, K., Wedel, M. (2000). Response
latencies in the analysis of conjoint choice experiments.
Journal of Marketing Research, 37(3): 376-382.
Hair, J., Black, W., Babin, B., Anderson, R.E. (2010).
Multivariate Data Analysis, 7th ed. Pearson Prentice
Hall, Upper Saddle River, NJ.
Heerwegh, D., Loosveldt, G. (2002). An evaluation of the
effect of response formats on data quality in web
surveys. Social science computer review, 20(4): 471-
484.
Hess, S., Stathopoulos, A. (2013). Linking response quality
to survey engagement: a combined random scale and
latent variable approach. Journal of choice modelling,
7: 1-12.
Hobbs, J.E. (1996). A transaction cost analysis of quality,
traceability and animal welfare issues in UK beef
retailing. British Food Journal, 98(6): 16-26.
Höhne, J.K., Schlosser, S. (2018). Investigating the
adequacy of response time outlier definitions in
DATA 2021 - 10th International Conference on Data Science, Technology and Applications
86

computer-based web surveys using paradata
SurveyFocus. Social Science Computer Review, 36(3):
369-378.
Holmes, T., Alger, K., Zinkhan, C, Mercer, E. (1998). The
effect of response time on conjoint analysis estimates of
rainforest protection values. Journal of Forestry
Economics, 4(1): 7-28.
Hertel, G., Neuhof, J., Theuer T., Kerr, N.L. (2000). Mood
effects on cooperation in small groups: Does positive
mood simply lead to more cooperation? Cognition &
emotion, 14(4): 441-472.
Jacoby, J., Olson, J.C. (1977). Consumer Response to Price:
an Attitudinal, Information Processing Perspective. In
Y, Wind & M, Greenberg (Ed.). Moving Ahead with
Attitude Research (pp. 73-86). Chicago: American
Marketing Association.
Krosnick, J.A., Alwin, D.F. (1989). Aging and
susceptibility to attitude change. Journal of personality
and social psychology, 57(3): 416-425.
Lewis, R., Ding, S., Geschke, U. (1991). Conjoint analysis
and its application in the hospitality industry. Retrieved
from https://scholar.lib.vt.edu/ejournals/JIAHR/issue2
Macmillan, D.C., Philip, L., Hanley, N., Alvarez- Farizo,
V. (2002). Valuing the non-market benefits of wild
goose conservation: a comparison of interview and
group-based approaches, Ecological Economics, 43:
49-59.
Malhotra, N. (2008). Completion time and response order
effects in web surveys. Public opinion quarterly, 72(5):
914-934.
Marquis, L. (2021) Using response times to enhance the
reliability of political knowledge items: An application
to the 2015 swiss post-election survey, Survey Research
Methods, 15: 79-100.
Mayerl, J. (2013). Response latency measurement in
surveys: Detecting strong attitudes and response
effects. Survey Methods: Insights from the Field,
Retrieved from https://surveyinsights.org/?p=1063.
Mayerl, J., Andersen, H., Giehl, C. (2019). Identification of
Measurement Problems of Survey Items and Scales
Using Paradata. In N, Menold & T, Wolbring (Ed.).
Qualitätssicherung sozialwissenschaftlicher
Erhebungsinstrumente, (pp. 9-35). Wiesbaden:
Springer VS.
North, E.J., De Vos R.B., Kotze, T. (2003). The importance
of apparel product attributes for female buyers. Journal
of Consumer Sciences, 31(1): 41-51.
Orme, B.K. (2010). Getting Started with Conjoint Analysis:
Strategies for Product and Pricing Research. Research
Publishers LLC.
Pai, S., Ananthakumar, U. (2017). Understanding tourist
preferences for travel packages: a conjoint analysis
approach. Asia Pacific Journal of Tourism Research,
22(12): 1238-1249.
Palumbo, A., De La Fuente, P., Rodríguez, M., Sanchez, F.,
Martinez-Salazar, J., Munoz, M., Marqueta, J.,
Hernandez, J., Espallardo, O., Polanco, C., Paz, S.,
Lizan,L. (2011). Willingness to pay and conjoint
analysis to determine women's preferences for ovarian
stimulating hormones in the treatment of infertility in
Spain. Human reproduction, 26(7): 1790-1798.
Phillips, K., Johnson, R., Maddala, T. (2002). Measuring
what people value: a comparison of attitude and
preference surveys. Health Services Research Journal,
37(6): 1659-1679.
Rose, J.M., Black, I.R. (2006). Means matter, but variance
matter too: Decomposing response latency influences
on variance heterogeneity in stated preference
experiments. Marketing Letters, 17(4): 295-310.
Ryan, M. (1999). Using conjoint analysis to take account of
patient preferences and go beyond health outcomes: an
application to in vitro fertilization. Social Science &
Medicine, 49: 535-546.
Sheppard, L.C., Teasdale, J.D. (2000). Dysfunctional
thinking in major depressive disorder: A deficit in
metacognitive monitoring? Journal of Abnormal
Psychology, 109(4): 768-776.
Skowronski, J.J., Carlston, D.E. (1987). Social judgment
and social memory: The role of cue diagnosticity in
negativity, positivity, and extremity biases. Journal of
personality and social psychology, 52(4): 689-699.
Svedsater, H. (2007). Ambivalent statements in contingent
valuation studies: inclusive response formats and
giving respondents time to think. Australian journal of
agricultural and resource economics, 51(1): 91-107.
Tourangeau, R., Rips, L.J., Rasinski, K. (2000). The
psychology of survey response. Cambridge University
Press.
Van Der Pol, M., Ryan, M. (1996). Using conjoint analysis
to establish consumer preferences for fruit and
vegetables. British Food Journal, 98(8): 5-12.
Van Selm M, Jankowski NW (2006) Conducting online
surveys. Quality and Quantity, 40(3): 435-456.
Webb, E.J.D., Meads, D., Lynch, Y., Judge, S., Randall, N.,
Goldbart, J., Meredith, S., Moulam, L., Hess, S.,
Murray, J. (2021). Attribute selection for a discrete
Choice experiment incorporating a best-worst scaling
survey. Value Health, 24(4): 575-584.
Yan, T., Tourangeau, R. (2008). Fast times and easy
questions: The effects of age, experience and question
complexity on web survey response times. Applied
Cognitive Psychology: The Official Journal of the
Society for Applied Research in Memory and
Cognition, 22(1): 51-68.
A Study on the Effects of Response Time on Travel Package Attributes
87
