
A System Dynamics Model Approach for Simulating
Hyper-inflammation in Different COVID-19 Patient Scenarios
Vladimir Estivill-Castro
3 a
, Enrique Hern
´
andez-Jim
´
enez
1,2 b
and David F. Nettleton
3 c
1
Institut d’Investigaci
´
o Biom
`
edica de Bellvitge, Barcelona, Spain
2
Loop Diagnostics S.L., Barcelona, Spain
3
Department of Information and Communications Technology (DTIC), Universitat Pompeu Fabra, Spain
Keywords:
Simulation of Biological Systems, Case Studies, Immune System Response, Model Construction,
Rule-induction, Machine Learning.
Abstract:
The exceptionally high virulence of COVID-19 and the patients’ precondition seem to constitute primary fac-
tors in how pro-inflammatory cytokines production evolves during the course of an infection. We present a
System Dynamics Model approach for simulating the patient reaction using two key control parameters (i)
virulence, which can be “moderate” or “high” and (ii) patient precondition, which can be “healthy”, “not
so healthy” or “serious preconditions”. In particular, we study the behaviour of Inflammatory (M1) Alveolar
Macrophages, IL6 and Active Adaptive Immune system as indicators of the immune system response, together
with the COVID viral load over time. The results show that it is possible to build an initial model of the system
to explore the behaviour of the key attributes involved in the patient condition, virulence and response. The
model suggests aspects that need further study so that it can then assist in choosing the correct immunomod-
ulatory treatment, for instance the regime of application of an Interleukin 6 (IL-6) inhibitor (tocilizumab) that
corresponds to the projected immune status of the patients. We introduce machine learning techniques to
corroborate aspects of the model and propose that a dynamic model and machine learning techniques could
provide a decision support tool to ICU physicians.
1 INTRODUCTION
Infectious pandemic corona-virus disease (COVID-
19), caused by severe acute respiratory disease
Corona-virus 2 syndrome (SARS-CoV-2) is rapidly
spreading worldwide (Salehi et al., 2020). In the
case of COVID-19, a worsening has been observed
from 7 to 8 days. However, this only occurs in some
patients; and because of an over-reaction of the im-
mune system (Pedersen and Ho, 2020). During this
pandemic, the challenge is to diagnose those patients
who are not getting worse; and thus free up space for
those who need intensive care when they develop res-
piratory failure due to acute respiratory distress syn-
drome; the main cause of mortality. In a recent retro-
spective, multi-center study of 150 confirmed cases of
COVID-19 in Wuhan, China, the authors suggest that
mortality could be due to hyper-inflammatory sep-
sis (Chan et al., 2020).
a
https://orcid.org/0000-0001-7775-0780
b
https://orcid.org/0000-0002-8232-8151
c
https://orcid.org/0000-0002-5852-7716
After a coronavirus infection (COVID19, SARS-
CoV-2), patients with a more unfavourable course
present a higher viremia; this viremia is also more
persistent than those with a more benign course (Les-
cure et al., 2020). This fact will provoke a greater in-
tensity in the inflammatory response and involvement
of the different target organs. In clinical practice, we
can monitor the evolution of the immune response by
quantifying IL6, PCR, DD, troponin, LDH, and lym-
phopenia (Pedersen and Ho, 2020). From a concep-
tual point of view, the best therapeutic tool could be
the early and aggressive use of specific antiviral treat-
ments; but for those patients who evolved in an un-
favourable way, the course of action seems to be an
immunomodulatory treatment with increased health-
care resources (Yao et al., 2020). This care scheme
is currently impossible, we do not have any effective
antiviral treatment or tools that predict the evolution
of patients in the early stages of the clinical picture,
when patients are asymptomatic.
A first promising study (Gautret et al., 2020)
showed that patients with COVID-19 treated with hy-
Estivill-Castro, V., Hernández-Jiménez, E. and Nettleton, D.
A System Dynamics Model Approach for Simulating Hyper-inflammation in Different COVID-19 Patient Scenarios.
DOI: 10.5220/0010600301410153
In Proceedings of the 11th International Conference on Simulation and Modeling Methodologies, Technologies and Applications (SIMULTECH 2021), pages 141-153
ISBN: 978-989-758-528-9
Copyright
c
2021 by SCITEPRESS – Science and Technology Publications, Lda. All rights reserved
141
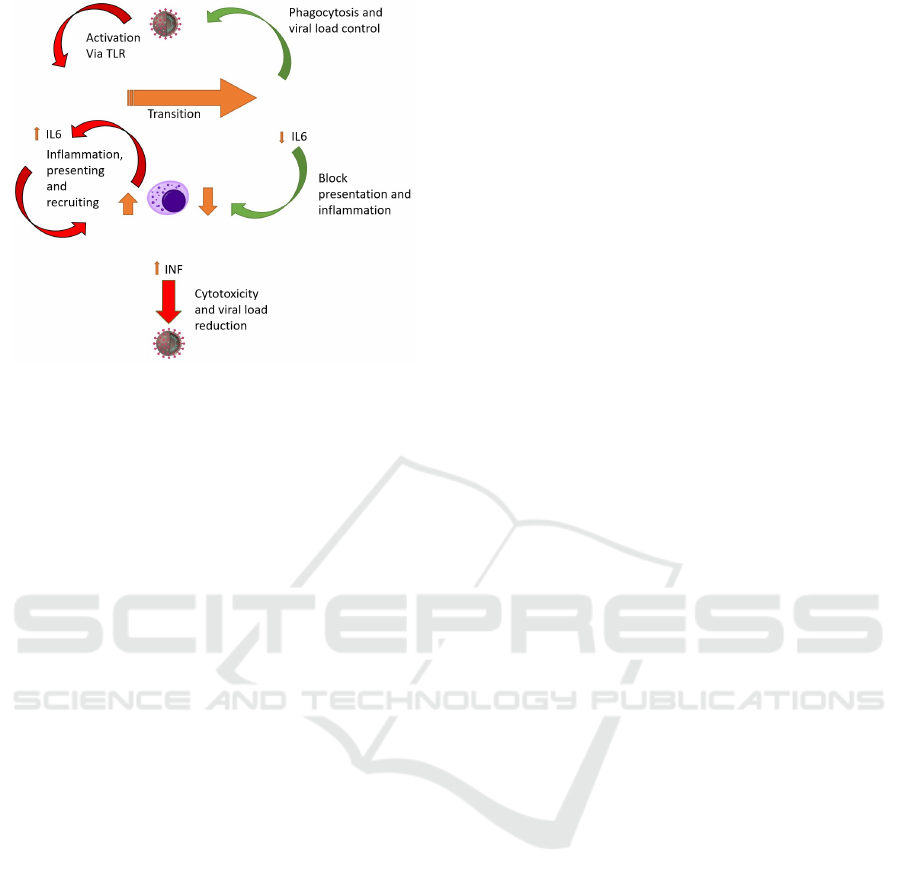
Figure 1: Schematic representation of the Immune System
reaction to COVID.
droxychloroquine and azithromycin cured their infec-
tion and limited the transmission of the virus. How-
ever, a larger study showed limited potential and
alerted of other possible side effects; thus their use
is questionable (FDA cautions against use of hydrox-
ychloroquine or chloroquine for COVID-19 outside
of the hospital setting or a clinical trial due to risk of
heart rhythm problems (FDA, 2020)). Additionally,
Interleukin 6 (IL-6) inhibitor (tocilizumab) had been
suggested for the treatment in COVID-19 (Zhang
et al., 2020b; Choy et al., 2020). However, we still
lack reliable studies and data to verify which patients
will be beneficiaries of this treatment. Furthermore,
the IL-6 inhibitor has potential hazards of inducing in-
fectious diseases. Other work is also warranted to de-
termine if these compounds could be useful as chemo-
prophylaxis to prevent virus transmission, especially
for healthcare workers. Currently, some clinical tri-
als have led researchers to claim that the COVID19
studies need new directions. However, there may
also be an inadequate understanding of the key patho-
physiological mechanisms operating in COVID19 pa-
tients. Several other clinical trials of immunomodula-
tory drugs have been initiated, thus corroborating the
concept that immunosuppression has a central role.
The immune response to SARS-CoV-2 is
the main cause of pulmonary pathology and associ-
ated morbidities that lead to death in a proportion
of infected individuals, but this response is highly
variable (Liu et al., 2020). There is limited knowl-
edge of the kinetics, intensity, and diversity of cellu-
lar and humoral immune responses after SARS-CoV-
2 infection (Zhang et al., 2020a; Siracusano et al.,
2020). The innate immune response in patients af-
fected by a SARS-CoV-2 infection is characteristic
of disease outcomes (Merad and Martin, 2020). We
aim to model host immune signatures that can distin-
guish clinical outcomes in patients with COVID-19.
How the immune system reacts in these early stages
of coronavirus infection (COVID19, SARS-CoV-2)
when patients have not developed severe symptoms
has not been well studied (Siracusano et al., 2020).
In Section 2 we present a System Dynamics Model
approach for simulating the patient reaction to viral
infection. In particular, since the exceptionally high
virulence of COVID-19 and the patients’ precondi-
tion seem to constitute primary factors we focus on
using two key control parameters (i) virulence, which
can be “moderate” or “high” and (ii) patient precondi-
tion, which can be “healthy”, “not so healthy” or “se-
rious preconditions”. We aim to reflect in the model
the effects of pro-inflammatory cytokines produced
and how macrophage polarisation evolves during the
course of an infection. In particular, we focus on sim-
ulating the behaviour of Inflammatory (M1) Alveolar
Macrophages, IL6 and Active Adaptive Immune sys-
tem as indicators of the immune system response, to-
gether with the COVID viral load over time. Section 3
presents results of simulations and confirms that it is
possible to build an initial model of the system to ex-
plore the behaviour of the key attributes involved in
the patient condition, virulence and response. Sec-
tion 4 concludes the paper with a discussion of some
specific aspects of the model and the results, also in
the context of related work.
2 MODEL DEFINITION AND
SIMULATION
We introduce a System Dynamics Model for viral in-
fection of the lungs calibrated with data from clini-
cal studies (Yang et al., 2020; Hotchkiss et al., 2013).
The modelling process, simulations, and optimisation
analyses were performed using Vensim
R
PLE soft-
ware, version 8, academic license (Ventana Systems,
Harvard, MA, USA). The model consists of inter-
connected “stocks” and “flows” to represent the im-
mune system behaviour in response to a COVID in-
fection. There has been a strong interest in epidemio-
logical models for COVID-19 that study the propaga-
tion of the virus and the potential impact of measures,
such as social distancing, to assist decision-making
for managing transmission, delivery of testing and
other resource management challenges (Currie et al.,
2020). In particular, a freely distributed epidemiolog-
ical model (vensim.com/coronavirus/) has attracted
significant social-media attention. We take a rather
orthogonal approach and apply dynamic system mod-
elling to the reaction of the Immune System to viru-
SIMULTECH 2021 - 11th International Conference on Simulation and Modeling Methodologies, Technologies and Applications
142

lent viruses such as COVID.
One of the fundamental contributions of defining
this model is that it documents the interactions and
potential cause-effect relationships between the many
substances, proteins, and elements of tissue and of the
immune system. A model of this type also highlights
the potential gaps to increase research efforts as well
as the points where a cause-effect relationship can be
altered in search for vaccines or cures.
For instance, there is some understanding about
how a coronavirus uses its S protein to enter into host
cells (mainly latching to ACE-2). There is also some
understanding of the replication processes that hap-
pen afterwards (which involves viral particles germi-
nating into the endoplasmic reticulum-Golgi interme-
diate compartment). Some aspects are also known
about how some new copies of the virus are re-
leased without immediate destruction of the host cell.
Similarly, some microbiology understanding exists
for how the infected cell presents antigen to anti-
gen presentation cells. We remark that the details
for COVID-19 are less known (Li et al., 2020) and
those details now suggest differences between SARS-
CoV and MERS-CoV. Therefore, we will not sim-
ulate the details of antigen presentation here. We
focus on the transitions and activity illustrated in
Figure 1. Figure 2 contains the complete model
with the main control input on the bottom left (vir-
ulence and patient precondition) and 9 main stock-
flows groups which have been designated as A to I.
(see Table 1 for descriptions). A key stock generated
in the model is “viral load” (C) and other key out-
puts are the immune system response (F), lung tis-
sue destruction (coming from A) and macrophages
(coming from E). The rectangles signify a “stock”
(store of something), the circles represent a “rate”,
the hexagons are inputs, arrows are flows, variables
(named source nodes) and the small clouds represent
external source/destination. Table 2 provides a sum-
mary of the event sequence that the stock-flow model
captures.
2.1 Alveolar Macrophages (M1 and M2)
and Viruses: Three Central Stocks
The main player of the immune response in COVID-
19 are the alveolar macrophages (AM) (Merad and
Martin, 2020). These cells detect and respond to
danger signals resulting from pathogen colonization,
growth, and tissue damage. Upon recognition, AM
cells trigger an inflammatory response (M1). How-
ever, this reaction must be tightly regulated, as un-
controlled inflammation leads to clinical complica-
tions (
´
Alvarez et al., 2017). One of the most impor-
tant mechanisms to protect a host from excessive in-
flammation is a type of tolerance known as a refrac-
tory state or M2 (Rackov et al., 2016). This protective
mechanism could also become a serious clinical prob-
lem, since an inadequate innate response significantly
increases the risk of infections spreading. This cru-
cial process, should never be confused with “immune
paralysis”. The M2 state or refractory state, is char-
acterized by the ability of reduction of the inflamma-
tory response (low levels of IL-6) and the increment
of their phagocytosis capacity (Cubillos-Zapata et al.,
2014). Although macrophage polarisation in humans
is arguably a continuum (Atri et al., 2018), we cre-
ate three stocks whose units are “macrophages”.The
interactions of these stocks and their flows is repre-
sented by Group E in Figure 2 and Table 1.
2.2 Lung Tissue Fights Virus Infection
We further our model by incorporating the signals be-
tween tissue cells. Interferon (IFN) is a generic name
for signalling proteins produced and released by in-
fected host cells in response to the presence of several
viruses. The virus-infected cells produce interferon
causing neighbour cells to intensify micro-biological
anti-viral defences.
Thus, our model considers this neighbour defence
system (refer to Group A in Figure 2 and Table 1).
It represents that IFN released by infected lung tis-
sue results in a reduction in the rate by which viruses
transform healthy lung cells to infected cells. We do
not intend to be too detailed in the impact of the virus
with respect to different types of interferon. Suffice to
say that there is some consensus that the IFN response
is high in mild-to-moderate patients, but is reduced in
the severe cases (Hadjadj et al., 2020).
To elaborate the model, we progress to represent
the cytopathic effects and the viral evasion capabil-
ity that appears in viral infections from human coro-
naviruses (SARS-Cov, MERS-CoV and COVID-19).
It is clear that viral evasion contributes to the severity
of the disease, but all the processes that lead to a dys-
regulated immune response and sustained inflamma-
tion are not completely understood (Channappanavar
and Perlman, 2017). While there are several common-
alities between the viruses’ mechanisms for evasion
in COVID-19, SARS-CoV and MERS-CoV (Li et al.,
2020), there are also some differences and several de-
tails unknown (Pedersen and Ho, 2020). Therefore,
we consider that our model incorporates all these as-
pects by the viruses impacting on the IFN-immune re-
sponse modelled earlier. That is, we represent the in-
terference the virus performs affecting interferon sig-
nals to neighbour tissue cells. Thus, higher virulence
A System Dynamics Model Approach for Simulating Hyper-inflammation in Different COVID-19 Patient Scenarios
143
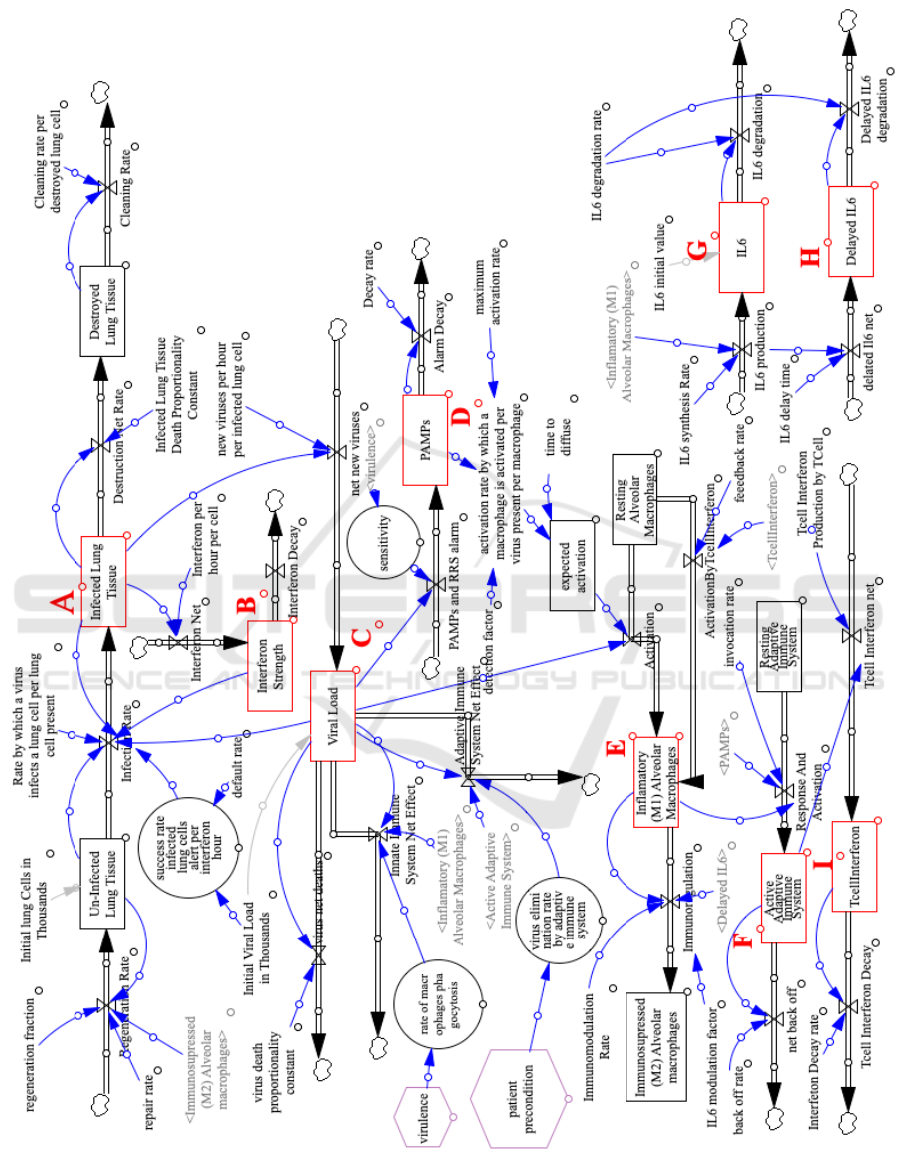
Figure 2: System Dynamics Model for the Immune system response to COVID. The rectangles signify a “stock” (quantity
existing at a point in time), the circles represent a “rate”, the magenta hexagons are inputs, arrows are flows and the small
clouds represent external source/destination.
SIMULTECH 2021 - 11th International Conference on Simulation and Modeling Methodologies, Technologies and Applications
144

Table 1: Stock-flow groups as defined in Fig 2.
Stock-flow groups & Description Links in-out to other stock-flow group
A : Lung tissue (uninfected →infected → destroyed)
Outgoing link to Flow C, incoming links from {Flow C,Flow E}
B : Interferon strength
Outgoing link to Flow A, incoming link from Flow A.
C : Viral load
Outgoing links to {Flow A, Flow D, Flow E}, incoming link from Flow A
D : PAMPS
Outgoing link to Flow E, incoming link from Flow C
E : Alveolar macrophages (resting → inflammatory(M1) → immunosuppressed(M2))
Outgoing links to {Flow F, Flow G}, incoming links from {Flow C, Flow D}
F : Adaptive immune system resting → active Incoming link from Flow E, outgoing link to Flow I
G : IL6 (production → degradation) Outgoing links to Flow H, incoming link from Flow G
H : Delayed IL6 Incoming links from Flow G
I : T-cell Interferon
Incoming links from Flow F
means less effective interferon signals.
The focus of model is to represent the link be-
tween amplified inflammatory response and higher
virus replication (Channappanavar and Perlman,
2017). Therefore, our model represents (refer to
Group C and Group D in Figure 2 and Table 1) the be-
lief that higher viral titters result in an increased viral
Pathogen-Associated Molecular Patterns (PAMPs)
that further dampen IFN signalling and stimulate Pat-
tern Recognition Receptors (PRRs).
2.3 Macrophage Activation
Macrophages detect viruses in many ways. One of
the nasty aspects of coronaviruses such as COVID-
19, SARS-CoV and MERS-CoV, is that they impact
the role of Pattern Recognition Receptors (PRRs)in
the innate immune system response (Li et al., 2020).
For simplicity, we model that PRRs are proteins ex-
pressed by macrophages (although also expressed by
dendritic cells, monocytes, neutrophils and epithelial
cells). They identify two types of molecules.
1. Pathogen-Associated Molecular Patterns
(PAMPs): foreign molecules coming from
microbial pathogens.
2. Damage-Associated Molecular Patterns
(DAMPs): molecules coming from damaged
or dead cells in the host.
As we mentioned, although macrophages exhibit a
range of phenotypes, they can be predominantly sep-
arated into two types (Stout and Suttles, 2004).
• M1 macrophages appear in the early stages of in-
flammation and are activated by four key media-
tors: interferon-γ (IFN-γ), tumour necrosis factor
(TNF), and damage associated molecular patterns
(DAMPs). From these mediator molecules, alve-
olar macrophages create a pro-inflammatory re-
sponse that in return produces pro-inflammatory
cytokines like Interleukin-6 (IL-6
1
).
1
Interleukin: cytokines made by one leukocyte and acting
• M2 macrophages produce an anti-inflammatory
response via the release of Interleukin-4 or
Interleukin-13. They participate in tissue healing.
These two types of macrophages can be con-
verted into each other (Liu et al., 2014). Inter-
feron (IFN)-γ activates resting macrophages as M1
macrophages. When fighting severe viral infections,
more macrophages are recruited by the secretion of
further inflammatory mediators (Liu et al., 2014).
Our model represents the migration between these
two types. The model represents the late awakening
of macrophages because of the virus capacity to block
the signals that allow its early detection. It has been
reported that coronaviruses are capable of circum-
venting detection by developing double-membrane
vesicles without PRRs and then replicate in these
vesicles (Li et al., 2020). Alveolar macrophages
are the crucial defence against viruses. Although
macrophages defend against viruses in many ways
(secretion of oxygen metabolites, lysozyme, antimi-
crobial peptides and proteases), our model will focus
on phagocytosis and intracellular killing.
Thus, our model enables to represent the virulence
of the virus by regulating the sensitivity; i.e. the ca-
pacity of its rapid detection. With early detection,
(high sensitivity, low virulence), M1 macrophages
grow quickly in numbers and extinguish the virus
rapidly. The alternative scenario is when the virus can
pass under the radar for a while, resulting in a slow re-
sponse of low numbers of macrophages.
2.4 Macrophages Production of IL-6
We calibrate our model so it matches the observation
that COVID-19 patients suffer from excess inflamma-
tion at 9-10 days (Zhou et al., 2020). Cytokines and
chemokines have long been understood to have an im-
portant role in immunity and immunopathology, but
exuberant and deregulated immune responses have
on other leukocytes
A System Dynamics Model Approach for Simulating Hyper-inflammation in Different COVID-19 Patient Scenarios
145

Table 2: Event sequence for the model of Figure 2.
Steps in the process represented by the model
Main stock-flow
groups (Table 1)
associated with
chronological steps
Virus present. The virus displays many PAMPS which activate Macrophages M0 to M1.
Model notes: Virus infects a lung cell (lung tissue), interferon is released which alerts neighbouring lung cells. Very low
loads and non aggressive/simple viruses do not progress from this. COVID-19 can pass this stage.
Flow A, Flow C,
Flow D and
Flow E
M1 produces inflammatory cytokines like IL-6.
Model notes: Virus passes the interferon alarm of lung cells to their neighbours, and grows by infecting other neighbouring
cells. Viruses may kill or generate copies before killing. Most human cells when infected by viruses generate alarm signals.
COVID-19 can reduce the detectability of these signals released by infected cells.
Flow C, Flow B,
Flow E and
Flow G
M1 starts presenting the virus PAMPS and other antigens to T-cells (CD4 and CD8, and
then T cells start producing Interferon).
Model notes: Macrophages of lung tissue [eventually] detect the virus (generically by PAMPs and PPRS), become active
[turn into predominantly M1] and fight it.
1. For many viruses and small loads the macrophages can kill all and destroy the infection.
2. They themselves raise alarm signals to activate other Macrophages to turn M1 and to produce inflammation (release IL-6
and TNS which are pro-inflammatory cytokines )
3. This also creates exponential growth in the activation of macrophages of type M1, which if all goes well, can destroy
the virus, and once virus load is down, M1’s turn into M2s, IL-6 comes down and the tissue regenerates because M2’s
repair). Sustained inflammation and long time periods of IL-6 is destructive of other organs, sepsis, storm, etc
4. Some of the macrophages are recruited by the release of IL-6 and its propagation in the body from other regions beyond
the infected tissue (the lung)
5. Possibility that COVID-19 can have a stale-mate with a macrophage by infecting it into an abortive infection (the virus
also does not get to reproduce).
Flow E, Flow D
and Flow B
Sub-steps
(see Model Notes):
1 involves Flow C,
Flow E, Flow A
2 involves Flow E,
Flow G, Flow A
3 involves Flow E,
Flow H
4 involves Flow E
Interferon produces M1 and activated CD8 T cells and NK cells to destroy the virus.
Model notes: Several types of lymphocytes are produced rapidly and of all kinds in young people (slowly and with biases for
some types of T-cells). For elderly people, people with diabetes, people with already issues with their immune system [i.e.
lupus] the reinforcements of the adaptive immune system come slow, and/or with biases for some types of T-cells. .
Flow E
M1 becomes M2.
Model notes: Modelled via the immunosuppression rate. Typically, this is regulated via intracellular and genetic regulation
inside M1 macrophage.
Flow E
M2 stops producing inflammation (IL-6) and stops presenting
Model notes: This also implies that M2 stops presenting and blocks the T-cell response - because of this cause damage to the
lung. It also increases their phagocytic capacity to eliminate the virus.
Flow E, Flow H
been shown to potentially cause lung damage and de-
creased survival (Pedersen and Ho, 2020). We also
model the observation that, in SARS-CoV-2 infected
individuals, cytokines like IL-6 increase during dis-
ease and decreases during recovery. These cytokines
are especially higher in patients requiring ICU ad-
mission which also exhibit significantly higher levels
of fever (Yang et al., 2020). This inflammatory cy-
tokine levels were slightly elevated or within the nor-
mal range in moderate cases, but remarkably elevated
in most severe cases. These cytokines are likely pro-
duced by highly inflammatory macrophages that have
been implicated in the cytokine storm. The discovery
that several potent cytokines, including IL-6 are in in-
creased concentrations in COVID-19 patients, led to
the concept of blocking them as a treatment to reduce
a cytokine storm (Yao et al., 2020).
However, the behaviour of IL-6 in our model is a
consequence of the macrophages production. There-
fore, the next elaboration of our model is the response
by the innate immune system (refer to Group G and
Group H in Figure 2 and Table 1). In light of
the larger numbers of viruses, M1 macrophages pro-
duce cytokines (including Interleukin-1, IL-6, and
tumour necrosis factor-α), chemokines (including
Interleukin-8), and arachidonic metabolites. How-
ever, among many roles, we focus on IL-6’s effect to
induce inflammation (Tanaka et al., 2014). Moreover,
IL-6’s elevated values are consistent in COVID-19 pa-
tients, especially those with severe outcomes (Zhou
et al., 2020; Chen et al., 2020b). IL-6 is believed to be
central to COVID-19 infections resulting in dysfunc-
tional immune response sometimes considered sim-
ilar to sepsis (Hotchkiss et al., 2013) or a so-called
cytokine storm (Chen et al., 2020a). In our model,
we focus on IL-6 production. Again, we are aware
that many other phenomena happen concurrently, in
order for the binding of PAMPs to Toll-Like Recep-
tors (TLRs, which are a type of pattern-recognition
receptors) to eventually result in the activation and
detachment of alveolar macrophages from the alve-
olar epithelial cells, followed with the phagocytosis
of viruses and secretion of Inflammatory cytokines
(IL-6). However, for now such detail is not modelled.
What is modelled is a predator-prey approach where
activated (M1) macrophages hunt viruses.
Our model aims to simulate autocrine feedback
loops that amplify inflammation (Choy and Rose-
John, 2017). Again, there other innate immune cells
(such as neutrophils and monocytes) that produce and
respond to IL-6 besides macrophages. but we fo-
cus on macrophages since studies have found that for
SIMULTECH 2021 - 11th International Conference on Simulation and Modeling Methodologies, Technologies and Applications
146
COVID-19, there is a high incidence of macrophage
infiltration (Channappanavar and Perlman, 2017).
2.5 The Adaptive Immune System
In our modeling of the adaptive immune system,
we consider background information relating the key
stocks. For example, the observation that COVID-
19 causes macrophages to become M1 type and pro-
duce the pro-inflammatory cytokine IL6 (Pedersen
and Ho, 2020). In its turn, Il-6 promotes lympho-
cyte necrosis (Chen et al., 2020b). The serum con-
centration of IL-6 is negative to blood CD4 and
CD8 T cells (Chen et al., 2020b). COVID-19 infec-
tion can cause T-cell exhaustion, and more notice-
able with patients requiring ICU care (Diao et al.,
2020). In terms of the effect of patient precondi-
tions on the adaptive immune system, smoking and
advanced patient age are key factors (Zhou et al.,
2020; Diao et al., 2020; Feller et al., 2018). T-
cell and B-cell function presents age-dependent de-
fects that can result in an over-production of type 2
cytokines, which in turn results in deficient control
of viral infection and prolonged proinflammatory re-
sponses (Zhou et al., 2020). Smoking has been iden-
tified as a factor that promotes macrophage activation
and the macrophage polarisation for M1 macrophages
over M2 macrophages (Feller et al., 2018). Elderly
patients exhibit lower T-cell numbers, with suggests
that TNF-α could be inducing T-cell depletion (Diao
et al., 2020). For our modelling purposes, we intro-
duce the condition of the patient as an element that
distorts the engagement of the adaptive immune sys-
tem (refer to Group F in Figure 2 and Table 1).
3 RESULTS
Our model offers two key control parameters, virus
virulence and patient preconditions. The virus vir-
ulence (denoted v) is set to 1 or 2, where 1 repre-
sents a virus which is not so virulent, generating many
PAMPs, and not so adept at stealth; 2 indicates a high
virulence with low sensitivity.
The patient pre-condition (denoted p) can be 0, 1
or 2: 0 indicates a very healthy patient whose adaptive
immune system supports the innate immune system
with quick response; 1 indicates a not so healthy pa-
tient where the adaptive immune system is somewhat
slower; 2 indicates a patient with very serious pre-
conditions compromising the response of the adaptive
immune system.
The six possible combinations of virus virulence
and patient pre-conditions described in the design of
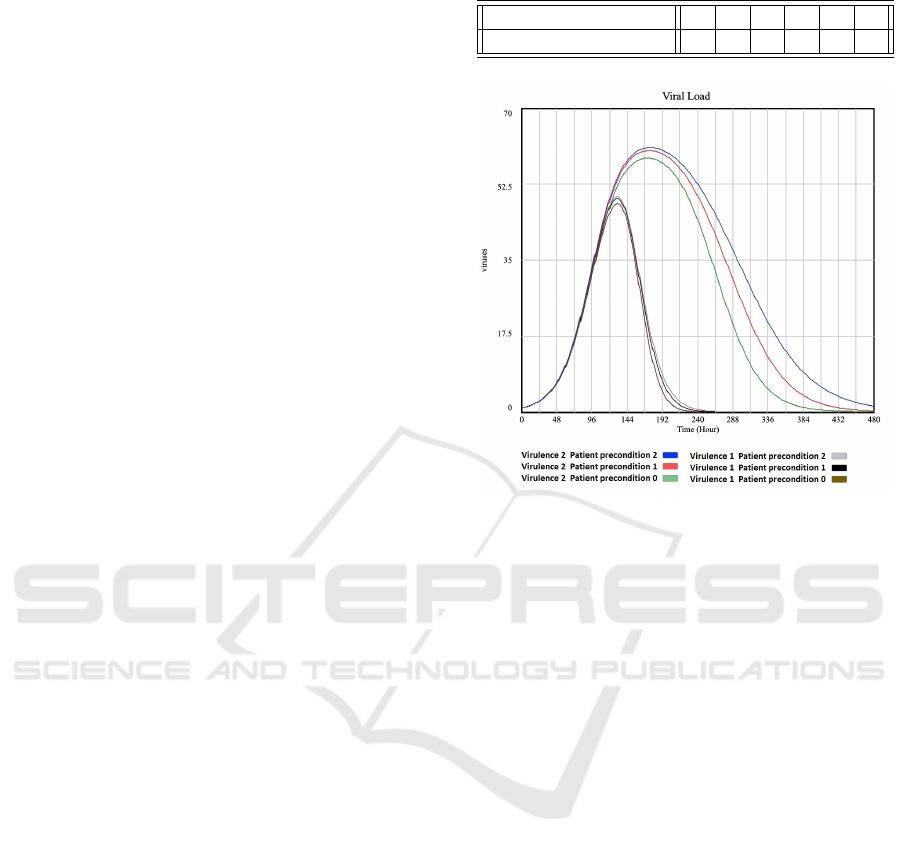
Table 3: Six experiments conducted with our model.
Virus virulence 1 1 1 2 2 2
Patient preconditions 0 1 2 0 1 2
Figure 3: Plot of ’Viral Load’ for different virulence and
patient preconditions.
experiment are given in Table 3.
3.1 Results of Simulation
Figure 3 to Figure 5 show the plots for selected key
stocks and rates for the model shown in Figure 2 and
the experiments listed in Table 3. It can be seen that
a healthy patient (patient precondition 0) is able to
overcome a moderate and a high virus virulence. The
macrophages, IL6 and adaptive immune system re-
turn to normal once the virus is overcome. However
for the patient with serious precondition (patient pre-
condition 2) the macrophages, IL6 and adaptive im-
mune system stay high even when the virus virulence
goes down. Also note that the less healthy the pa-
tient, the higher the values for macrophage, IL6 and
immune system.
With reference to Figure 5 (a) (AAIS vs Viral
Load) the log scale on the y-axis reveals an “attractor
type” curve which can be an emergent feature of dy-
namical systems (Dudkowski et al., 2016). It can be
seen that the viral load curves backwards for higher
levels of AAIS (Active Adaptive Immune System).
Note that this tendency is effectively following the
sequence over time. In the case of Viral Load this
makes sense - as the AAIS becomes more progres-
sively activated, there is an inflection point around
x-axis value 48 for the v = 1 group and around the
value 60 for the v = 2 group.
A System Dynamics Model Approach for Simulating Hyper-inflammation in Different COVID-19 Patient Scenarios
147
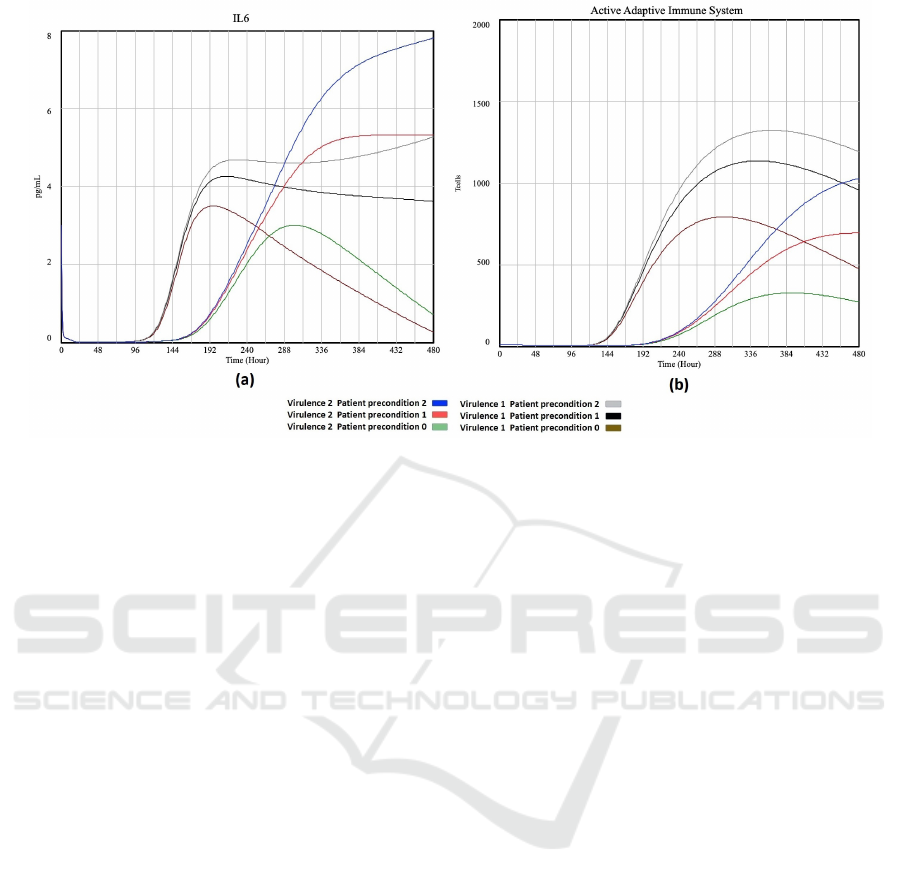
Figure 4: Plot of ’IL6’ (a) and ’Active Adaptive Immune System’ (b) vs time for different virulence and patient preconditions.
In the case of Figure 5 (b) (AAIS vs M1), some-
thing similar happens for the healthiest patients (p =
0) as the immune system activates. For the highest
virulence (v = 2) and worst patient condition (p = 2),
M1 continues rising together with AAIS. Now con-
sider the top right quadrant M1 > 45 and AAIS > 700
as a “dangerous region” (the thresholds represent an
initial approximation which would be calibrated as fu-
ture work). The intermediate virulence values and pa-
tient states are located to the left of this region with
clear point (v = 1, p = 1) for a positive infection
outcome (going out of the “dangerous region”). But
v = 1, p = 2 (worst patient type) is heading into the
dangerous region, whereas v = 2, p = 1 is relatively
static but also close to the dangerous region together
with the two highest risk patient types.
3.2 Interpretation, Confirmation and
Limitations
We interpret the displayed phenotype to have the fol-
lowing vivo relevance: a poor inflammatory capacity
situation (High Virulence (id = 2) and Healthy Patient
precondition (id=0) represented by the green lines in
Figures 3 to 5) has impaired antigen presentation and
would possibly either inhibit or alter the development
of an adaptive response (AAIS). Moreover, an inter-
mediate controlled level of M1 macrophages (black,
grey and red lines, Figure 5(b)) reduce their inflam-
matory cytokines like IL-6. Such condition would
contribute to protection against septic shock, and in-
creased phagocytosis that would allow efficient vi-
ral clearance. In support of this, M2 macrophages
have been related to decreased antigen presentation
and impaired T-cell proliferation as well as reduced
production of IFN. These observations underline the
importance of the interaction between the antigen-
presenting cells like M1 macrophages and the T-cells
during infections. Finally, the higher inflammatory
situation (blue lines in Figures 3 to 5) increases M1
and T-cell with more lag, and a lesser increasing
slope; therefore they are much less efficient in elimi-
nating the viral load.
Table 4 shows the correlations between all the
stocks from the model of Figure 2. Correlations
over 0.7 are highlighted, and high values can be
seen between M1, IL6 and the Active adaptive im-
mune system. Also, high values can be seen be-
tween M2 and Infected/destroyed lung tissue and In-
terferon strength. Apart from Time, Resting Alveolar
has the most correlations greater than 0.7 with other
stocks. The complete dataset was used to calculate
the correlations and generate a PART rule-model ap-
pearing in Table 6. This rule model is set to predict
IL6, was trained on a random sample of 50% of the
data and tested on the remaining 50%. PART is a
highly effective rule-induction algorithm (Frank and
Witten, 1998) and the Weka (Hall et al., 2009) imple-
mentation of a variation on Quinlan’s C4.5 (Quinlan,
1993). This approach to build decision trees (or deci-
sion lists (Frank and Witten, 1998)) which uses Shan-
non’s information theory to calculate an information
gain to rank the best attribute candidates to include
in the rules. The composition of the antecedents and
consequents of the rules for predicting IL6 can give
us useful information about what are the most rele-
SIMULTECH 2021 - 11th International Conference on Simulation and Modeling Methodologies, Technologies and Applications
148
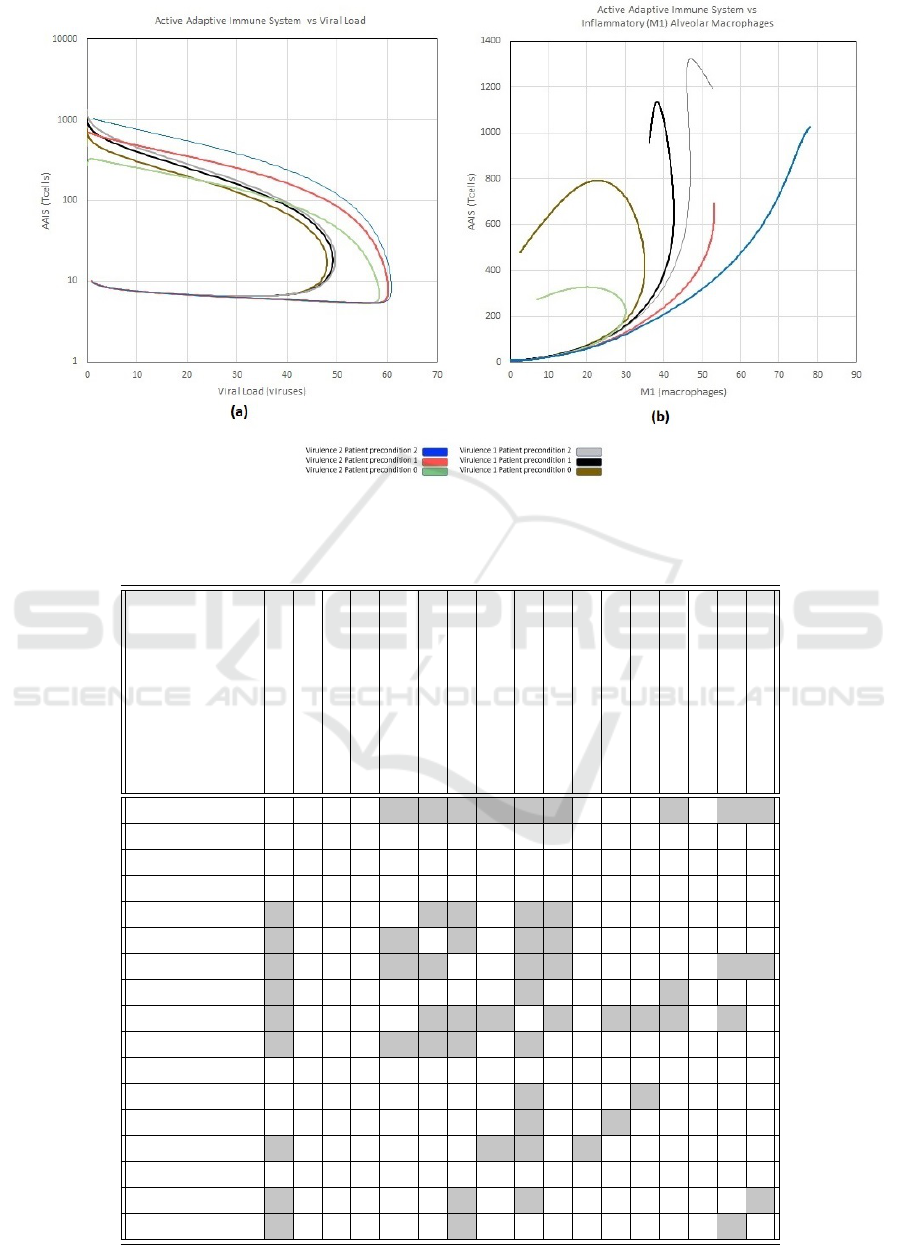
Figure 5: Plot of ’Active Adaptive Immune System’ vs ’Viral Load’ (a) and ’Inflammatory M1 Alveolar Macrophages” (b)
for different virulence and patient preconditions.
Table 4: Correlations between model stocks.
Time (hours)
Virulence
Patient precondition
Viral load
Inflammatory (M1) Alveolar
Macrophages
IL6
Active Adaptive Immune System
Immunosuppressed (M2) Alveolar
macrophages
Resting Alveolar Macrophages
Delayed IL6
Un-Infected Lung Tissue
Infected Lung Tissue
Destroyed Lung Tissue
Interferon Strength
PAMPs
Resting Adaptive Immune System
T-cell Interferon
Time (hours) 1 0 0 -0.37 0.71 0.71 0.74 0.95 -0.92 0.72 -0.65 -0.62 -0.6 0.8 0.25 -0.77 0.76
virulence 0 1 0 0.39 -0.03 -0.03 -0.41 -0.05 0.04 -0.03 -0.13 0.04 0.04 0.08 -0.46 0.42 -0.41
Patient precondition 0 0 1 0.07 0.36 0.36 0.23 -0.14 -0.13 0.34 -0.03 0.01 0.01 0.01 0.06 -0.19 0.16
Viral load -0.37 0.39 0.07 1 -0.37 -0.38 -0.62 -0.41 0.43 -0.42 -0.26 0.41 0.47 0.1 -0.04 0.6 -0.58
Inflammatory (M1) Alveo-
lar Macrophages
0.71 -0.03 0.36 -0.37 1 1 0.75 0.62 -0.9 1 -0.6 -0.6 -0.58 0.66 0.5 -0.64 0.57
IL6 0.71 -0.03 0.36 -0.38 1 1 0.76 0.62 -0.9 1 -0.59 -0.6 -0.59 0.65 0.49 -0.65 0.58
Active Adaptive Immune
System
0.74 -0.41 0.23 -0.62 0.75 0.76 1 0.65 -0.78 0.78 -0.38 -0.56 -0.56 0.52 0.4 -0.96 0.93
Immunosuppressed (M2)
Alveolar macrophages
0.95 -0.05 -0.14 -0.41 0.62 0.62 0.65 1 -0.9 0.63 -0.64 -0.69 -0.68 0.78 0.34 -0.67 0.65
Resting Alveolar
Macrophages
-0.92 0.04 -0.13 0.43 -0.9 -0.9 -0.78 -0.9 1 -0.91 0.69 0.72 0.7 -0.8 -0.47 0.73 -0.68
Delayed IL6 0.72 -0.03 0.34 -0.42 1 1 0.78 0.63 -0.91 1 -0.58 -0.6 -0.59 0.65 0.47 -0.67 0.6
Un-Infected Lung Tissue
-0.65 -0.13 -0.03 -0.26 -0.6 -0.59 -0.38 -0.64 0.69 -0.58 1 0.44 0.37 -0.97 -0.64 0.3 -0.25
Infected Lung Tissue
-0.62 0.04 0.01 0.41 -0.6 -0.6 -0.56 -0.69 0.72 -0.6 0.44 1 0.99 -0.52 -0.35 0.52 -0.48
Destroyed Lung Tissue
-0.6 0.04 0.01 0.47 -0.58 -0.59 -0.56 -0.68 0.7 -0.59 0.37 0.99 1 -0.46 -0.3 0.52 -0.48
Interferon Strength
0.8 0.08 0.01 0.1 0.66 0.65 0.52 0.78 -0.8 0.65 -0.97 -0.52 -0.46 1 0.58 -0.47 0.43
PAMPs
0.25 -0.46 0.06 -0.04 0.5 0.49 0.4 0.34 -0.47 0.47 -0.64 -0.35 -0.3 0.58 1 -0.25 0.17
Resting Adaptive Immune
System
-0.77 0.42 -0.19 0.6 -0.64 -0.65 -0.96 -0.67 0.73 -0.67 0.3 0.52 0.52 -0.47 -0.25 1 -0.99
T-cell Interferon
0.76 -0.41 0.16 -0.58 0.57 0.58 0.93 0.65 -0.68 0.6 -0.25 -0.48 -0.48 0.43 0.17 -0.99 1
A System Dynamics Model Approach for Simulating Hyper-inflammation in Different COVID-19 Patient Scenarios
149

Table 5: Two sample rules for predicting IL6.
Rule 1 IF Inflammatory (M1) Alveolar Macrophages > 16.289
THEN IL6 =
0.1 × Inflammatory (M1) Alveolar Macrophages
+ 0.0021 × Immunosupressed (M2) Alveolar macrophages
- 0.1056 [763/0.931%]
Rule 2 IF Inflammatory (M1) Alveolar Macrophages ≤ 1.381
THEN IL6 =
-0.0001 × Viral Load
+ 0.1025 × Inflammatory (M1) Alveolar Macrophages
- 0.0101 × Delayed IL6
- 0.0001 × T-cell Interferon
+ 0.0019 [410/1.095%]
vant attributes to include in the model as proposed by
the rule-induction algorithm.
From the complete model definition it can be
seen that in the antecedent of the first three rules,
“Inflammatory (M1) Alveolar Macrophages” is in-
cluded. Rule 4 also uses Active Adaptive Immune
System as well as M1. Rule 5 uses T-cell Interferon
in the antecedent. In the antecedents, Rule 6 has
“Time (Hour)” and “Active Adaptive Immune Sys-
tem”, Rule 7 has “Viral Load” and Rule 8 has “Time
(Hour)”. On the other hand, the consequents of all
the rules use mainly the following stocks: “Viral
Load”, “Time (Hour)”, “M1”, “Active Adaptive Im-
mune System” and “Delayed IL6”. It can be seen that
Rule 1 and Rule 2 have the most corresponding cases,
with 763 and 410, respectively. Rule 6 to Rule 9
have relatively much fewer cases associated. From
the overall rule model (Appendix-Table 6), it can be
concluded that “M1” and Active “Adaptive Immune
System” are key stocks for predicting IL6.
The scope of the simulation is limited, for exam-
ple, by fixing one of the key control parameters (i.e.
viral load) while varying the other (patient precondi-
tions). In this way we see the behaviour of the im-
mune system through Figure 3, Figure 4 and Figure 5.
On the other hand, the viral load does not vary for
different patient preconditions and in vivo, we would
expect a weaker patient to allow the virus load to be
greater.
4 DISCUSSION
The results show that it is possible to build an ini-
tial model of the system to explore the behaviour
of the key attributes involved in the patient condi-
tion, virulence and response. From the perspec-
tive of dynamic models, our results show that, with
the few elements we have incorporated (relative to
the many other players known to be involved), the
system has many bifurcations and the behaviour is
far from stable. In particular, such bifurcations in-
spire aspects that need further study. From the per-
spective of control theory, significant more informa-
tion is required to exercise control of the inflamma-
tory response by selecting medication depending on
a modelled individualised classification of the poten-
tial outcome for each patient. The immune control
of the excessive inflammatory response is called re-
fractory state (RS); this mechanism is characterized
by a significant reduction in the inflammatory capac-
ity (IL-6) of innate immune cells like macrophages to
a subsequent Pathogen-Associated Molecular Pattern
(PAMP) challenge (L
´
opez-Collazo and del Fresno,
2013; Agrawal et al., 2015). However, this state
is not restricted to bacterial sepsis but has been ob-
served for a number of pathologies such as acute
pulmonary syndrome, cystic fibrosis, and even can-
cer (L
´
opez-Collazo et al., 2010). While refractory
state (RS) has been thought of as a protective mech-
anism against septic shock and ischemia, its immune
regulation was associated with non-controlled hyper-
inflammatory status in COVID-19. Similarly, in acute
pulmonary syndromes and cystic fibrosis, RS relates
to an increased susceptibility to nosocomial infec-
tions (Biswas and Lopez-Collazo, 2009). Several
studies have also shown some common mechanistic
paradigms in RS across different diseases (L
´
opez-
Collazo and del Fresno, 2013). In addition to this, RS
in cystic fibrosis shows impaired antigen presentation,
however it also displays a potent phagocytic activ-
ity. In cancer, tumor-associated macrophages (TAMs)
show an immunosuppressive phenotype similar to RS
macrophages. TAMs show decreased production of
inflammatory cytokines like IL-6 but upregulation of
anti-inflammatory cytokines (Cubillos-Zapata et al.,
2014). This was explained by a defective NF-kB ac-
tivation, overexpression of p50 NF-kB homodimers,
and a functional TRIF pathway (Biswas and Lopez-
Collazo, 2009).
Taken together, the SARS-CoV-2-induced cy-
tokine storm is associated with disease severity and
outcome. Understanding immune dysregulation in
patients with COVID-19 not only provides a bet-
ter understanding of the pathogenesis of SARS-CoV-
2, but also identifies targets for immune therapeu-
tics (Merad and Martin, 2020). While antiviral agents
are currently being explored, the use of antiviral
agents alone may not be sufficient to stop the cytokine
storm, lung destruction, and respiratory distress in pa-
tients who presented late after infection. Targeted im-
munomodulation that reduces cytokine storm can im-
prove lung inflammation and hopefully reduce mor-
tality (Avenda
˜
no Ortiz et al., 2017). Other studies of
SIMULTECH 2021 - 11th International Conference on Simulation and Modeling Methodologies, Technologies and Applications
150

the viral factors driving immune dysregulation may
provide insights into the conformation of vaccine re-
sponses to protective immunity (Zhang et al., 2020a).
Advances in immunology and our understanding of
the pathophysiological basis of sepsis provides ex-
citing new therapeutic opportunities (
´
Alvarez et al.,
2017; Hotchkiss et al., 2013; Rackov et al., 2016;
Shalova et al., 2015). We postulate that immunother-
apy will have a wide range of beneficial effects on
COVID19, and could be an important advance in
infectious disease. Recently, interleukin 6 receptor
(IL-6R) monoclonal antibody (tocilizumab)-directed
COVID-19 therapy has been used in a clinical trial in
China (No.ChiCTR2000029765) and the US (Clini-
calTrials.gov Identifier: NCT04322773) Such therapy
has been incorporated into COVID-19 management
guidelines generated in China based on the concept of
“cytokine storm” in COVID-19 pneumonia. Here, we
explore the role of interleukin 6 (IL-6) in COVID-19
patients that could help the physician to recommend
tocilizumab increasing the efficacy of this monoclonal
antibody-directed therapy. Our results highlight the
paramount need for future studies examining subsets
and functions of both innate and adaptive immune
cells at different time points, such as early during the
asymptomatic viremic stage, during respiratory dis-
tress, and after recovery. This may identify mecha-
nisms that lead to immune dysregulation in patients
who have different susceptibilities to the disease, such
as children versus the elderly. We now have a better
understanding of the IL-6 change and cytokine storm
in COVID-19 pneumonia, but more data are needed
on treatment options that improve survival.
REFERENCES
(2020). FDA cautions against use of hydroxychloroquine
or chloroquine for covid-19 outside of the hospital
setting or a clinical trial due to risk of heart rhythm
problems — does not affect FDA-approved uses for
malaria, lupus, and rheumatoid arthritis. FDA Drug
Safety Communication: Safety Announcement [04-
24-2020].
Agrawal, A., Toledano, V., Hern
´
andez-Jim
´
enez, E.,
Cubillos-Zapata, C., Flandez, M.,
´
Alvarez, E., Varela-
Serrano, A., Cantero, R., Valles, G., Garc
´
ıa-Rio,
F., and L
´
opez-Collazo, E. (2015). Galactomannan
downregulates the inflammation responses in human
macrophages via nfkb2/p100. Mediators of Inflam-
mation, 2015:942517.
´
Alvarez, E., Toledano, V., Morilla, F., Hern
´
andez-Jim
´
enez,
E., Cubillos-Zapata, C., Varela-Serrano, A., Casas-
Mart
´
ın, J., Avenda
˜
no Ortiz, J., Aguirre, L. A., Ar-
nalich, F. Maroun-Eid, E., Mart
´
ın-Quir
´
os, A., Quin-
tana D
´
ıaz, M., and L
´
opez-Collazo, E. (2017). A sys-
tem dynamics model to predict the human monocyte
response to endotoxins. Frontiers in Immunology,
8:915.
Atri, C., Guerfali, F. Z., and Laouini, D. (2018). Role of
human macrophage polarization in inflammation dur-
ing infectious diseases. Int. J. of molecular sciences,
19(6):1801.
Avenda
˜
no Ortiz, J., Maroun-Eid, C., Mart
´
ın-Quir
´
os, A.,
Toledano, V., Cubillos-Zapata, C., G
´
omez-Campelo,
P., Varela-Serrano, A., Casas-Martin, J., Llanos-
Gonz
´
alez, E., Alvarez, E., Garc
´
ıa-R
´
ıo, F., Aguirre,
L. A., Hern
´
andez-Jim
´
enez, E., and L
´
opez-Collazo,
E. (2017). PD-L1 Overexpression During Endotoxin
Tolerance Impairs the Adaptive Immune Response in
Septic Patients via HIF1α. J. of Infectious Diseases,
217(3):393–404.
Biswas, S. K. and Lopez-Collazo, E. (2009). Endotoxin tol-
erance: new mechanisms, molecules and clinical sig-
nificance. Trends in Immunology, 30(10):475 – 487.
Chan, J. F.-W., Yuan, S., Kok, K.-H., To, K. K.-W., Chu,
H., Yang, J., Xing, F., Liu, J., Yip, C. C.-Y., Poon, R.
W.-S., Tsoi, H.-W., Lo, S. K.-F., Chan, K.-H., Poon,
V. K.-M., Chan, W.-M., Ip, J. D., Cai, J.-P., Cheng,
V. C.-C., Chen, H., Hui, C. K.-M., and Yuen, K.-Y.
(2020). A familial cluster of pneumonia associated
with the 2019 novel coronavirus indicating person-to-
person transmission: a study of a family cluster. The
Lancet, 395(10223):514–523.
Channappanavar, R. and Perlman, S. (2017). Pathogenic hu-
man coronavirus infections: causes and consequences
of cytokine storm and immunopathology. Seminars in
Immunopathology, 39(5):529–539.
Chen, G., Wu, D., Guo, W., Cao, Y., Huang, D., Wang, H.,
Wang, T., Zhang, X., Chen, H., Yu, H., Zhang, X.,
Zhang, M., Wu, S., Song, J., Chen, T., Han, M., Li,
S., Luo, X., Zhao, J., and Ning, Q. (2020a). Clinical
and immunological features of severe and moderate
coronavirus disease 2019. J. of Clinical Investigation,
130(5):2620–2629.
Chen, Y., Feng, Z., Diao, B., Wang, R., Wang, G., Wang,
C., Tan, Y., Liu, L., Wang, C., Liu, Y., Liu, Y., Yuan,
Z., Ren, L., and Wu, Y. (2020b). The novel severe
acute respiratory syndrome coronavirus 2 (sars-cov-2)
directly decimates human spleens and lymph nodes.
medRxiv.
Choy, E. and Rose-John, S. (2017). Interleukin-6 as a multi-
functional regulator: Inflammation, immune response,
and fibrosis. J. of Scleroderma and Related Disorders,
2(2 suppl):S1–S5.
Choy, E. H., De Benedetti, F., Takeuchi, T., Hashizume, M.,
John, M. R., and Kishimoto, T. (2020). Translating il-
6 biology into effective treatments. Nature Reviews
Rheumatology, 16(6):335–345.
Cubillos-Zapata, C., Hern
´
andez-Jim
´
enez, E., Toledano, V.,
Esteban-Burgos, L., Fern
´
andez-Ru
´
ız, I., G
´
omez-Pi
˜
na,
V., Del Fresno, C., Siliceo, M., Prieto-Chinchi
˜
na, P.,
P
´
erez de Diego, R., Bosc
´
a, L., Fresno, M., Arnalich,
F., and L
´
opez-Collazo, E. (2014). NFkB2/p100 is a
key factor for endotoxin tolerance in human mono-
cytes: a demonstration using primary human mono-
cytes from patients with sepsis. J. of immunology,
193(8):4195–4202.
A System Dynamics Model Approach for Simulating Hyper-inflammation in Different COVID-19 Patient Scenarios
151

Currie, C. S., Fowler, J. W., Kotiadis, K., Monks, T., Onggo,
B. S., Robertson, D. A., and Tako, A. A. (2020). How
simulation modelling can help reduce the impact of
COVID-19. J. of Simulation, 14(2):83–97.
Diao, B., Wang, C., Tan, Y., Chen, X., Liu, Y., Ning, L.,
Chen, L., Li, M., Liu, Y., Wang, G., Yuan, Z., Feng,
Z., Zhang, Y., Wu, Y., and Chen, Y. (2020). Reduc-
tion and functional exhaustion of T cells in patients
with coronavirus disease 2019 (covid-19). Frontiers
in Immunology, 11:827.
Dudkowski, D., Jafari, S., Kapitaniak, T., Kuznetsov, N.,
Leonov, G., and Prasad, A. (2016). Hidden attractors
in dynamical systems. Physics Reports, 637:1–50.
Feller, D., Kun, J., Ruzsics, I., Rapp, J., Sarosi, V.,
Kvell, K., Helyes, Z., and Pongracz, J. E. (2018).
Cigarette smoke-induced pulmonary inflammation be-
comes systemic by circulating extracellular vesicles
containing wnt5a and inflammatory cytokines. Fron-
tiers in immunology, 9:1724–1724.
Frank, E. and Witten, I. H. (1998). Generating accurate rule
sets without global optimization. In Shavlik, J., editor,
Fifteenth Int. Conference on Machine Learning, pages
144–151. Morgan Kaufmann.
Gautret, P., Lagier, J.-C., Parola, P., Hoang, V. T., Med-
deb, L., Mailhe, M., Doudier, B., Courjon, J., Gior-
danengo, V., Vieira, V. E., Dupont, H. T., Honor
´
e, S.,
Colson, P., Chabri
`
ere, E., Scola], B. L., Rolain, J.-M.,
Brouqui, P., and Raoult, D. (2020). Hydroxychloro-
quine and azithromycin as a treatment of covid-19:
results of an open-label non-randomized clinical trial.
Int. J. of Antimicrobial Agents, page 105949.
Hadjadj, J., Yatim, N., Barnabei, L., Corneau, A., Boussier,
J., Pere, H., Charbit, B., Bondet, V., Chenevier-
Gobeaux, C., Breillat, P., Carlier, N., Gauzit, R., Mor-
bieu, C., Pene, F., Marin, N., Roche, N., Szwebel, T.-
A., Smith, N., Merkling, S., Treluyer, J.-M., Veyer, D.,
Mouthon, L., Blanc, C., Tharaux, P.-L., Rozenberg, F.,
Fischer, A., Duffy, D., Rieux-Laucat, F., Kerneis, S.,
and Terrier, B. (2020). Impaired type I interferon ac-
tivity and exacerbated inflammatory responses in se-
vere covid-19 patients. medRxiv.
Hall, M., Frank, E., Holmes, G., Pfahringer, B., Reutemann,
P., and Witten, I. H. (2009). The weka data min-
ing software: An update. SIGKDD Explor. Newsl.,
11(1):10–18.
Hotchkiss, R. S., Monneret, G., and Payen, D. (2013). Im-
munosuppression in sepsis: a novel understanding of
the disorder and a new therapeutic approach. The
Lancet. Infectious diseases, 13(3):260–268.
Lescure, F.-X., Bouadma, L., Nguyen, D., Parisey, M.,
Wicky, P.-H., Behillil, S., Gaymard, A., Bouscambert-
Duchamp, M., Donati, F., Le Hingrat, Q., Enouf, V.,
Houhou-Fidouh, N., Valette, M., Mailles, A., Lucet,
J.-C., Mentre, F., Duval, X., Descamps, D., Malvy,
D., Timsit, J.-F., Lina, B., van-der Werf, S., and Yaz-
danpanah, Y. (2020). Clinical and virological data of
the first cases of covid-19 in europe: a case series. The
Lancet Infectious Diseases, 20(6):697–706.
Li, X., Geng, M., Peng, Y., Meng, L., and Lu, S. (2020).
Molecular immune pathogenesis and diagnosis of
covid-19. J. of Pharmaceutical Analysis, 10(2):102
– 108.
Liu, R., Han, H., Liu, F., Lv, Z., Wu, K., Liu, Y., Feng, Y.,
and Zhu, C. (2020). Positive rate of rt-pcr detection of
sars-cov-2 infection in 4880 cases from one hospital in
wuhan, china, from jan to feb 2020. Clinica Chimica
Acta, 505:172 – 175.
Liu, Y.-C., Zou, X.-B., Chai, Y.-F., and Yao, Y.-M. (2014).
Macrophage polarization in inflammatory diseases.
Int. J. of biological sciences, 10(5):520–529.
L
´
opez-Collazo, E. and del Fresno, C. (2013). Pathophys-
iology of endotoxin tolerance: mechanisms and clin-
ical consequences. Critical care (London, England),
17(6):242–242.
L
´
opez-Collazo, E., G
´
omez-Pi
˜
na, V., and Arnalich, F.
(2010). Understanding immune dysfunctions in sepsis
patients. Critical care (London, England), 14(4):435–
435.
Merad, M. and Martin, J. C. (2020). Pathological inflam-
mation in patients with covid-19: a key role for mono-
cytes and macrophages. Nature Reviews Immunology,
20(6):355–362.
Pedersen, S. F. and Ho, Y.-C. (2020). SARS-CoV-2:
A storm is raging. J. of Clinical Investigation,
130(5):2202–2205.
Quinlan, J. (1993). C4.5: Programs for Machine Learning.
Morgan Kaufmann Publishers, San Mateo, CA.
Rackov, G., Hern
´
andez-Jim
´
enez, E., Shokri, R., Carmona-
Rodr
´
ıguez, L., Ma
˜
nes, S.,
´
Alvarez-Mon, M., L
´
opez-
Collazo, E., Mart
´
ınez-A, C., and Balomenos, D.
(2016). P21 mediates macrophage reprogramming
through regulation of p50-p50 NF-KB and IFN-β. J.
of clinical investigation, 126(8):3089–3103.
Salehi, S., Abedi, A., Balakrishnan, S., and Gholam-
rezanezhad, A. (2020). Coronavirus disease 2019
(covid-19): A systematic review of imaging findings
in 919 patients. American J. of Roentgenology, pages
1–7.
Shalova, I. N., Lim, J. Y., Chittezhath, M., Zinkernagel,
A. S., Beasley, F., Hern
´
andez-Jim
´
enez, E., Toledano,
V., Cubillos-Zapata, C., Rapisarda, A., Chen, J.,
Duan, K., Yang, H., Poidinger, M., Melillo, G., Nizet,
V., Arnalich, F., L
´
opez-Collazo, E., and Biswas,
S. K. (2015). Human monocytes undergo functional
re-programming during sepsis mediated by hypoxia-
inducible factor-1α. Immunity, 42(3):484–
498.
Siracusano, G., Pastori, C., and Lopalco, L. (2020). Hu-
moral immune responses in covid-19 patients: A win-
dow on the state of the art. Frontiers in Immunology,
11:1049.
Stout, R. D. and Suttles, J. (2004). Functional plasticity of
macrophages: reversible adaptation to changing mi-
croenvironments. J. of leukocyte biology, 76(3):509–
513.
Tanaka, T., Narazaki, M., and Kishimoto, T. (2014). Il-6
in inflammation, immunity, and disease. Cold Spring
Harbor perspectives in biology, 6(10):a016295–
a016295.
Yang, X., Yu, Y., Xu, J., Shu, H., Xia, J., Liu, H., Wu, Y.,
Zhang, L., Yu, Z., Fang, M., Yu, T., Wang, Y., Pan,
S., Zou, X., Yuan, S., and Shang, Y. (2020). Clinical
course and outcomes of critically ill patients with sars-
cov-2 pneumonia in Wuhan, China: a single-centered,
SIMULTECH 2021 - 11th International Conference on Simulation and Modeling Methodologies, Technologies and Applications
152

retrospective, observational study. The Lancet Respi-
ratory Medicine, 8(5):475–481.
Yao, T.T. adn Qian, J. D., Zhu, W., Y., W., and Q., W. G.
(2020). A systematic review of Lopinavir therapy for
SARS coronavirus and MERS coronavirus - A possi-
ble reference for coronavirus disease-19 treatment op-
tion. J Med Virol., 92(6):556-563.
Zhang, J. J., Dong, X., Cao, Y. Y., Yuan, Y. D., Yang, Y. B.,
Yan, Y. Q., Akdis, C. A., and Gao, Y. D. (2020a).
Clinical characteristics of 140 patients infected with
SARS-CoV-2 in Wuhan, China. Allergy: European J.
of Allergy and Clinical Immunology. Advance online
publication.
Zhang, Y., Zhong, Y., Pan, L., and Dong, J. (2020b).
Treat 2019 novel coronavirus (COVID-19) with il-6
inhibitor: Are we already that far? Drug Discoveries
& Therapeutics, 14(2):100–102.
Zhou, F. nd Yu, T., Du, R., Fan, G., Liu, Y., Liu, Z., Xi-
ang, J., Wang, Y., Song, B., Gu, X., Guan, L., Wei,
Y., Li, H., Wu, X., Xu, J., Tu, S., Zhang, Y., Chen,
H., and Cao, B. (2020). Clinical course and risk fac-
tors for mortality of adult inpatients with COVID-19
in Wuhan, China: a retrospective cohort study. Lancet,
395:1054–1062.
APPENDIX
The datasets generated and analyzed for this
study can be found in the Github available at:
github.com/vladestivillcastro/SIMULTECH2021.
We also have available tables that provide details
as follows.
Stocks: stock, equation and units.
Flows: flow, equation and units.
Auxiliary Variables: auxiliary variables, equation
and units.
Constants ID, parameters, value, units.
Table 6: Learned rules.
Rule 1 IF Inflamatory (M1) Alveolar Macrophages > 16.289
THEN IL6 =
0.1 × Inflamatory (M1) Alveolar Macrophages
+ 0.0021 × Immunosupressed (M2) Alveolar macrophages
- 0.1056 [763/0.931%]
Rule 2 IF Inflamatory (M1) Alveolar Macrophages ≤ 1.381
THEN IL6 =
-0.0001 × Viral Load
+ 0.1025 × Inflamatory (M1) Alveolar Macrophages
- 0.0101 × Delayed IL6 - 0.0001 × T-cell Interferon
+ 0.0019 [410/1.095%]
Rule 3 IF Inflamatory (M1) Alveolar Macrophages > 10.592
THEN IL6 =
-0.0002 × Time (Hour) - 0.0015 ×Viral Load
+ 0.0833 × Inflamatory (M1) Alveolar Macrophages
- 0 × Active Adaptive Immune System
+ 0.0001 × Resting Alveolar Macrophages
+ 0.1664 × Delayed IL6
- 0.5716 [89/0.318%]
Rule 4 IF Active Adaptive Immune System > 9.922
Inflamatory (M1) Alveolar Macrophages > 6.424
THEN IL6 =
-0.0001 × Time (Hour) - 0.0048 × Viral Load
+ 0.1134 × Inflamatory (M1) Alveolar Macrophages
- 0.0003 × Active Adaptive Immune System
- 0.0008 × Immunosupressed (M2) Alveolar macrophages
+ 0.0011 × Resting Alveolar Macrophages
- 0.1284 × Delayed IL6 + 0.0015 × TcellInterferon
- 5.0631 [69/0.096%]
Rule 5 IF TcellInterferon > 0.517
THEN IL6 =
-0.0003 × Time (Hour) - 0.0019 × Viral Load
+ 0.0992 × Inflamatory (M1) Alveolar Macrophages
+ 0.0001 × Active Adaptive Immune System
+ 0.1282 [79/2.143%]
Rule 6 IF Time (Hour) > 1.5 and Active Adaptive Immune System ≤ 7.841
THEN IL6 =
-0.0003 × Time (Hour) - 0.0103 × Viral Load + 0.7211 [11/1.317%]
Rule 7 IF Viral Load ≤ 0.999
THEN IL6 =
+ 0.9887 [4/0%]
Rule 8 IF Time (Hour) > 1
THEN IL6 =
+ 0.9597 [4/4.369%]
Rule 9 IF
THEN IL6 =
+ 3 [2]
A System Dynamics Model Approach for Simulating Hyper-inflammation in Different COVID-19 Patient Scenarios
153
