
User Identification from Time Series of Fitness Data
Thomas Marchioro
1,2 a
, Andrei Kazlouski
1,2
and Evangelos Markatos
1,2
1
Computer Science Department, University of Crete, Greece
2
Institute of Computer Science, Foundation for Research and Technology Hellas, Greece
Keywords:
Privacy, Wearable Devices, Machine Learning, Health Data.
Abstract:
We explore the threat posed by disclosure of personal fitness information collected by wearable devices. In
particular, we study a scenario where an attacker has a list of aggregated records produced by a group of users,
which are stored as time series of steps and calories. We introduce a machine learning-based approach to
identify one target person in the aggregated data while being in possession of other records from that person.
We estimate how accurately an attacker can find the target’s data when aggregated with other users by testing
our approach on two public datasets. Our results show that personal fitness data possess identifying capabilities
that should be accounted when they are shared or disclosed.
1 INTRODUCTION
In recent years, smart fitness trackers have seen a sub-
stantial increase in sales, along with the emergence of
the Internet of Things and the diffusion of wearable
sensors. Although such devices may encourage peo-
ple to pursue a healthier lifestyle, privacy concerns
were raised in regards to the information that is col-
lected. Most commercial smart watches and smart-
bands gather a wide variety of personal data from in-
built sensors: number of steps, calories consumption,
heart rate, and often even sleep duration. All these
data are related to the fitness traits and habits of the
user, and are known as personal fitness information
(PFI). One of the main concerns regarding the disclo-
sure of these data is related to the possibility of build-
ing a so-called “quantified self” that emerges from
continuous collection of PFI by sensors constantly
monitoring the user. Moreover, the entities that might
gain access to users’ PFI are not limited to the man-
ufacturer of the smartband: several fitness apps allow
to share PFI data with contacts or to post them on so-
cial networks, and users are inclined to do so, as this
provides additional motivation to stay active and ex-
ercise (Alqhatani and Lipford, 2019).
In this work, we explore an attack aimed at iden-
tifying one target user in an aggregated database by
exploiting specific PFI records, namely, time series of
steps and calories. More specifically, we investigate
a
https://orcid.org/0000-0003-3353-102X
a scenario where an adversary has already obtained
other records of the target user from other sources
(e.g., posts on social networks), as shown in Fig. 1.
We distinguish between two main cases: in the first
case, the attacker is certain that one of the time series
in the database belongs to the target; in the second,
the attacker is not sure whether the target is actually
present in the database. Our approach consists in find-
ing a time series in the database containing the highest
amount of samples that are “similar” to those already
owned by the adversary. The way we define similar-
ity between samples is explained in the next Section
4. Our contributions can be summarized as:
• showing a method based on known machine learn-
ing algorithms that allows to link time series con-
taining similar PFI records;
• measuring the probability for our method to find a
user in a group of N users;
• using our results to demonstrate the identifying
capability of PFI records.
The rest of the paper is structured as follows. In Sec-
tion 2, we introduce the related work. In Section 3,
we describe the problem more in details, and we in-
troduce the notation used. The method that we use in
our implementation of the linking attack is presented
in Section 4. The datasets employed in our experi-
ments are listed in Section 5. We present experimen-
tal results in Section 6. Possible directions for future
work are considered in Section 7. Finally, section 8
concludes the paper.
806
Marchioro, T., Kazlouski, A. and Markatos, E.
User Identification from Time Series of Fitness Data.
DOI: 10.5220/0010585008060811
In Proceedings of the 18th International Conference on Security and Cryptography (SECRYPT 2021), pages 806-811
ISBN: 978-989-758-524-1
Copyright
c
2021 by SCITEPRESS – Science and Technology Publications, Lda. All rights reserved

Had a great day today! Here are my
results: steps: 18134, calories: 2159, 2
workouts, and 8 hours sleep.
20 3 45
Bob @bob89 19h
aggregated database
public data on social networks
Eve
#
Day
Steps
Calories
User 1
1
4636
3323
User 2
1
1810
1373
User 3
1
16200
1819
User 4
1
6847
1969
User 5
1
4317
2590
Figure 1: In our threat model, PFI records of the target user
(Bob) are stored in a public database, aggregated with other
records. The attacker (Eve) has access to some other PFI
records from Bob (e.g., she extracts such information from
Bob’s posts on social media) and uses them to link the ag-
gregated records to Bob.
2 RELATED WORK
Personal fitness information collected by wearables
has been object of several studies on security and pri-
vacy. Christovich (Christovich, 2016) discussed the
necessity of protecting PFI data, and proposed statu-
tory guidelines to handle them. Another point ex-
amined in this work was the possibility of employ-
ing PFI data to build a “quantified self”, i.e., an in-
dividual profile built from continuous tracking of a
user. This concern was supported by a number of re-
cent studies, which employed PFI data from smart-
bands to infer health-related information. Sathya-
narayana et al. (Sathyanarayana et al., 2016) utilized
daily activity data from wearables to predict the qual-
ity of user’s sleep. Al-Makhadmeh and Tolba (Al-
Makhadmeh and Tolba, 2019) employed Boltzmann
deep belief neural networks to predict heart diseases
using features derived from heart rate and blood pres-
sure records. Zhu et al. (Zhu et al., 2020) proposed
a framework that leverages heart rate and sleep data
to detect symptoms of COVID-19 with the purpose of
predicting pandemic’s trends.
3 PROBLEM STATEMENT
In this work we explore two scenarios, both involving
a smartband user (Bob) and an attacker (Eve) as ac-
tors. We assume that Eve possesses some PFI data
y from Bob, which consist of a sequence of steps
and calories collected on different days. Using these
records, Eve aims at finding Bob in a public database,
which contains fitness information on N smartband
users θ
1
,...,θ
N
. The information consists of time se-
ries of PFI records x
1
,. ..,x
N
, and of some additional
data, e.g., users’ sleep information or diet. Eve tries to
find Bob inside this database by verifying which time
series among x
1
,. ..,x
N
has most “similar” samples to
y. This way, she can glean the additional information
about Bob that is contained in the data.
The two scenarios that we investigate are the fol-
lowing:
Scenario 1. We assume that the presence of Bob in
the database is certain and that Eve is aware of it. In
this case, she needs to determine who is Bob among
θ
1
,. ..,θ
N
. A naive guess, i.e., choosing one sequence
at random, would lead to a success probability of 1/N.
Scenario 2. We assume that Bob may or may not
be in the database and Eve is not informed of which
is the case. Therefore, in this scenario she has two
tasks, i.e. to determine which user among θ
1
,. ..,θ
N
is more likely to be Bob and to verify if he is actually
Bob. So the possible conclusions that Eve can draw
are that Bob is either θ
1
,. ..,θ
N
, or none of them.
In both cases, Eve employs the data y =
(y
(1)
,. ..,y
(T
0
)
) in her possession and compares
them with x
1
,. ..,x
N
to determine which is the most
“similar”. In the second scenario, she also needs
to determine if the most similar sequence is similar
“enough” to conclude that the user is present in the
database.
4 METHODS
In order to link the data of the target user y to his cor-
responding time series in the aggregated database, we
employ an approach based on machine learning. The
idea is that we train classification models on the sam-
ples from time series x
1
,. ..,x
N
and we use them to
classify the samples from y. In particular, we con-
sider each user in the database as a class and all sam-
ples from time series x
i
belong to class θ
i
. We use the
number of samples that are assigned to the class θ
i
as
a measure of similarity between x
i
and y. E.g., if most
of the samples are labeled as θ
3
, we conclude that x
3
is the time series with most “similar” samples to y.
The training consists in defining a map from the
feature space X to the set of users Θ = {θ
1
,. ..,θ
N
}
ˆ
f : X → Θ, y
(t)
7→
ˆ
f (y
(t)
).
This map classifies single samples and assign them
to the θ
i
∈ Θ who is most likely to have produced
them. We call
ˆ
f single-sample decision rule, and we
apply it on each of the records y
(1)
,. ..,y
(T
0
)
from the
target user. Indeed, part of the samples – even a great
User Identification from Time Series of Fitness Data
807

part – may be classified incorrectly, and in general the
samples of y will not be all assigned to the same class.
Therefore, we make the final prediction using a ma-
jority rule
ˆ
θ = argmax
θ
i
∈Θ
{y
(t)
:
ˆ
f (y
(t)
) = θ
i
,t = 1, .. ., T
0
}
. (1)
That is, we use
ˆ
f to classify independently each sam-
ple of y and we choose the class (user)
ˆ
θ that has
been selected most times. Notice that in order for
the majority rule to work,
ˆ
f is not even required to
have a high accuracy. The only requirement is that
ˆ
f must predict the correct user more frequently (i.e.,
with higher probability) than any other user. E.g., if
when a sample is produced by θ
3
, the rule
ˆ
f predicts
θ
3
with 30% probability and any other user with less
than 30% probability, then on average the majority
rule will predict θ
3
correctly.
In our experiments, we tested the following algo-
rithms to train the single-sample prediction rule: k-
Nearest Neighbors (kNN) (Kuncheva and Jain, 1999),
Random Forests (RF) (Ho, 1995),Support Vector Ma-
chines (SVM) (Hearst et al., 1998) with RBF kernel,
and Kernel Density Estimation (KDE) (Parzen, 1962)
with Gaussian kernel.
Determining the Presence of the User in the
Database. In the second scenario that we study, it is
not known whether the target is present in the aggre-
gated database. For this case, we first link the target’s
data y to the closest user in the database, adopting the
same decision rule from the first scenario. Then, we
compute a score that estimates how confident we are
about our choice. Given the target’s sequence y and
the sequence x
i
produced by the selected user θ
i
, a
subscore s(x
i
,y
(t)
) is computed for each sample y
(t)
as
s(x
i
,y
(t)
) = min
τ
kx
(τ)
i
− y
(t)
k (2)
that is the Euclidean distance between y
(t)
and the
closest sample of x
i
. The final score is obtained by
averaging the subscores,
S(x
i
,y) =
100
T
0
T
0
∑
t=1
s(x
i
,y
(t)
). (3)
The factor 100 is used solely for rescaling. Intu-
itively this score measures the average distance be-
tween closest samples from x
i
and y. Hence, the lower
the score, the closest are the two sequences and the
more likely it is that they have been produced by the
same user. The final decision of whether θ
i
is actu-
ally the target user is taken by comparing S(x
i
,y) to
a threshold. If the score is above the threshold we
conclude that the target is not present in the database,
otherwise we conclude that he is θ
i
.
5 DATASETS
In our experiments we employ two datasets, which
we call dataset D1 and dataset D2, both containing
daily PFI records from different users collected by
Fitbit devices. We extract only information about
daily number of steps and calories consumption from
each user and ignore the remaining information. The
first half of the samples is used to simulate the aggre-
gated data on which the decision rule is trained. The
second half, instead, is used for prediction to simulate
the data collected by the adversary.
Dataset D1. The first dataset comprises 35 users
recorded from March 2016 to May 2016, covering a
total of 61 days.
The dataset is available at: http://doi.org/10.5281/
zenodo.53894. However, in this dataset one user was
present in the first month but not in the second, and
hence was removed.
Dataset D2. The second dataset, called PMData
(Thambawita et al., 2020), comprises 16 users
recorded for a period of 5 months, from November
2019 to April 2019, covering a total of 151 days.
The dataset is available at: https://doi.org/10.31219/
osf.io/k2apb.
In both datasets, we discarded the samples that con-
tained zeros and removed the users with too few non-
zero samples. In the end, the first 29 users were kept
for D1 and the first 9 were kept for D2.
6 EXPERIMENTS
In our experiments we estimate the success probabil-
ity P
succ
of a linking attack in scenario 1, where the
target is certainly present in the aggregated database
and the adversary is aware of it; and scenario 2, where
the target is present in the database with probability
p. We show how the results vary with the number of
users in the database N and with the inclusion proba-
bility p. We repeated each of our experiments doing
a Monte Carlo sampling for a number n
tot
= 1000 of
iterations and averaged the results.
Choice of the Hyperparameters. In our experi-
ments, we opted for an arbitrary choice of the hyper-
parameters rather than fine-tuning them through some
validation techniques. The reason is that our goal is
not to build a fine-tuned model with highest perfor-
mance, but only to show that a learned
ˆ
f combined
SECRYPT 2021 - 18th International Conference on Security and Cryptography
808
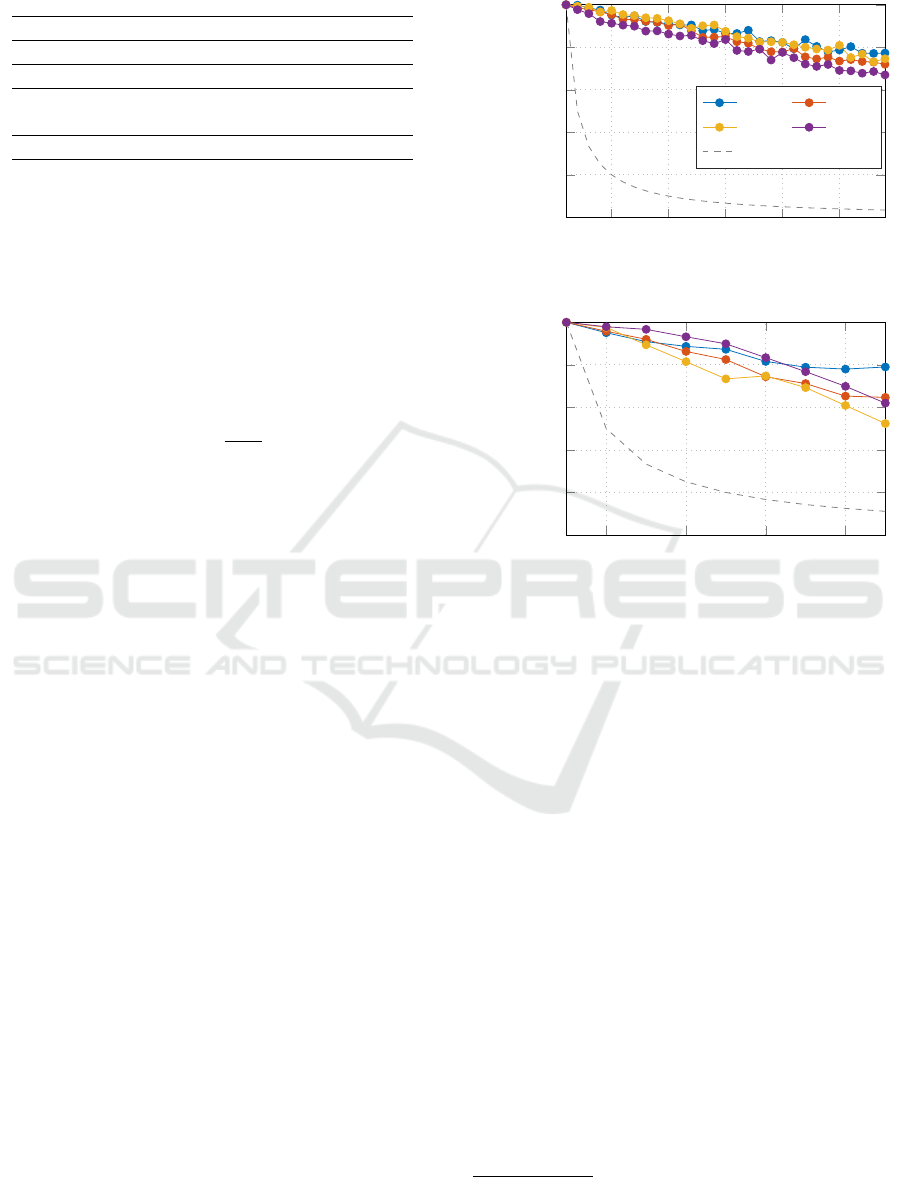
Table 1: Hyperparameters employed for the machine learn-
ing methods.
Method Hyperparameter Value
kNN number of neighbors k 1
RF number of trees n 10
SVM
C 10
3
γ 0.5
KDE bandwidth h 0.5
with the majority rule allows to perform the linking
attack with reasonable accuracy.
6.1 Scenario 1
In scenario 1, we estimate the probability of success
of the linking attack for N users as the accuracy of our
predictions. That is, we count the number n
succ
of cor-
rect predictions and we divide it by the total number
of predictions:
P
succ
=
n
succ
n
tot
.
After initializing the counter of correct predictions at
n
succ
= 0, we repeat the following loop n
tot
= 1000
times:
1. Sample N users θ
i
1
,. ..,θ
i
N
at random from the
dataset.
2. Train the model on the training points x
i
1
,. ..,x
i
N
from the sampled users.
3. Choose one user uniformly at random among
θ
i
1
,. ..,θ
i
N
and make the prediction on his test
points y.
4. If the prediction is correct, update the counter of
correct predictions n
succ
.
We compare our results with a naive approach which
consists in guessing the user at random, with a success
probability of 1/N.
Results for Varying Number of Users. The first
experiment that we run consists in checking how P
succ
scales for an increasing number of users N. In order
to do so, we repeat the steps mentioned above, vary-
ing the value of N from 1 to the maximum number of
available users. We employ the first half of the sam-
ples for training and the other half for testing.
The results are displayed in Figure 2. For dataset
D1, all the methods obtained an accuracy above
60% even when the model is trained on all the 29
users. Moreover, kNN with k = 1 has the best per-
formance, with a success probability above 78% on
both datasets. For dataset D2, we obtained worse re-
sults when the number of users reached the maximum
5
10
15
20
25
0
0.2
0.4
0.6
0.8
1
Number of users (N)
P
succ
Dataset D1
kNN
RF
SVM
KDE
Naive
2 4
6
8
0
0.2
0.4
0.6
0.8
1
Number of users (N)
P
succ
Dataset D2
Figure 2: The success probability P
succ
estimated for vary-
ing number N of users.
(i.e., 9), which can be possibly explained by the pres-
ence of two similar users. Since the overall number of
users is small, it is likely that if two similar users are
present, they are sampled often.
6.2 Scenario 2
In scenario 2, depending on whether a user is actually
included or not, the detection rule can lead to different
outcomes
1
:
• true positive (TP), if the target is included and the
rule correctly identifies him;
• false negative (FN), if the target is included and
the rule fails to detect him;
• true negative (TN), if the target is not included
and the rule concludes that he is actually not
present;
• false positive (FP), if the target is not included and
the rule detects one user as the target.
1
It is worth remarking that the definitions of true positive
and false negative are different from the standard ones.
User Identification from Time Series of Fitness Data
809
Distinguishing between these outcomes allows us to
estimate the probability of success, conditioned on the
user being or not in the database, respectively as
P
succ|in
=
TP
TP + FN
and P
succ|out
=
TN
TN + FP
. (4)
These two probabilities are known in literature as re-
call and specificity. In addition, using the law of total
probability, it is possible to compute the success prob-
ability for a generic value of p as
P
succ|p
= pP
succ|in
+ (1 − p)P
succ|out
. (5)
When the user has the same probability of being in-
cluded or not in the database (i.e., p = 0.5) P
succ|0.5
is known as balanced accuracy. The experiments are
conducted following an analogous procedure to sce-
nario 1, repeating the test for n
tot
= 1000 times and
averaging the results. Indeed, in these experiments
the user can be sampled either from θ
1
,. ..,θ
N
or from
the other users available in the datasets. To identify
the target, we employ the kNN method with k = 1,
which provides the best results in scenario 1.
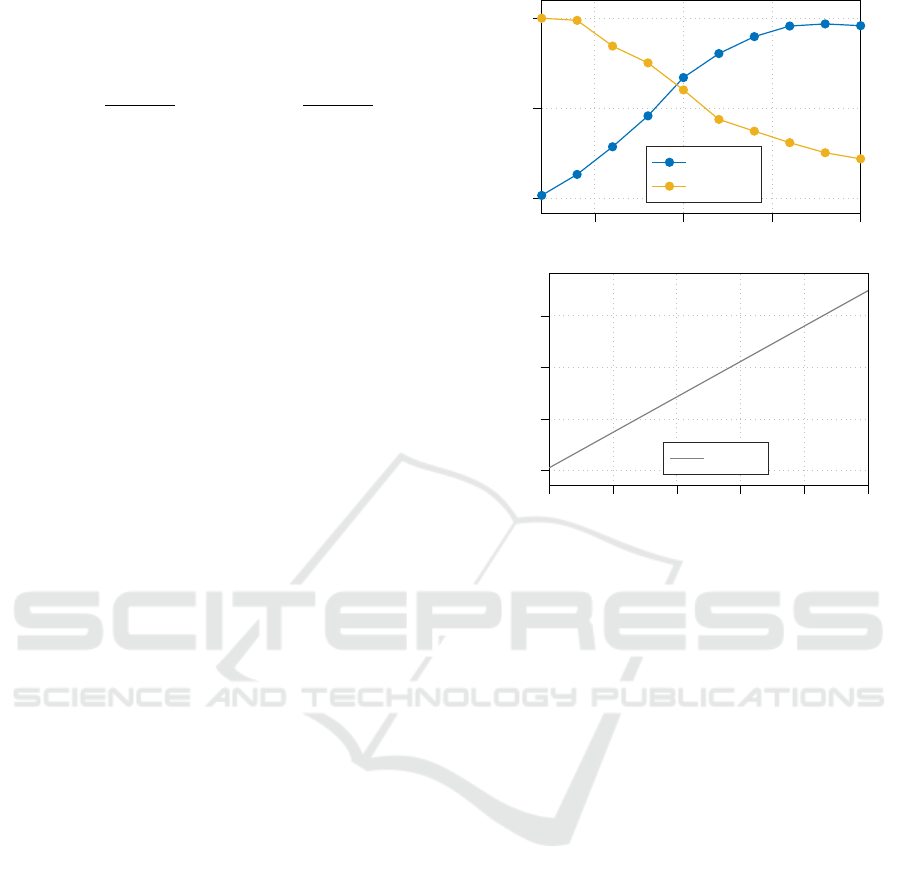
Results for Varying Threshold. We first evaluate
how P
succ|in
and P
succ|out
change for different values of
the threshold. The first plot of Figure 3 shows that the
threshold allows to regulate a tradeoff between recall
and specificity. In particular, when the threshold is
low, most of the times the rule concludes that the user
is not present in the database, so P
succ|in
is low, and
P
succ|out
is high. Conversely, when the threshold in-
creases, P
succ|in
grows and P
succ|out
decreases. Thresh-
old 10 is the value giving almost equal importance to
the positive and negative cases. Moreover, from equa-
tion 5 we can infer that the two probabilities consti-
tute bounds for P
succ|p
. This is shown graphically in
the second plot of Figure 3. Since P
succ|p
is a convex
combination of P
succ|in
and P
succ|out
, the two probabil-
ities constitute the extremes of the line at p = 1 and
p = 0, respectively. We show only the plot for dataset
D1, since dataset D2 provides analogous results.
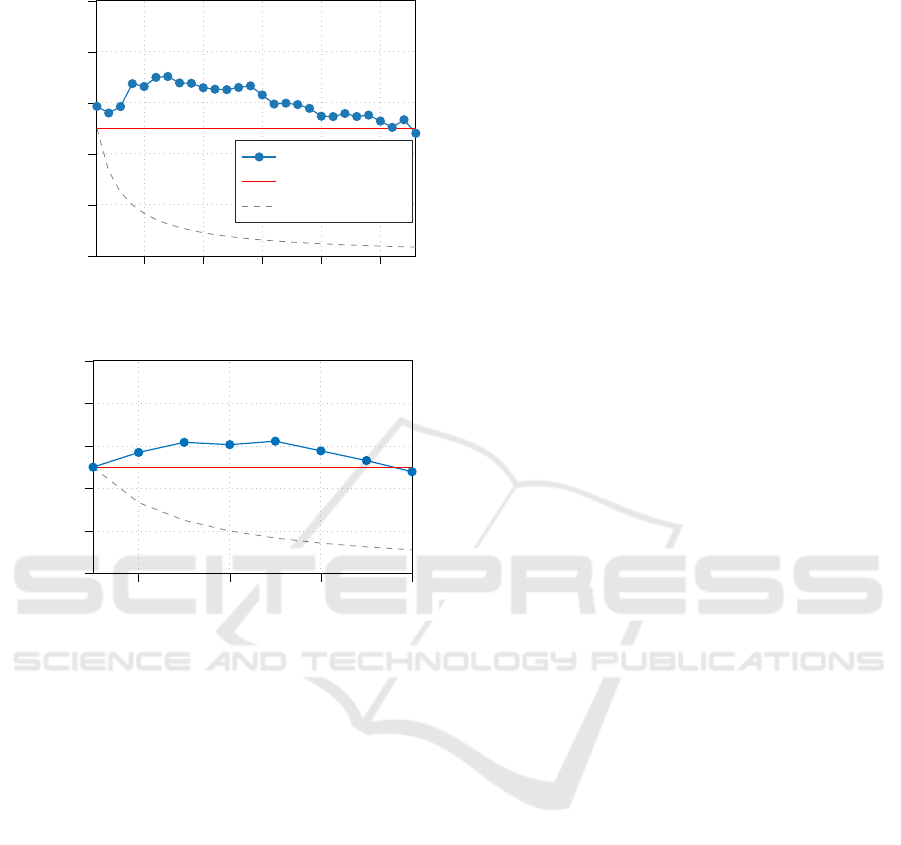
Results for Varying Number of Users. We fix the
threshold value to 10 and we vary the number N of
users in the database. We compare the performance
of our method with two naive rules. The first one is
naive rejection, which consists in always concluding
that the user is not present in the database and has
success probability 1 − p. The second one is naive
guessing, and consists in choosing with equal proba-
bility one of the users or “not present in the database”.
The success probability of such rule is 1/(N + 1) re-
gardless of the value of p (it can be easily verified
by applying the law of total probability). Our method
5
10
15
20
0
0.5
1
Threshold
P
succ|in
P
succ|out
0 0.2 0.4
0.6
0.8 1
0.6
0.62
0.64
0.66
Inclusion probability (p)
P
succ|p
Figure 3: On the top, P
succ|in
and P
succ|out
of the score
method in scenario 2, estimated for fixed number of users
N = 15 and varying threshold. On the bottom, P
succ|p
for
different values of inclusion probability p, N = 15 and
threshold 10. Results are for dataset D1.
shows better performance of both the naive rules in
most cases. Naive rejection appears to provide close
performance, but on the other hand it never allows to
find the target user when he is actually present.
Figure 4 shows the behavior of balanced accu-
racy P
succ|0.5
for increasing number of users in both
datasets. The success rate is lower compared to sce-
nario 1, as expected since the task is more complex,
but still between 50% and 70%.
7 FUTURE WORK
We forsee two main continuations for this work. The
first consists in expanding the study of linking attacks
on personal fitness information. One idea may be to
vary the PFI features that are employed in the attack:
e.g., it could be interesting to investigate how the suc-
cess probability changes if sleep patterns or heartbeat
records are included in the data. Furthermore, it will
be necessary to make experiments on larger datasets,
in order to confirm the validity of our results and to
apply more refined techniques requiring more data.
A second possibility may be to study the effective-
SECRYPT 2021 - 18th International Conference on Security and Cryptography
810
5
10
15
20
25
0
0.2
0.4
0.6
0.8
1
Number of users (N)
P
succ|0.5
Dataset D1
Score method
Naive rejection
Naive guessing
2 4
6
8
0
0.2
0.4
0.6
0.8
1
Number of users (N)
P
succ|0.5
Dataset D2
Figure 4: Success probability of the score method in sce-
nario 2, estimated for varying number N of users and fixed
threshold 10. The probability of inclusion for the target is
fixed at p = 0.5.
ness of anonymization techniques as countermeasures
for linking attacks. Applying straightforwardly con-
cepts like k-anonymity or differential privacy to time
series data will most of the times cause an excessive
loss of information, making the anonymized data un-
usable, so a main aspect to be addressed is the tradeoff
between utility and privacy when protecting PFI data.
8 CONCLUSIONS
Throughout this paper, we investigated the problem of
leveraging personal fitness information to find a target
in a set of N people. Our results show that using just
steps and calories it is possible to identify the user
with higher probability compared to random guess-
ing. We focused on a specific threat model where an
attacker tries to find a target user in an aggregated
dataset. However, identifiable data are prone to a
wider pool of threats that need to be addressed. We
hope that this will raise awareness on the sensitivity
of personal fitness information, and that it will lay the
foundation for future works aimed at protecting it.
ACKNOWLEDGEMENTS
This project has received funding from the Euro-
pean Union’s Horizon 2020 research and innovation
programme under the Marie Skłodowska-Curie grant
agreement No 813162. The content of this paper re-
flects the views only of their author (s). The European
Commission/ Research Executive Agency are not re-
sponsible for any use that may be made of the infor-
mation it contains.
REFERENCES
Al-Makhadmeh, Z. and Tolba, A. (2019). Utilizing iot
wearable medical device for heart disease prediction
using higher order boltzmann model: A classification
approach. Measurement, 147:106815.
Alqhatani, A. and Lipford, H. R. (2019). “there is nothing
that i need to keep secret”: Sharing practices and con-
cerns of wearable fitness data. In Fifteenth Symposium
on Usable Privacy and Security ({SOUPS} 2019).
Christovich, M. M. (2016). Why should we care what fit-
bit shares-a proposed statutroy solution to protect sen-
sative personal fitness information. Hastings Comm.
& Ent. LJ, 38:91.
Hearst, M. A., Dumais, S. T., Osuna, E., Platt, J., and
Scholkopf, B. (1998). Support vector machines. IEEE
Intelligent Systems and their applications, 13(4):18–
28.
Ho, T. K. (1995). Random decision forests. In Proceedings
of 3rd international conference on document analysis
and recognition, volume 1, pages 278–282. IEEE.
Kuncheva, L. I. and Jain, L. C. (1999). Nearest neighbor
classifier: Simultaneous editing and feature selection.
Pattern recognition letters, 20(11-13):1149–1156.
Parzen, E. (1962). On estimation of a probability density
function and mode. The annals of mathematical statis-
tics, 33(3):1065–1076.
Sathyanarayana, A., Joty, S., Fernandez-Luque, L., Ofli, F.,
Srivastava, J., Elmagarmid, A., Arora, T., and Taheri,
S. (2016). Sleep quality prediction from wearable
data using deep learning. JMIR mHealth and uHealth,
4(4):e125.
Thambawita, V., Hicks, S., Borgli, H., Pettersen, S. A., Jo-
hansen, D., Johansen, H., Kupka, T., Stensland, H. K.,
Jha, D., Grønli, T.-M., and et al. (2020). Pmdata: A
sports logging dataset.
Zhu, G., Li, J., Meng, Z., Yu, Y., Li, Y., Tang, X., Dong, Y.,
Sun, G., Zhou, R., Wang, H., et al. (2020). Learning
from large-scale wearable device data for predicting
epidemics trend of covid-19. Discrete Dynamics in
Nature and Society, 2020.
User Identification from Time Series of Fitness Data
811
