
Edge Detail Analysis of Wear Particles
Mohammad Shakeel Laghari
1a
, Ahmed Hassan
1b
and Mubashir Noman
2
1
College of Engineering, United Arab Emirates University, Al Ain, U.A.E.
2
Mohamed Bin Zayed University of Artificial Intelligence, Abu Dhabi, U.A.E.
Keywords: Contour Points Angle, Edge Details Analysis, Tribology, Wear Debris Classification.
Abstract: Tribology is the study of wear particles that are generated in all machines with interacting mechanical parts.
Particles are separated from the surfaces due to friction and relative motion. These microscopic particles vary
in certain characteristics of size, quantity, composition, and morphology. Wear particles or wear debris are
categorized by six morphological attributes of shape, edge details, texture, color, size, and thickness ratio.
Particles can be identified with the help of some or all of these attributes however, only edge details analysis
is considered in this paper. The objective is to classify these particles in a coherent way based on these
attributes and by using the acquired knowledge to predict wear failure modes in machinery. There are two
procedures described in this work; one is the angle calculation between equidistance points on the particle
boundary and the other the computation of centroids’ distance from the boundary points. These procedures
will classify particle edges as smooth, rough, straight, or spherical (curved).
1 INTRODUCTION
An important area of image processing and computer
vision deals with on-line or off-line visual inspection
systems that can assist the industry to improve the
economy of the operation, quality, and productivity
of the manufacturing machinery. Microscopic wear
particle analysis is included in such industrial
inspection systems. The particles that originate from
the surfaces of interacting mechanical parts are
accumulated in lubricating oil that carries necessary
information and knowledge regarding the physical
condition of the machinery (typically referred to as
condition monitoring). This acquired critical
knowledge is utilized by Tribologists to identify
known wear mechanisms that can anticipate wearing
failure modes in machines (Hunter, 1975, Xu, 1998,
Peng, 2001).
Analysts examine particles in a conventional way,
which includes particle quantity, size, and
composition. These three parameters are used to link
specific particle types to known wear modes and are
typically utilized to predict wear failures. For
example, an increase in particle size and/or quantity
indicates an abnormal behaviour of the machine as
a
https://orcid.org/0000-0002-4738-1571
b
https://orcid.org/0000-0002-7513-0243
well as composition indicates the origin of the wear
particle generation. Although the conventional
procedures can provide a fair judgment of a machine
operating condition, however, morphological
analysis is essential to bring consistency in wear
judgments.
Wear particle diagnostic queries when examined
by a number of experts in the field typically result in
conflicting wear judgments due to the privation of an
internationally defined standardization of terms used
to describe wear particles and their relationship to
originating wear processes. This created uncertainty
and difference of opinion among experts of the field
and therefore, an automated and robust analysis
approach is needed to develop a morphological-based
system.
The devised procedure described in this paper is
edge details analysis that allows systematic analysis
of wear debris by using one of the six morphological
attributes. The remaining morphological attributes
are particle size, shape, color, texture, and thickness
ratio. The procedures used for this investigation are
equidistance contour points angle and centroid
distance calculation. Expensive equipment failure
550
Laghari, M., Hassan, A. and Noman, M.
Edge Detail Analysis of Wear Particles.
DOI: 10.5220/0010584105500557
In Proceedings of the 16th International Conference on Software Technologies (ICSOFT 2021), pages 550-557
ISBN: 978-989-758-523-4
Copyright
c
2021 by SCITEPRESS – Science and Technology Publications, Lda. All rights reserved

and/or loss of profitable production time can be
prevented by using the above-mentioned procedures.
2 WEAR PARTICLES
Tribology is the study of friction between surfaces,
their associated wears, and the lubrication that
contain these wears. Alternatively, it can said that the
field of Tribology is the study of wear particles (Jost,
1990).
Interacting mechanical parts of a machine
produces wear particles due to friction. A large
amount of wear particles is produced when a machine
is brought into operation for the first time. After a
certain initial run period, the production of wear
particles is reduced and reaches a steady state.
Alternately, not reaching a steady state is an
indication of an abnormal wear mechanism.
Several methods are used to separate wear
particles from lubricants to perform off-line
examination and analysis. One of the methods is the
use of various sizes of filters located at particular sites
in a machine. The particles collected from these
different size filters are spread on glass slides from
these filters are deposited on glass slides for auxiliary
analysis.
Ferrography is another method that uses
magnetism to hold and separate wear particles from
the lubricant. Ferro graphic slides or substrates are
prepared by inclining the slides at an angle and the
particle-contained lubricant is flown down the surface
holding the particles onto the slide. The arrangement
of particles on the slide is relative to their sizes (Li,
2017).
An additional method of separating wear particles
is the Magnetic Chip Detectors (MCD). This method
uses small removable units equipped with a powerful
permanent magnet and is located at suitable positions
in the machine. Particles are attracted to the units and
are wiped on a slide (Bowen, 1976, Cumming, 1989).
Wear particles are inspected by two approaches of
quantitative and morphological. Quantitative analysis
is the most common, objective, and fast method of
measurement because only particle size and quantity
are considered. However, the information it provides
is unreliable and may result in uncertainty.
An optical microscope is used to perform off-line
morphological analysis. The information collected
from the six attributes in this analysis can be used to
make reliable wear judgments and predict wear
failure modes. This analysis also helps to identify the
origin of the generated wear.
The particles are classified into several types that
are dependent on the relational between their
compositional and morphological properties and
formation conditions. There are approximately 29
different types of wear particles where each particle
gives a different indication about the machine
operating condition. A few examples of wear
particles are rubbing wear, cutting wear, severe
sliding, wear, fatigue wear, pitting wear, etc.
(Albidewi, 1993, Anderson, 1991).
3 LITERATURE REVIEW
Raadnui presented a survey of wear particles analysis
techniques that are based on certain characteristics
features including shape factors, edge or curvature
details, surface texture, size or quantity, Fourier
parameters, fractal dimension, etc. (Raadnui, 2005).
Laghari investigated the particle profile by using
shape parameters, size, and edge details of the wear
debris (Laghari, 2003). He concluded that shape
parameters combined with edge detail features could
provide clear distinctions between the types of
particles.
Goncalves et al. proposed a system for
segmentation of wear particles from the microscopic
images and performed shape analysis of the particles
to group them according to their size, aspect ratio, and
edge roundness factor (Goncalves, 2008).
Laghari et al. proposed a “knowledge-based wear
particle analysis” system to identify different types of
wear debris by using edge details and surface texture
features (Laghari, 2007). The authors used the Ferret
centric diameter method to determine the
characteristics of the edge details and texture
properties of coarseness, homogeneity, and
periodicity for classification purposes.
Peng et al. proposes a method for segmenting
Ferrography image to analysis oxide wear particles in
intricate images (Peng 2019). A watershed transform
is initially used to segment particle images and then
segmentation results are improved by two region
merging rules. In the final phase, the features
including the edge details are achieved to detect and
analyse the oxide wear particles.
Laghari et al. devised an automated image
analysis system for the classification of wear debris
(Laghari, 2010). The system extracts shape and edge
details of the particles and stores the extracted
information in a database. The system then performs
further analysis to identify different types of wear
debris.
Edge Detail Analysis of Wear Particles
551
Wang et al. investigated an objective evaluation
of wear particle edge detection by using a newly
devised non-reference method (Wang, 2018). The
method describes three components that are put
together for a broad index of edge evaluation. The
three components are the rebuilding based similarity
sub-index between the two images of original and the
remodelled, the indication of the true or false degree
of the edge pixels based on the confidence degree
sub-index, and the determination of the direction
consistency and width uniformity of the edges by
using the edge form sub-index. The authors have
performed two experiments to demonstrate the
validity of the proposed method.
Laghari and Ahmed proposed a system to analyse
the wear particles' edge profile (Laghari, 2009).
Particle profile features were extracted by using the
chain code method and change in boundary angles
was used to analyse the curvature of the boundary.
4 METHODOLOGY
To analyse the edge detail characteristics, wear
particle images are captures from the field of view of
the Leica DMS300 Zoom imaging system supporting
the LAS X (Leica Application Suite X) and 2D
Analysis software. Further analysis on particle
images is performed, by first converting to binary
images using a simple global thresholding algorithm.
The acquired binary image is then filtered based on
the connected component area to retain the largest
connected component. Next, the orientation of the
particle is calculated, and the image is rotated so that
the major axis of the particle is aligned with the
horizontal axis. Then, the morphological opening
operation is performed to remove the noise and thin
protrusions thereby removing small variations in the
particle contours. In the next section, the procedures
of the edge details characteristics are described in
detail.
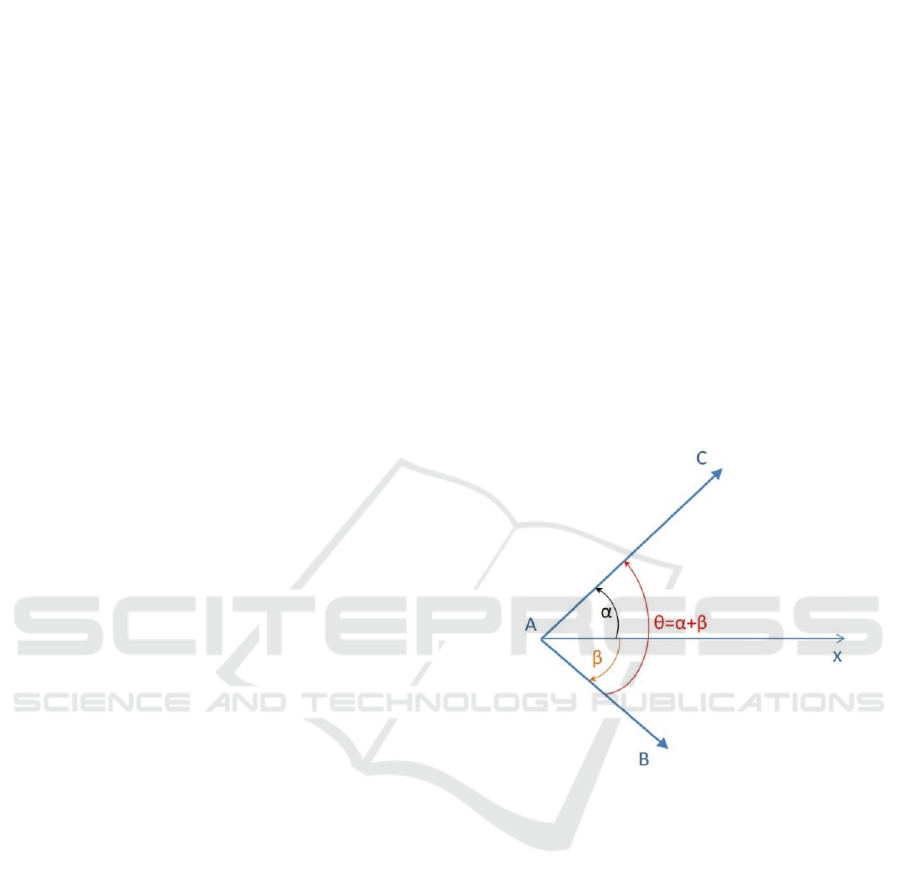
4.1 Equidistant Contour Points Angles
The contour points of particles are extracted from
stored images in such a manner that a pointer is
moved clockwise on the particle image perimeter
starting from a fixed coordinate which is typically the
top-left coordinate. Three equidistant consecutive
points are selected and the angle between them is
computed as shown in Figure 1. To compute the angle
between three points, vectors AC and AB are
calculated. The angles of α and β for each vector are
then calculated concerning the horizontal axis defined
as ‘x’. The final angle between the vectors is the sum
of α and β.
This process of calculating angle is performed for
each boundary point. The computed angle is
converted to the range from zero to 360 degrees.
Then, a derivative of the angle vector is computed to
analyse sharp changes in the particle contour. The
boundary of the particle does not retain its original
shape when the binary particle image is rotated or
threshold, e.g., it can produce zigzag patterns or
roughness in the particle contour. Therefore, an angle
threshold value of 25 degrees is selected to be
considered as the straight edge. The derivative angle
vector is then threshold and several straight-line
segments are counted. Consequently, the length of
each line segment and the percentage of rough and
straight regions is also calculated. Alternatively,
angles difference above 25 degrees is represented as
peaks.
Figure 1: Angle calculation between three points.
4.2 Centroid & Threshold Centroid
Distance
After computing the angle vector of the contour
points, the centroid of the particle is calculated. The
distance of each point from the centroid to the particle
edge points is calculated and saved into another
vector. To analyse the circular nature of the particle,
the distance vector is the threshold by using multiple
minimum distances i.e., if the difference between the
distance of the nearest point and any other point is less
than a certain value then those points are considered
equidistant from the center point. For a perfectly
circular object, the distance vector and threshold
distance-vector will be the same. To analyse the
straight nature of the particle edge, the centroid
distance will have a linear trend for the straight edge
regions.
ICSOFT 2021 - 16th International Conference on Software Technologies
552
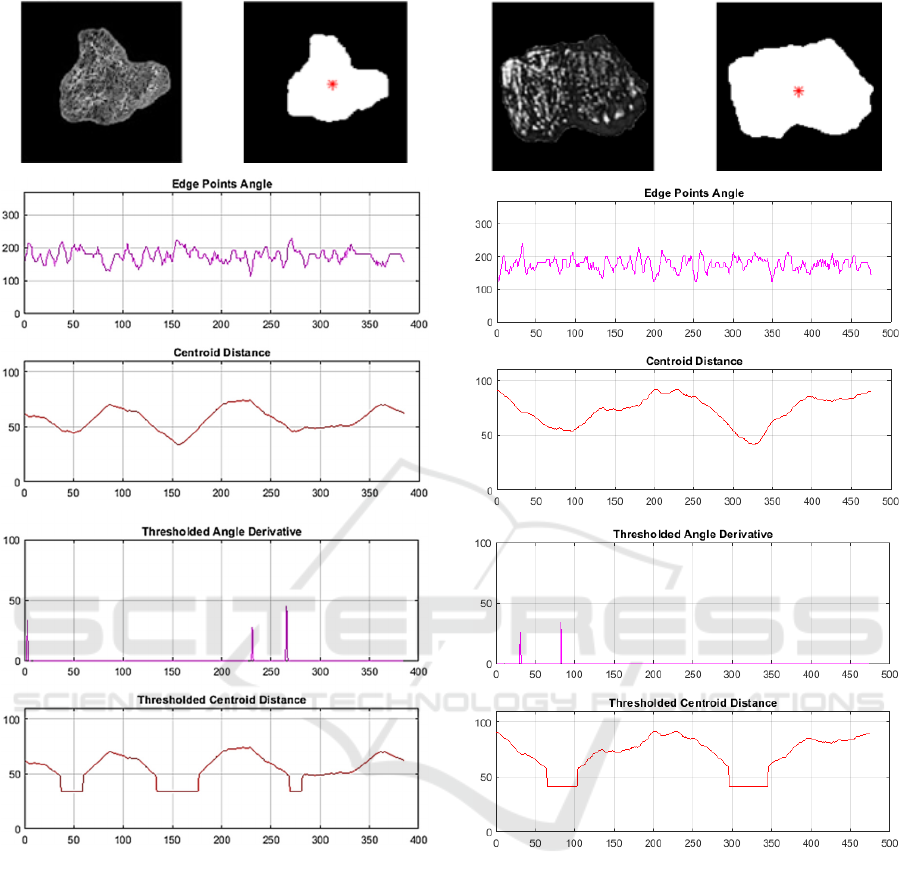
Figure 2: Smooth edged particle 1.
5 EXPERIMENTATION &
DISCUSSION
Equidistant contour points angle and centroid
distance vectors perform the analysis of the boundary
points. The analysis of the boundary points is
performed by equidistant contour point angle and by
centroid distance vectors. Contour point angles are
computed by using three consecutive points, and
three equidistant points with distances equal to one,
two, three, four, and five pixels. Moreover,
experiments are also conducted by using strides of
one, two, three, four, and five, respectively.
Figure 3: Smooth edged particle 2.
For example, angles are computed for three
consecutive points with strides of one to five, and the
same procedure is used for equidistant consecutive
points. It was observed that equidistant consecutive
points with distances equal to three, four, and five
give better results in recognizing the edge
characteristics of a particle. Alternatively, the stride
of one is better as it does not reduce the number of
data points and preserves the integrity of the contour.
The analysis of the contour angle indicates that
particles having smooth edges results in having few
abrupt changes in the angle vector as shown in the
first two charts of Figures 2 and 3. The derivative of
the angle vector contains few impulses or peaks as
seen in both charts. The edge points angle show small
Edge Detail Analysis of Wear Particles
553
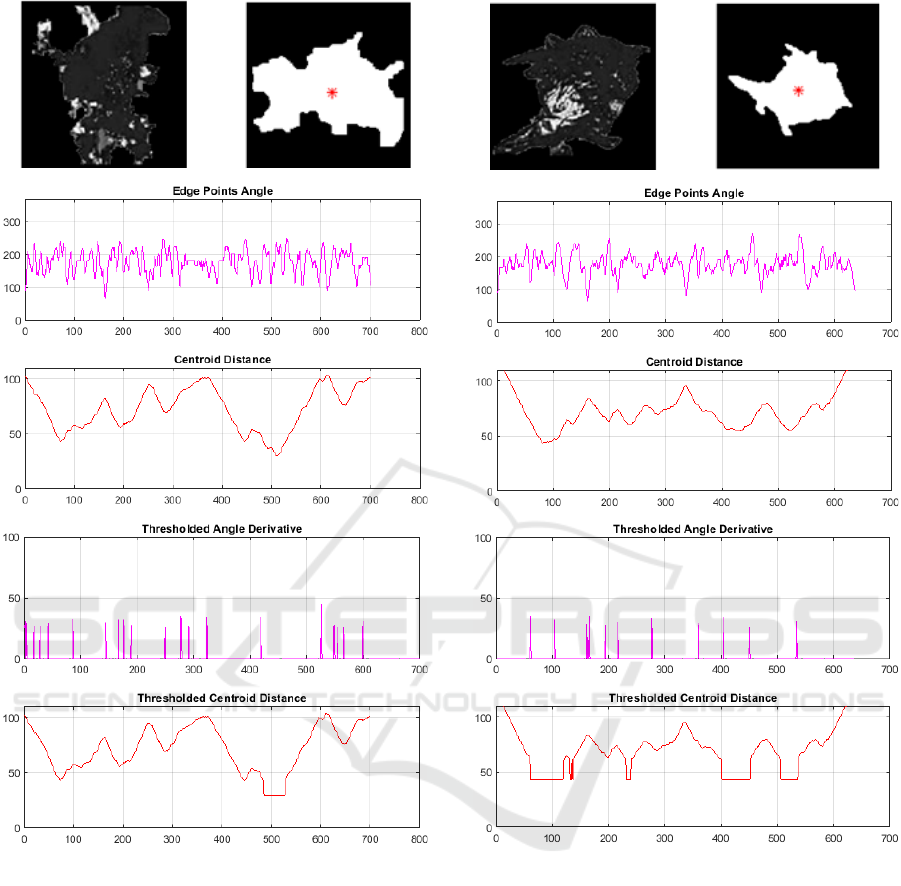
Figure 4: Rough edged particle 1.
angle changes because of the smoothness of the
edges. Comparison of centroid distances between
both charts is also fairly smooth.
Alternatively, rough edges result in sharp changes
in the angle vector shown in the next two charts of
Figures 4 and 5, respectively. The derivative of the
angle vector contains plenty of impulses or peaks
whereas the centroid distance charts show the obvious
roughness of the edges. The threshold angle
derivative charts of rough edged particles are not that
significant for consideration.
On the other hand, the straight edge regions of the
particles have fewer peaks in the angle vector.
Similarly, for curved particles, there is no abrupt
change in angle and the difference between the angles
Figure 5: Rough edged particle 2.
of consecutive points is small, therefore, a curved
region of the particle also does not contain many
angle impulses.
In the case of centroid distance, the variation
between the distances of boundary points is very
small for spherical or curved edged particles. That is
why the spherical particles have the same value for
the threshold distance vector as shown by a horizontal
line of the fourth chart in Figures 6 and 7,
respectively. The trend of the smooth and straight
edges is linear i.e. it is either increasing or decreasing
linearly. Conversely, rough edges have an irregular
pattern that is certainly due to the serrated nature of
the particle contour.
ICSOFT 2021 - 16th International Conference on Software Technologies
554
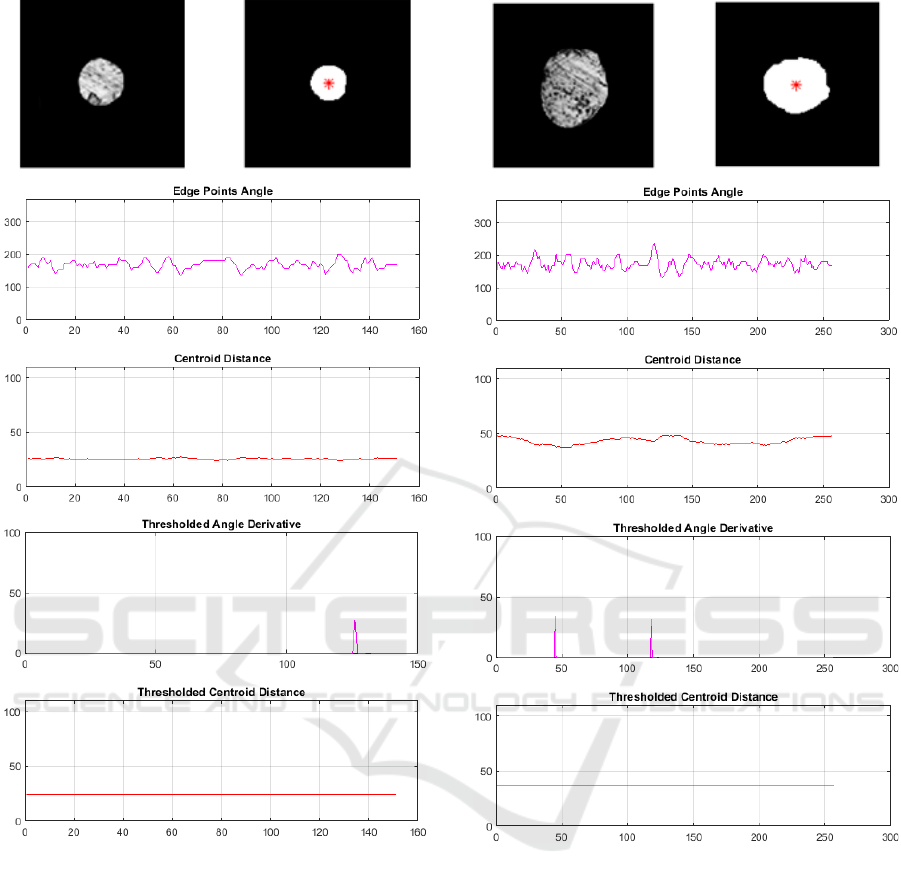
Figure 6: Spherical (round edged) particle 1.
It is also possible to classify the spherical particles
based on their centroid distances whereas smooth and
rough particles can be separated by measuring the
abrupt changes in the angle vector.
The difference between large and small straight
edges can be detected utilizing varying linear patterns
in distance and angle vectors. For large straight edges,
the angle vector has large horizontal line segments in
the second charts of Figures 8 and 9 respectively, and
vice-versa. Similarly, particles having large straight
edges have increased or decreasing linear line
segments as shown in the third charts of both Figures.
Figure 7: Spherical (round edged) particle 2.
6 CONCLUSIONS
In this paper, edge detail analysis is performed for the
automated classification of different types of wear
debris. It is concluded that contour or edge details of
the particles provide significant information about the
characteristics of the particles and this information
helps determine the type and severity of the wear
debris. Moreover, edge detail information can be
combined with other morphological attributes to
make a more robust system for wear particles
classification and identification.
Edge Detail Analysis of Wear Particles
555
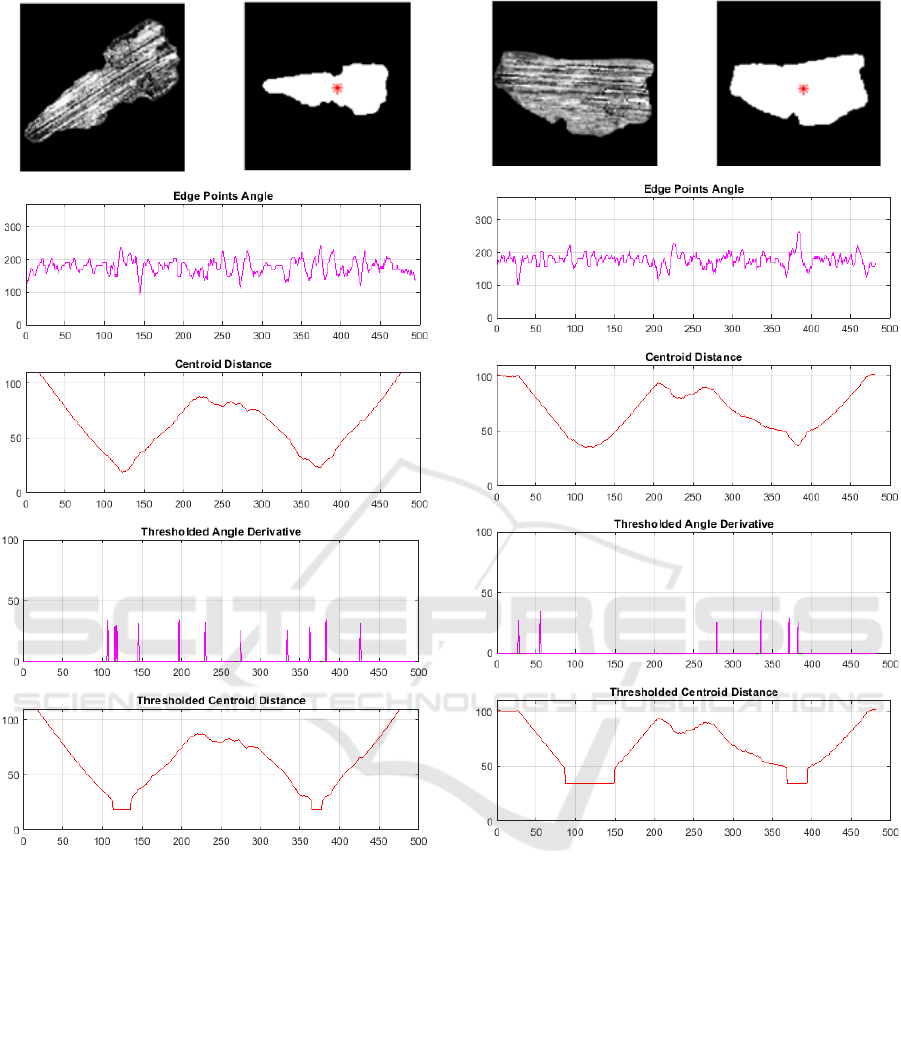
Figure 8: Straight edged particle 1.
ACKNOWLEDGEMENTS
The authors would like to express their appreciation
to the UAEU Program for Advanced Research
(31N321-UPAR-2-2017) and Faculty of Engineering
at UAEU for their financial support.
REFERENCES
Hunter, R. C. (1975). Engine failure prediction techniques.
In Aircraft Engineering, vol. 45, pp. 4-13.
Figure 9: Straight edged particle 2.
Xu, K., Luxmoore, A. R., Jones, L. M., Deravi, F. (1998).
Integration of neural networks and expert systems for
microscopic wear particle analysis. In Knowledge
Based Systems, vol. 11, no. 3, pp. 213-227.
Peng, Z., Goodwin, S. (2001). Wear debris analysis in
expert systems. In Tribology Letters, vol. 11, no. 3-4,
pp. 177-184.
Jost, H. P. (1990). Tribology – Origin and Future. In Wear,
vol. 136, pp. 1-17.
Li, Q., Zhao, T., Zhang, L., Sun, W., Zhao, X. (2017).
Ferrography wear particles image recognition based on
extreme learning machine. In Journal of Electrical and
Computer Engineering, vol. 2017.
Bowen, E. R., Scott, D., Seifert, W., Westcott, V. C. (1976).
Ferrography. In Tribology International, vol. 6, pp.
109-115.
ICSOFT 2021 - 16th International Conference on Software Technologies
556

Cumming, A. C. (1989). Condition monitoring today and
tomorrow – An airline perspective. In Proceedings of
1
st
International Conference on COMADEN’89. United
Kingdom.
Albidewi, I. A. (1993). The Application of Computer
Vision to the Classification of Wear Particles in Oil.
Ph.D. Thesis, University of Wales.
Anderson, D. P. (1991). Wear Particle Atlas (revised)
prepared for the Naval Air Engineering Center
Lakehurst. NJ, USA.
Raadnui, S. (2005). Wear particle analysis - utilization of
quantitative computer image analysis: A review. In
Tribology International, vol. 38, no. 10, pp. 871–878.
Laghari, M. S. (2003). Shape and edge detail analysis for
wear debris identification. In International Journal of
Computer Applications. vol. 10, no. 4.
Goncalves, V. D., Mathias, M. H. (2008). A mechatronic
system applied to wear particle analysis. In Tribologia.
vol. 27, no. 4, pp. 21-28.
Laghari, M. S., Memon, Q. A., Khuwaja, G. A. (2007).
Knowledge based wear particle analysis. In
International Journal of Computer, Electrical,
Automation, Control and Information Engineering. vol.
1, pp. 4115-4119.
Peng, P., Wang, J. (2019). Analysis of oxide wear debris
using Ferrography image segmentation. In Industrial
Lubrication and Tribology, vol. 71, pp. 901-906.
Laghari, M. S., Ahmed, F., Aziz, J. (2010). Wear particle
shape and edge detail analysis. In Proceedings of the 2
nd
International Conference on Computer and Automation
Engineering. Singapore.
Wang, J., Bi, J., Wang, L., Wang, X. (2018). A non-
reference evaluation method for edge detection of wear
particles in Ferrography images. In Mechanical Systems
and Signal Processing, vol. 100, pp. 863-876.
Laghari, M. S., Ahmed, F. (2009). Wear particle profile
analysis. In Proceedings of the International
Conference on Signal Processing Systems. Singapore.
Edge Detail Analysis of Wear Particles
557
