
Identification of Critical Links within Complex Road Networks using
Centrality Principles on Weighted Graphs
Nirupam Bidikar
1 a
, Yunpeng Zhang*
,2 b
and Fengxiang Qiao
3 c
1
Dept. of Computer Science, University of Houston, Houston, U.S.A.
2
Dept. of Information and Logistics Technology, University of Houston, Houston, U.S.A.
3
Innovative Transportation Research Institute, Texas Southern University, Houston, U.S.A.
Keywords:
Resilience, Graphs, Roadway Infrastructure, Geographic Information Systems, Centrality, Betweeness, Node
Criticality, Link Criticality.
Abstract:
Building resilient infrastructure has become a necessity in modern times. If a system can efficiently deal
with failures, it is considered resilient. Roadways are some of the most vital infrastructures in the world. Their
collapse due to unprecedented calamities would disrupt the normal functioning of society and cause significant
financial loss. To minimize traffic jams and keep traffic flowing during such times, it is essential to identify
important roads within a network and plan alternate routes to divert traffic. This study aims to find critical links
in a road network and study their relationships with important nodes in the same network. It also highlights
some traditional approaches and applies graph-theory concepts to measure node and edge importance within
a network. An approach based on variable centrality is proposed. We have implemented our proposed system
and evaluated its performance on multiple networks including a large scale statewide road network in Texas.
Our preliminary experiments show promising results.
1 INTRODUCTION
Transportation networks are vital components in as-
sessing a country or state’s planning and infrastruc-
ture capabilities. They also play a crucial role in the
region’s economy and financial standing as they are
one of the essential means of trade. Natural calami-
ties and disasters are some of the events that mas-
sively affect (Mattsson and Jenelius, 2015) transporta-
tion infrastructure. Due to their sudden and unpre-
dictable nature, no amount of preparation is sufficient
to tackle them. (Karagyozov et al., 2012) showcased
that around 44 million euros worth of damage had
been generated on Bulgaria’s transportation infras-
tructure as a result of natural disasters. In such sit-
uations, most people take alternate shortest routes to
reach their destination. This may lead to users choos-
ing roads which are unable to accommodate this new
influx of vehicles causing blockages and traffic jams.
This effect can cascade over through the network and
can compromise multiple roads making them inop-
a
https://orcid.org/0000-0002-3452-4094
b
https://orcid.org/0000-0001-6208-9571
c
https://orcid.org/0000-0001-9074-0288
erable. To tackle such situations and be prepared to
lessen their impacts, there is a need for effective meth-
ods to identify critical links or roads within a given
network. Through proper planning, traffic has to be
properly rerouted through these critical links which
are able to function at a greater operating capacity
until the primary roads are restored to their original
state.
Road networks can be essentially represented as
giant graphs, with intersections or cities being the
nodes and roadways being the edges. Converting
geospatial data like road networks into functional
structures like graphs requires significant preprocess-
ing to address topological errors resulting from, e.g.,
discretized digital coordinate systems. Once that hur-
dle is overcome, one can obtain a network where all
concepts from graph theory like centrality can be di-
rectly applied. Finding alternate routes between a
source and destination can be solved as k-shortest
paths problem using routing algorithms like Djikstra’s
Algortihm or Bellman-Ford Algorithm. These algo-
rithms don’t necessarily give routes which consider
traffic volume and sudden change in flow of traffic.
The critical links we seek should consider the overall
connectivity and the operating capacity of the edge
542
Bidikar, N., Zhang, Y. and Qiao, F.
Identification of Critical Links within Complex Road Networks using Centrality Principles on Weighted Graphs.
DOI: 10.5220/0010583605420549
In Proceedings of the 16th International Conference on Software Technologies (ICSOFT 2021), pages 542-549
ISBN: 978-989-758-523-4
Copyright
c
2021 by SCITEPRESS – Science and Technology Publications, Lda. All rights reserved

which can be calculated though graph properties such
as centrality.
Traditional methods of finding centrality and node
importance are not relevant in weighted and directed
graphs (Opsahl et al., 2010). Recently, researchers
have developed many metrics to represent these prop-
erties for weighted graphs accurately. On road net-
works, not all links have the same functional capac-
ity and importance, and it is crucial to incorporate
this distinction within analyses. This paper shows
how essential links can be identified within complex
road networks using centrality principles on weighted
graphs. It also gives precedence to the structural prop-
erties of the network which has a significant impact on
the proposed centrality metric. Road transport metrics
like edge capacity and daily traffic value are consid-
ered as edge weights to analyze networks better on a
higher level.
The paper is organized as follows. Section 2 high-
lights some of the research done in this field. Sec-
tion 3 introduces several metrics used to quantify con-
nectivity within a network. Section 4 describes data
collection and processing methodology used to per-
form analyses. Section 5 shows the impact of destroy-
ing edges within a network using a synthesised graph
and a real world graph. We also propose a solution
to identify critical links in the network and demon-
strate its performance on real world graphs. Finally
we present conclusions of our work and future direc-
tion of our research.
2 RELATED WORK
(Gauthier et al., 2018) performed stress tests on links
to find out critical connections in networks. The au-
thors experimented with real-world scenarios, includ-
ing traffic flows. They compared results with topo-
logical methods, which have a more significant com-
putational overhead, showing that the criticality of
links depends on the metric being evaluated. This
method seems to be a viable option to determine crit-
ical links. While their research was limited to a small
net work, their results look promising. (Almotahari
and Yazici, 2020) introduced link criticality index for
ranking connections. They used network flows to
evaluate the criticality of a link using readily avail-
able sensor and traffic data. They were able to find
critical links in the network using only the top 20% of
the origin-destination pairs. This approach might not
fare well for all kinds of network structures. Network
topology dramatically affects the performance of this
algorithm. (Furno et al., 2018) proposed a framework
to identify vulnerable nodes in large scale road net-
works. Road networks are modelled as graphs and big
data techniques were used to improve performance.
Betweenness centrality metric is used to evaluate the
critical nodes. Resilience metrics - Vulnerability, ef-
ficient information exchange were used to evaluate
their procedure. City scale networks were represented
as undirected graphs independent of contextual traf-
fic data. (Li et al., 2020) proposes a “Traffic Flow
Betweenness index”(TFBI) to identify critical links
in a network. The index is determined by shortest
travel path, traffic flow, and origin-destination de-
mand. Critical links determined using TFBI are se-
lected and masked from the network to assess their
impact. Compared to the traditional methods, their
approach is computationally less intensive. However,
their method does not consider non-linear effects due
to degradation of connectivity in a sub-network af-
fecting the rest of the network. (Herrera et al., 2016)
analyzed the resilience of water distribution networks
using graph concepts. Their approach involved calcu-
lating redundant paths between nodes and generating
flow graphs to analyze edge operating capacity and
maximum flow through the system. This approach is
suitable for analyzing networks with a threshold for
edge capacity and can scale for large networks.
(Bhatia et al., 2015) studied the Indian railway
network, finding out critical links using percolation
theory. They selected the giant component (largest
connected part of the network) from the network to
perform their analysis and established a metric ”crit-
ical functionality” which is the ratio of nodes in gi-
ant component to that in the original network. Later
they experimented by removing individual nodes and
routes and observing the overall connectivity of the
network. (Singh et al., 2015) developed a service built
using PostGIS and pgRouting, which helps calculate
alternate shortest paths in the event of a natural disas-
ter or any similar incident that compromises an edge.
(Henning et al., 2017) developed a method to
identify critical networks within small city networks
using the centrality indices of edges. They propose a
function that depends on the centrality indices, which
classifies each edge as critical or non-critical. This pa-
per serves as an essential basis for our solution as we
are interested in analyzing the relation between node
and edge importance in large-scale networks.
(Opsahl et al., 2010) published a study in which
they have conducted extensive work to generalize
centrality measures for weighted graphs networks and
find the shortest paths among such networks. (Pas-
sos and Cardoso, 2020) followed up on the previously
mentioned paper and suggested improvements to the
metrics. They suggested that using logarithmic ratios
to calculate variable node centrality would minimize
Identification of Critical Links within Complex Road Networks using Centrality Principles on Weighted Graphs
543

errors and extend the range of varying parameter (α)
as shown in the equations below.
C
log,α
D
(u) = log(
s
u
k
u
) ∗ α + log(k
u
) (1)
C
log,α
C
(u) = log(
C
w
C
(u)
C
C
(u)
) ∗ α + log(C
C
(u)) (2)
where, C
D
represents degree centrality, C
C
represents
closeness centrality, s
u
is strength of a node, and k
u
is
the degree of a node.
Most of the research done in this field is based on
either topology alone or edge weights. As seen from
the study by (Opsahl et al., 2010), we can see how
both these factors are essential to determine central-
ity measures in a weighted graph. Our approach aims
to solve this problem by extending the research done
by (Passos and Cardoso, 2020) and apply it to large
real world networks like road transportation systems.
We also study the relation between node and edge im-
portance in a complex network and how variable cen-
trality is affected by changing the precedence given to
weighted centrality.
3 METRICS FOR
CONNECTIVITY AND
IMPORTANT COMPONENTS
In this section we introduce definitions of various
metrics relevant to assessing the connectivity and re-
silience of a graph.
3.1 Average Shortest Path
It is the average distance between all possible pairs
of points along the shortest possible paths. This met-
ric gives an idea about how the network is connected
overall and the effort it takes to transmit information
among nodes.
3.2 Flow
Flow networks are graphs which showcase connectiv-
ity based an edge’s capacity. Every edge has a flow
parameter which constitutes to the operating limits
of the particular edge. The flow of an edge is fixed
and cannot change. During operation, the informa-
tion flow cannot exceed the set limit defined by the
edge.
3.3 Closeness Centrality
Closeness Centrality depends on distance between a
pair of nodes. Smaller the distance of a node with re-
maining nodes in a network, the greater it’s centrality.
3.4 Betweenness Centrality
This metric measures the importance of a node in the
network. It depends on the number of shortest paths
passing through a vertex for a given pair of start and
end points. Higher the centrality, greater is the influ-
ence of the node on the network meaning it’s disrup-
tion can cause significant problems.
3.5 Service Area
A service area defines a region accessible from a start-
ing point given a distance using the network. A test
was performed on the highway network of Texas us-
ing the major cities as starting points and the output is
shown in Figure 1.
Figure 1: Service area for 100 KM.
3.6 Origin-destination Cost Matrix
OD cost matrix calculates shortest paths between
pairs of nodes within a network. The distance cal-
culated can be euclidean or along the polylines in the
network. This metric is used in GIS for routing prob-
lems involving multiple origins and destinations.
4 DATA COLLECTION AND
PREPROCESSING
The datasets used in this paper were collected for
performing analysis in ESRI Shapefile format (ESRI
and PaperdJuly, 1998) which consists of polylines
and points. The Highway Performance Monitor-
ing System (HPMS) data (TxDOT, 2019) contains
highway performance metrics for the roadway net-
work like average daily traffic volume and maximum
ICSOFT 2021 - 16th International Conference on Software Technologies
544
operating capacity. Texas roads were taken from
TIGER/Line dataset (Bureau, 2020) which shows the
major road system of the state. Texas cities data was
obtained from Open Data Portal (Portal, 2020) hosted
by TxDOT which is a repository for many geospa-
tial datasets. We chose to add in another dataset for
road network obtained from (Survey, 2014) to verify
the effect of topography on our results. This graph is
more generalized and less complex than the TIGER
dataset.
The data was compiled together in a PostgreSQL
database and a spatial index was created for fast
retrieval and processing. Using the PostGIS and
pgRouting extensions, the shapefiles were checked
for topological errors like dangles, self loops, and par-
allel vectors, and shape length for each line segment
was also calculated. The cities database was filtered
based on population of city from year 2010. Top 30
cities were selected for analysis. Giant component
(Bollob
´
as, 2001) of the Texas road network was taken
to exclude broken links as the network is too com-
plex to manually repair. All analysis was done using
QGIS (QGIS Development Team, 2021) toolbox and
PyQGIS library for custom scripts.
5 IMPACT OF EDGE REMOVAL
IN NETWORKS
In this section, we present details of our empirical
work which show the effect of edge removal within
a network.
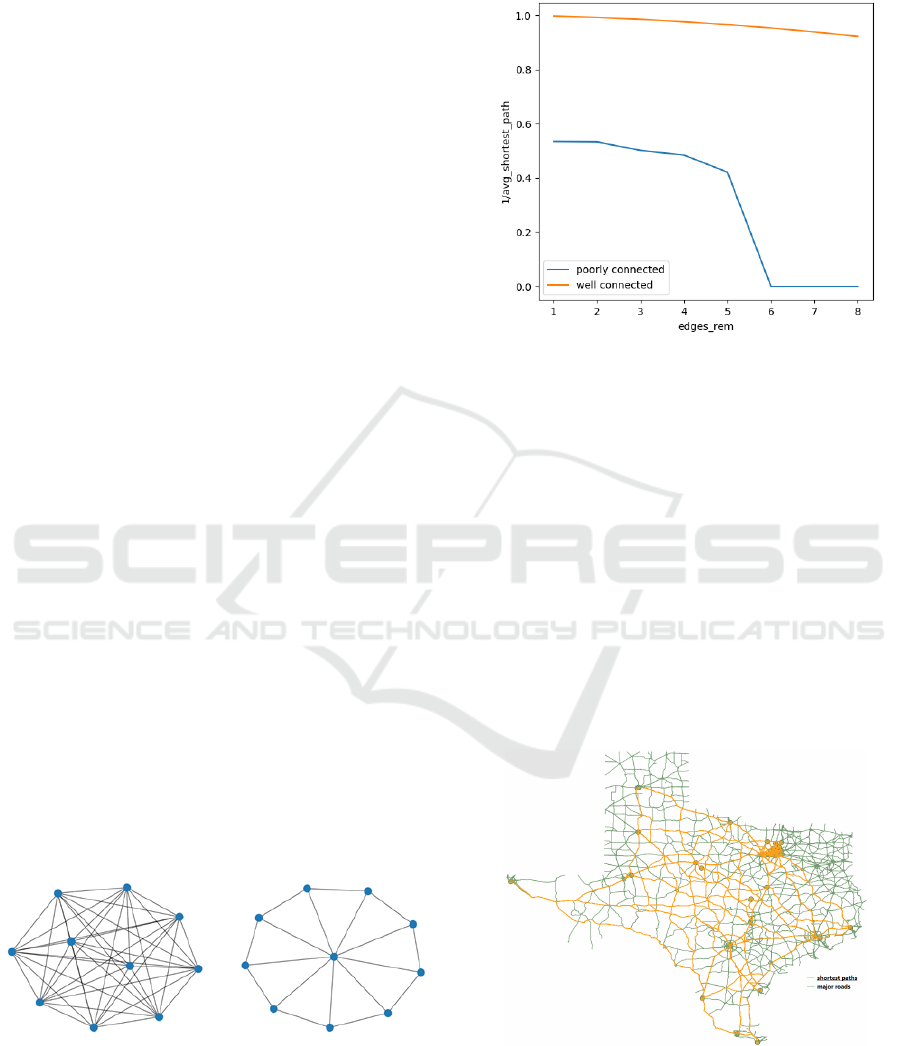
5.1 Experiments with Dummy Graph
Networks
Initial experiments proceed with generating graph
structures with one of them being poorly connected
and the other being well connected. We start remov-
Figure 2: Well connected
graph (WCG).
Figure 3: Poorly con-
nected graph (PCG).
ing edges and calculate the metric “average shortest
path length”. In Figure 4, the blue line represents
the poorly connected graph shown in Figure 3 and
the yellow line represents the well-connected graph
shown in Figure 2. The test was performed with both
graphs having 30 nodes each. We chose to take the
Figure 4: Edges removed vs (avgshortest pathlength)
−
1.
inverse of the metric because the poorly connected
graph gets split into multiple components as we keep
removing nodes there by making the average shortest
path length infinity. We can observe from Figure 4
that this value drastically drops for PCG whereas the
decline is smoother for the WCG.
5.2 Experiments with Real Road
Networks
A separate view was created by removing different
highway systems. The shortest routes for an un-
touched network can be seen in Figure 5. These were
plotted using Dijkstra’s algorithm.
Figure 5: Regular Shortest Paths.
Removing interstate highways created measur-
able change in shortest paths between destinations as
shown below in Figure 6. The extreme left of the state
is cut off from the rest based on the our given network.
Identification of Critical Links within Complex Road Networks using Centrality Principles on Weighted Graphs
545
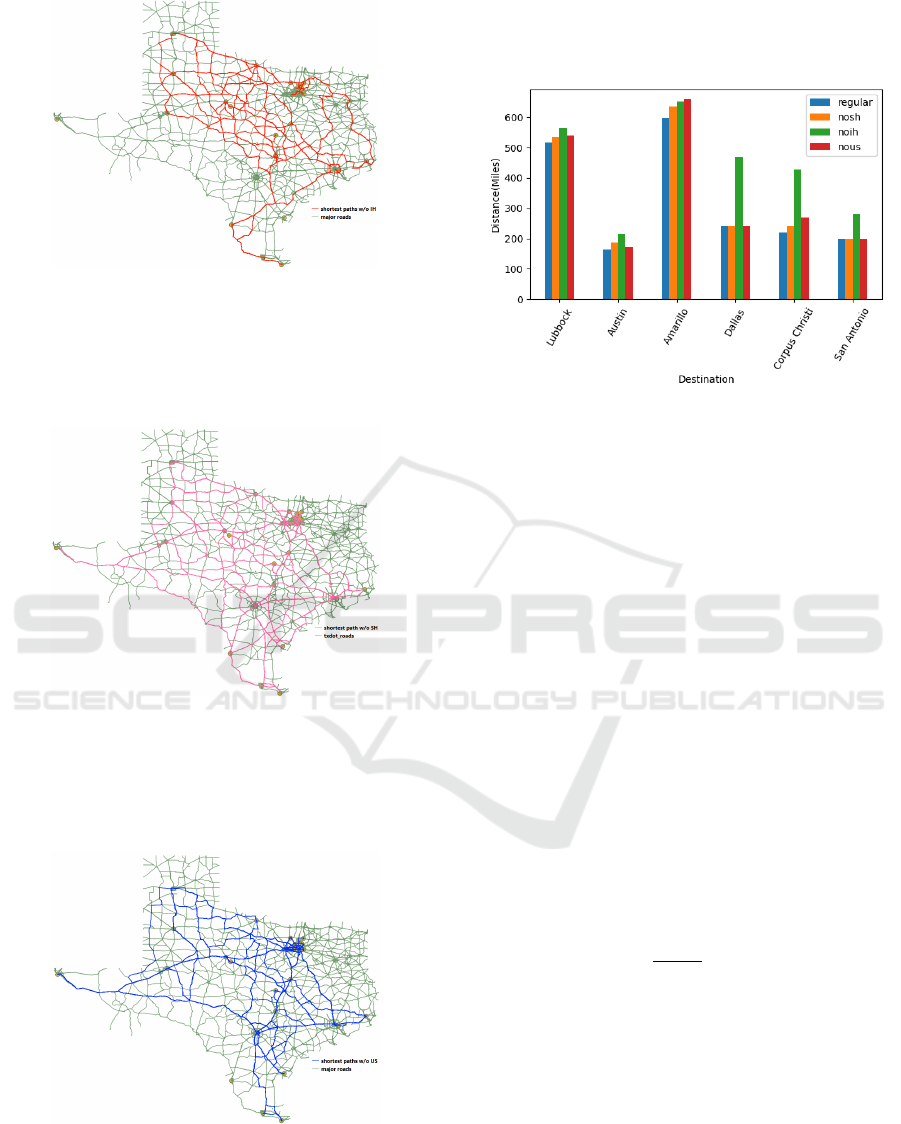
Figure 6: Shortest Paths without Interstate Highways.
Disabling state highways did not have as drastic of
an effect as removing interstate highways as shown in
Figure 7 hinting towards the apparent importance of
Interstate highways.
Figure 7: Shortest Paths without State Highways.
Removal of US highways did not affect the end
to end connectivity much but it did considerably in-
crease the cost of travel between destinations as seen
from Figure 8.
Figure 8: Shortest Paths without US Highways.
Based on the empirical observations from the ex-
periments so far, we considered OD cost matrix as a
basis to study road network deterioration. We gener-
ated tables for all 4 views and selected Houston, Texas
as the origin and 6 other cities as destinations which
are spread across the state to highlight end to end con-
nectivity which is shown in Figure 9 below.
Figure 9: Shortest Path Variation on edge removal.
We can see that for major cities like Corpus Cristi,
San Antonio, and Dallas, Interstate Highways play a
crucial role in fast connectivity. For Austin, alternate
routes almost have the same distance as the original
shortest path which indicates disrupting the direct link
to Austin would not affect overall travel time to that
city.
6 PROPOSED SOLUTION
We propose a procedure to assess criticality of an
edge based on the importance of the nodes it con-
nects using local characteristics of the node and its
connectivity with the remaining network. The nodes
are evaluated using the variable centrality metric and
is also indirectly used to find out critical links. Initial
exploratory analysis with variable closeness central-
ity did not show favorable results, which led us to try
Betweenness, as defined in Equation 3.
C
log,α
B
(u) = log(
C
w
B
(u)
C
B
(u)
) ∗ α + log(C
B
(u)) (3)
Variable Betweeness centrality C
log,α
B
(u) depends
on weighted betweeness centrality C
w
B
(u) which takes
into account the impact of an edge and regular be-
tweeness centrality C
B
(u) which considers connectiv-
ity of a given node with rest of the network.
We begin with calculating centrality metrics for
the weighted and unweighted networks. Then we
compute the variable centralities using Equation 3 by
varying α for different views on the network based on
the node’s individual and global impact.
The nodes are ranked based on C
log,α
B
(u), and the
ICSOFT 2021 - 16th International Conference on Software Technologies
546
top 900 are selected. We combine the different short-
est path views as shown in section 5.2 and a spatial
join is performed to check the percentage of nodes
that lie on these edges in shortest paths between the
cities. (Br
¨
ohl and Lehnertz, 2019) showcases the rela-
tionship between node-edge importance based on the
centrality metrics. Their study shows that around 60%
of the critical nodes ranked using betweenness cen-
trality lie on the network’s shortest paths. Inspired by
this approach, we choose the shortest paths to validate
our critical nodes and also extract critical edges based
on this approach. Attributes like path length, average
daily traffic volume, maximum operating capacity are
used as edge weights to calculate centrality metrics.
7 RESULTS
Not all edges within a network have the same level of
importance. The statistics such as daily traffic volume
and maximum operating capacity suggest that some
roads are more important than others. We observed
how ranking using different centrality metrics would
change edge identification.
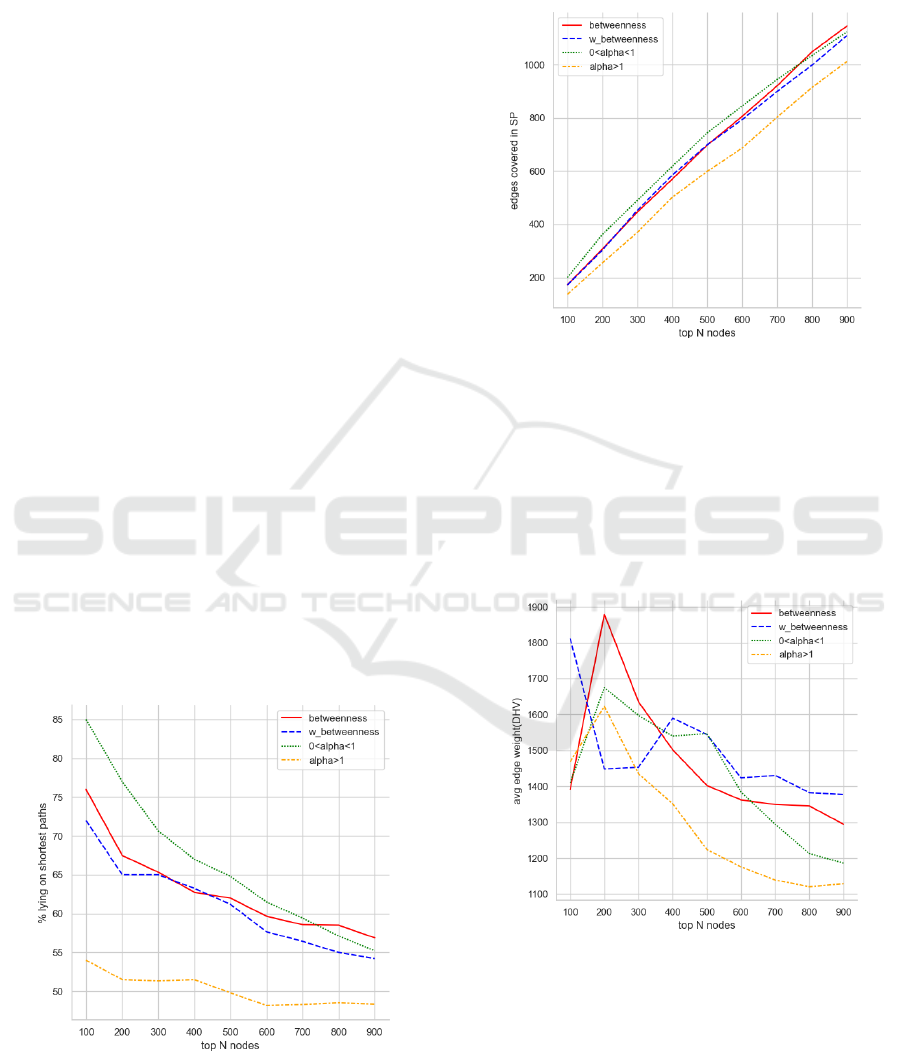
7.1 Complex Graph
Out of 12,118 nodes in our network, around 4,614 lie
on the shortest paths between the selected 30 cities.
The top 900 nodes in intervals of 100, are selected
based on the centrality metrics. In each value range,
we check the percentage of nodes lying on the short-
est paths, which are shown in Figure 10. Between-
Figure 10: Plot showing percentage of nodes lying on
Shortest Paths with respect to top 900 Nodes.
ness gives a higher rank to nodes with better local
connectivity and the maximum number of shortest
paths passing through them irrespective of edge im-
portance. Variable Centralities (α > 1, α < 1) show
a more realistic output considering the entire network
while evaluating the node.
Figure 11: Edges covered when certain number of nodes are
selected.
A plot to show edge coverage as ranking range
(top 100 - 900 nodes) was increased is shown in Fig-
ure 11. From this plot, we can observe that the met-
ric with a steeper line covers greater edges within the
shortest paths. Increasing α makes variable centrality
very selective about the nodes it chooses. This leads
to the solution missing out on some edges with rea-
sonable properties (as seen from Figure 12).
Figure 12: Average accumulated edge weight with respect
to top 900 Nodes.
When no preference is given to weighted central-
ity, we fall back to our original Betweenness metric.
This has less node and edge coverage due to main
ranking factor being local connectivity. Overall, when
0 < α < 1, our metric performs the best, having re-
spectable node, edge coverage, and reasonable aver-
age edge weights.
Identification of Critical Links within Complex Road Networks using Centrality Principles on Weighted Graphs
547

7.2 Simplified Graph
The simplified graph has 15,309 nodes and 16,662
edges. There are no multiple edges between any two
pairs of nodes in this graph. We could not join the
weights from the HPMS dataset to this graph for a
similar metric analysis. Hence, we focus only on the
topology and how it affected our results.
6,762 nodes lie on the shortest paths, and there ex-
ist 7,281 edges that belong to the shortest path among
the 30 cities. From Figure 13, we can see that it is
consistent with the definition of betweenness. All of
Figure 13: Percentage of nodes lying on Shortest Paths with
respect to top 900 Nodes.
the top 200 nodes ranked by betweenness lie on the
shortest paths. Similarly, if we look at Figure 14, the
number of edges covered increases almost linearly as
the range of nodes increases.
Figure 14: Edges covered in Shortest Paths with respect to
top 900 Nodes.
Comparing the results of this graph with those in
Section 7.1, we can see the effect that the topology
has on the centrality and its subsequent effect on edge
importance.
8 CONCLUSIONS
Identifying critical links within road networks is ex-
tremely important for transportation and planning.
Our research has shown the impact of disabling ma-
jor highway links on inter-city travels within a State.
We also showcased a method to rank critical nodes
based on variable centrality and extract respective
edges originating or terminating on them under the
assumption that edge criticality is directly dependent
on node criticality. Below we list other insights from
our research and the future direction.
Topology has had a considerable influence on the
experiment results. The Complex graph had many
illegal values for the variable centrality metric due
to topological errors and disconnected components in
several places. This made our approach very sensitive
towards even the smallest error. In future research,
we aim to experiment using more real-world road net-
works and develop ways to handle these errors. Our
approach currently works by considering the network
as a single mode network (Opsahl et al., 2010). We
would like to extend our research by viewing it as a
two mode network and testing variable centrality on
it.
Inferring edge centrality in a complex network
from node centrality is a challenging problem. The
prevalent edge ranking algorithms need significant
improvement to predict the shortest path links when
the network is complex. Variable centrality ranking
often (incorrectly) better ranks nodes not lying on
the shortest paths. We can also infer that there exist
other shortest paths with similar weighted distances
but a different route within the network. Our future
research would improve the variable centrality met-
ric by considering additional graph properties cover-
ing the entire network. Our procedure used a metric
similar to recall (Van Rijsbergen, 2004) for evaluat-
ing edge ranking algorithms that assess the number of
correctly guessed links on the shortest path. Another
assessment of interest would be precision (Van Rijs-
bergen, 2004) like metric, which would quantify the
number of irrelevant links ranked higher than correct
links. We are also interested in theoretically inves-
tigating the limitations of the existing ranking algo-
rithms since they rely on very myopic information
about the graph. We also would like to explore flow
analysis within traffic networks and combine it with
variable centrality to validate the results. Measuring
traffic flow through extracted critical edges can be a
good metric to determine criticality of those links.
ICSOFT 2021 - 16th International Conference on Software Technologies
548

ACKNOWLEDGMENT
This work is funded by Acquisition of an Advanced
Traffic Management Systems for Cyber and Physical
Security Research, UH High Priority Area Research
Equipment Award, University of Houston, U.S.A.
REFERENCES
Almotahari, A. and Yazici, A. (2020). Practice friendly
metric for identification of critical links in road
networks. Transportation Research Record, page
0361198120925475.
Bhatia, U., Kumar, D., Kodra, E., and Ganguly, A. R.
(2015). Network science based quantification of re-
silience demonstrated on the indian railways network.
PloS one, 10(11):e0141890.
Bollob
´
as, B. (2001). The evolution of random graphs—the
giant component. In Random graphs, volume 184,
pages 130–59. Cambridge university press Cam-
bridge.
Br
¨
ohl, T. and Lehnertz, K. (2019). Centrality-based iden-
tification of important edges in complex networks.
Chaos: An Interdisciplinary Journal of Nonlinear Sci-
ence, 29(3):033115.
Bureau, U. C. (2020). Tiger/line shapefiles.
ESRI, U. and PaperdJuly, W. (1998). Esri shapefile techni-
cal description. Comput. Stat, 16:370–371.
Furno, A., El Faouzi, N.-E., Sharma, R., Cammarota, V.,
and Zimeo, E. (2018). A graph-based framework
for real-time vulnerability assessment of road net-
works. In 2018 IEEE International Conference on
Smart Computing (SMARTCOMP), pages 234–241.
IEEE.
Gauthier, P., Furno, A., and El Faouzi, N.-E. (2018). Road
network resilience: how to identify critical links sub-
ject to day-to-day disruptions. Transportation re-
search record, 2672(1):54–65.
Henning, S., Biemelt, P., Abdelgawad, K., Gausemeier,
S., Evers, H. H., and Tr
¨
achtler, A. (2017). Method-
ology for determining critical locations in road net-
works based on graph theory. IFAC-PapersOnLine,
50(1):7487–7492.
Herrera, M., Abraham, E., and Stoianov, I. (2016). A
graph-theoretic framework for assessing the resilience
of sectorised water distribution networks. Water Re-
sources Management, 30(5):1685–1699.
Karagyozov, K., Razmov, T., Todorova, M., Varadinova, J.,
and Dzhaleva-Chonkova, A. (2012). Impact of nat-
ural disasters on transport systems–case studies from
bulgaria. Report from the International Panel of the
WEATHER project funded by the European Commis-
sion’s 7th framework programme. Sofia.
Li, F., Jia, H., Luo, Q., Li, Y., and Yang, L. (2020). Identi-
fication of critical links in a large-scale road network
considering the traffic flow betweenness index. Plos
one, 15(4):e0227474.
Mattsson, L.-G. and Jenelius, E. (2015). Vulnerability and
resilience of transport systems–a discussion of recent
research. Transportation Research Part A: Policy and
Practice, 81:16–34.
Opsahl, T., Agneessens, F., and Skvoretz, J. (2010). Node
centrality in weighted networks: Generalizing degree
and shortest paths. Social networks, 32(3):245–251.
Passos, R. S. and Cardoso, D. O. (2020). Extrema anal-
ysis of node centrality in weighted networks. arXiv
preprint arXiv:2011.00429.
Portal, T. O. D. (2020). Texas cities.
QGIS Development Team (2021). QGIS Geographic Infor-
mation System. QGIS Association.
Singh, P. S., Lyngdoh, R. B., Chutia, D., Saikhom, V.,
Kashyap, B., and Sudhakar, S. (2015). Dynamic short-
est route finder using pgrouting for emergency man-
agement. Applied Geomatics, 7(4):255–262.
Survey, U. G. (2014). National atlas of the united states.
TxDOT (2019).
Van Rijsbergen, C. J. (2004). The geometry of information
retrieval. Cambridge University Press.
Identification of Critical Links within Complex Road Networks using Centrality Principles on Weighted Graphs
549
