
Invasive Measurements Can Provide an Objective Ceiling for
Non-invasive Machine Learning Predictions
Christopher W. Bartlett
1 a
, Jamie Bossenbroek
2
, Yukie Ueyama
1
, Patricia E. Mccallinhart
1
,
Aaron J. Trask
1 b
and William C. Ray
1 c
1
The Abigail Wexner Research Institute at Nationwide Children’s Hospital, Columbus, Ohio, U.S.A.
2
Department of Computer Science and Engineering, Ohio State University College of Engineering, Columbus, Ohio, U.S.A.
Keywords:
Machine Learning, Health, Invasive, Non-invasive, Model, Overfitting.
Abstract:
Early stopping is an extremely common tool to minimize overfitting, which would otherwise be a cause of
poor generalization of the model to novel data. However, early stopping is a heuristic that, while effective,
primarily relies on ad hoc parameters and metrics. Optimizing when to stop remains a challenge. In this paper,
we suggest that for some biomedical applications, a natural dichotomy of invasive/non-invasive measurements
of a biological system can be exploited to provide objective advice on early stopping. We discuss the condi-
tions where invasive measurements of a biological process should provide better predictions than non-invasive
measurements, or at best offer parity. Hence, if data from an invasive measurement is available locally, or from
the literature, that information can be leveraged to know with high certainty whether a model of non-invasive
data is overfitted. We present paired invasive/non-invasive cardiac and coronary artery measurements from
two mouse strains, one of which spontaneously develops type 2 diabetes, posed as a classification problem.
Examination of the various stopping rules shows that generalization is reduced with more training epochs and
commonly applied stopping rules give widely different generalization error estimates. The use of an empiri-
cally derived training ceiling is demonstrated to be helpful as added information to leverage early stopping in
order to reduce overfitting.
1 INTRODUCTION
Despite rapid advances in Machine Learning, solu-
tions to the problem of overfitting remain primarily
ad-hoc. Caught between the horns of a dilemma,
a data scientist usually wishes to maximize the pre-
dictive capability of a model, while avoiding over-
learning the data and losing generality. This challenge
may be faced without adequate information regarding
both what is ”good enough” for model performance,
and what is ”too good” and verging into the realm of
over-fitting. Across machine learning, poor general-
ization is dealt with by constraining the model fitting
to favor simpler models, a process known as regular-
ization. Some methods penalize the parameters di-
rectly while other methods penalize over-fitting im-
plicitly, such as randomly shutting down nodes while
training a neural network, known as dropout.
a
https://orcid.org/0000-0001-7837-6348
b
https://orcid.org/0000-0003-2236-0659
c
https://orcid.org/0000-0002-4207-250X
Early stopping is another common regularization
method. Early stopping is appealing because it does
not make assumptions about the informational distri-
bution of the model. It assumes only that the early
model learns general features of the training data, and
that it increasingly learns specific features of the data
as additional training epochs are conducted. The sim-
plest solution is to train the network for many epochs,
saving model weights at each epoch, and then to pick
the epoch with the lowest validation error (and there-
fore the least generalization error). The goal of early
stopping is to stop at the ideal epoch without the cost
of generating the entire error validation curve. How-
ever, there currently does not appear to be a general
solution for predicting ideal early stopping points.
For some specific applications, such as medical
imaging, we propose an empirical bound that can
effectively be considered a hard ceiling on the best
possible performance a deep neural network (DNN)
could attain, in effect allowing us to know what is
”too good” and therefore verging into the realm of
Bartlett, C., Bossenbroek, J., Ueyama, Y., Mccallinhart, P., Trask, A. and Ray, W.
Invasive Measurements Can Provide an Objective Ceiling for Non-invasive Machine Learning Predictions.
DOI: 10.5220/0010582000730080
In Proceedings of the 18th International Conference on Signal Processing and Multimedia Applications (SIGMAP 2021), pages 73-80
ISBN: 978-989-758-525-8
Copyright
c
2021 by SCITEPRESS – Science and Technology Publications, Lda. All rights reserved
73

Figure 1: Transthoracic doppler echocardiography (TTDE) data are acquired as a video, assembled into an image, each
vertical slice of which is a greyscale histogram of the doppler blood-flow velocities at that timepoint. Many sources of noise
are layered onto the doppler signal, so there is no internal reference to inform machine learning regarding the true information
content. In this typical recording of 18 heart-beats, the data recorded for the first 10 beats represent physiologically realistic
flow patterns, while the 11th through 16th beats display corrupted data due to movement of the transducer relative to the vessel
being monitored. Electrocardiogram and respiratory recordings underlie the TTDE signal and assist in indexing the heart beat
and identifying when predictable physiological phenomena such as breathing have occluded the TTDE data.
over-fitting. Such a ceiling offers guidance on when
continued training is not advantageous, albeit under
certain regularity conditions we will discuss below.
For biomedical problems, the availability of in-
vasive measurements may provide insight into the
information available in non-invasive measurements.
We propose the following postulate about informa-
tion content for machine learning as the premise of
our contribution. A priori, the information in a non-
invasive, surface-measured correlate of some underly-
ing biophysical phenomenon cannot exceed the infor-
mation content of an invasive measurement of the un-
derlying phenomenon itself. Not all variation is useful
for prediction, and the predictive power of a system
is limited by both the noise in the measurement sys-
tem, the latent signal being measured, and any am-
biguity/noise in the classification system for the de-
sired output. We presume the following logic. To the
extent that invasive measurements relate to the same
or a highly correlated underlying feature as a con-
gruent non-invasive measurement, the invasive mea-
surement should offer the better attainable predictive
power. Therefore, when training a DNN on data from
a non-invasive measure, we know that going beyond
the predictive ceiling bounded by the invasive mea-
sure’s performance is a clear indication of overtrain-
ing and poor generalization.
1.1 Defining Quantitative Goals for
Machine Learning
The concept of early stopping is often discussed in
the DNN literature as a type of convergence crite-
ria. When the loss in the validation dataset levels
off across training epochs, the DNN has learned the
generalizable aspects of the data. Continuing to train
will only cause memorization effects, where aspects
of the training data become more emphasized to the
detriment of generalization. In practice, the situation
is more complex. Validation loss curves by epoch are
not guaranteed to be smooth and often are not. One
might stop at a local minimum. Any convergence cri-
teria formed through a simple heuristic may under-
perform. To train for more epochs offers the chance
to see if the loss function has a lower local (or hope-
fully the global) minimum but can be costly and time-
consuming. Additionally, to be fully certain that the
validation loss curve is accurate requires independent
test data that has not been seen by the DNN clas-
sifier in training. Certainly, in biomedical applica-
tions, such hold-out data can be limited and poten-
tially costly, such as when studying rare/uncommon
disease populations. The balance of finding empirical
guidance on when to stop training a DNN versus how
much test data is available is not quantitatively de-
fined in the literature and remains an unsolved prob-
lem. Early stopping is the best-known heuristic and
many important attempts to formalize the concept
have been put forward. For example, Prechelt de-
fines a family of metrics (Prechelt, 1998), each of
which could be used in an early stopping rule. Both
dataset sizes and computational power have grown
exponentially since then so the empirical evaluation
of the best metric may be different today. Addition-
ally, several attempts to formalize both metrics and
early stopping algorithms have appeared in the lit-
erature for specific applications, which may perform
well in our setting (Deng and Kwok, 2017; Prechelt,
1998). In this study, we offer a different point of
view of the early stopping problem, borne from the
authors’ experience with experimental systems: Inva-
sive measurements in a biological system could of-
fer the best attainable measures of the system’s intrin-
sics while non-invasive measurements are more distal,
and can at best equal the predictive power of DNN’s
trained on invasive measurements. We present this as
a form of outside knowledge to inform our early stop-
ping rules. Having classifiers trained on invasive mea-
surements as a quantitative benchmark provides an
empirical ceiling for training non-invasive measure-
ments. This assumes that invasive measurements of
reasonable quality are, or have been, available for ma-
SIGMAP 2021 - 18th International Conference on Signal Processing and Multimedia Applications
74
chine learning with appropriately vetted model per-
formance. In what follows, we analyze both invasive
and non-invasive measurements on the same animals
in order to predict disease status. However in most re-
search contexts, data from invasive measurement ma-
chine learning could be taken from the literature or
developed off publicly available datasets.
1.2 Related Work
The concept of early stopping predates the current
DNN literature and early attempts to define useful
metrics for evaluating potential stopping points were
defined prior to the recent rapid growth of available
data (e.g. Prechelt’s work in 1998 (Prechelt, 1998)).
Interestingly, the general ideas behind those metrics
are still part of common pratice today and are avail-
able in widely used packages for machine learning
such as Tensorfow (Abadi et al., 2016). Early stop-
ping uses training and validation datasets to assess
changes in model generalization. When the validation
error goes up, productive training is stopped. The ex-
act heuristic for what constitutes validation error lev-
eling off (or increasing) varys. The number of epochs
of stalled progress or increases in error to continue
training before early stopping is controlled by a pa-
rameter often called patience. The patience metric
approach is not computationally demanding, which is
a strength of the approach (Abadi et al., 2016; Ying,
2019). In practice, the DNN is trained and for any
epoch that the validation error is at a value lower than
the lowest previously observed, those model param-
eters are saved (Goodfellow et al., 2016). Once the
generalization gap–the gap between the training error
and validation error–increases to the point that further
training seems unfruitful to continue, then the model
parameters associated with the lowest validation error
are chosen as the final classifier. Typical values for
patience range from 3-6 epochs.
Many variations on the basic theme of early stop-
ping continue to be developed. Much of the litera-
ture offers heuristics that are elucidated in a context-
specific way. In breast cancer research, a rising trend
in validation loss has been described but not quanti-
tatively defined (Prakash and Visakha, 2020). Over-
fitting in the context of feature selection had an early
stopping algorithm defined to reduce computing time
per cross validation step (Liu et al., 2018). In the con-
text of fuzzy clustering coupled to a neural network,
a patience value of 6 was recommended (Wu and Liu,
2009). In fact, the patience value of 6 arises in other
contexts too, including neural networks for computer
vision (Blanchard et al., 2019; Wu and Liu, 2009),
such as is quite relevant for the present application.
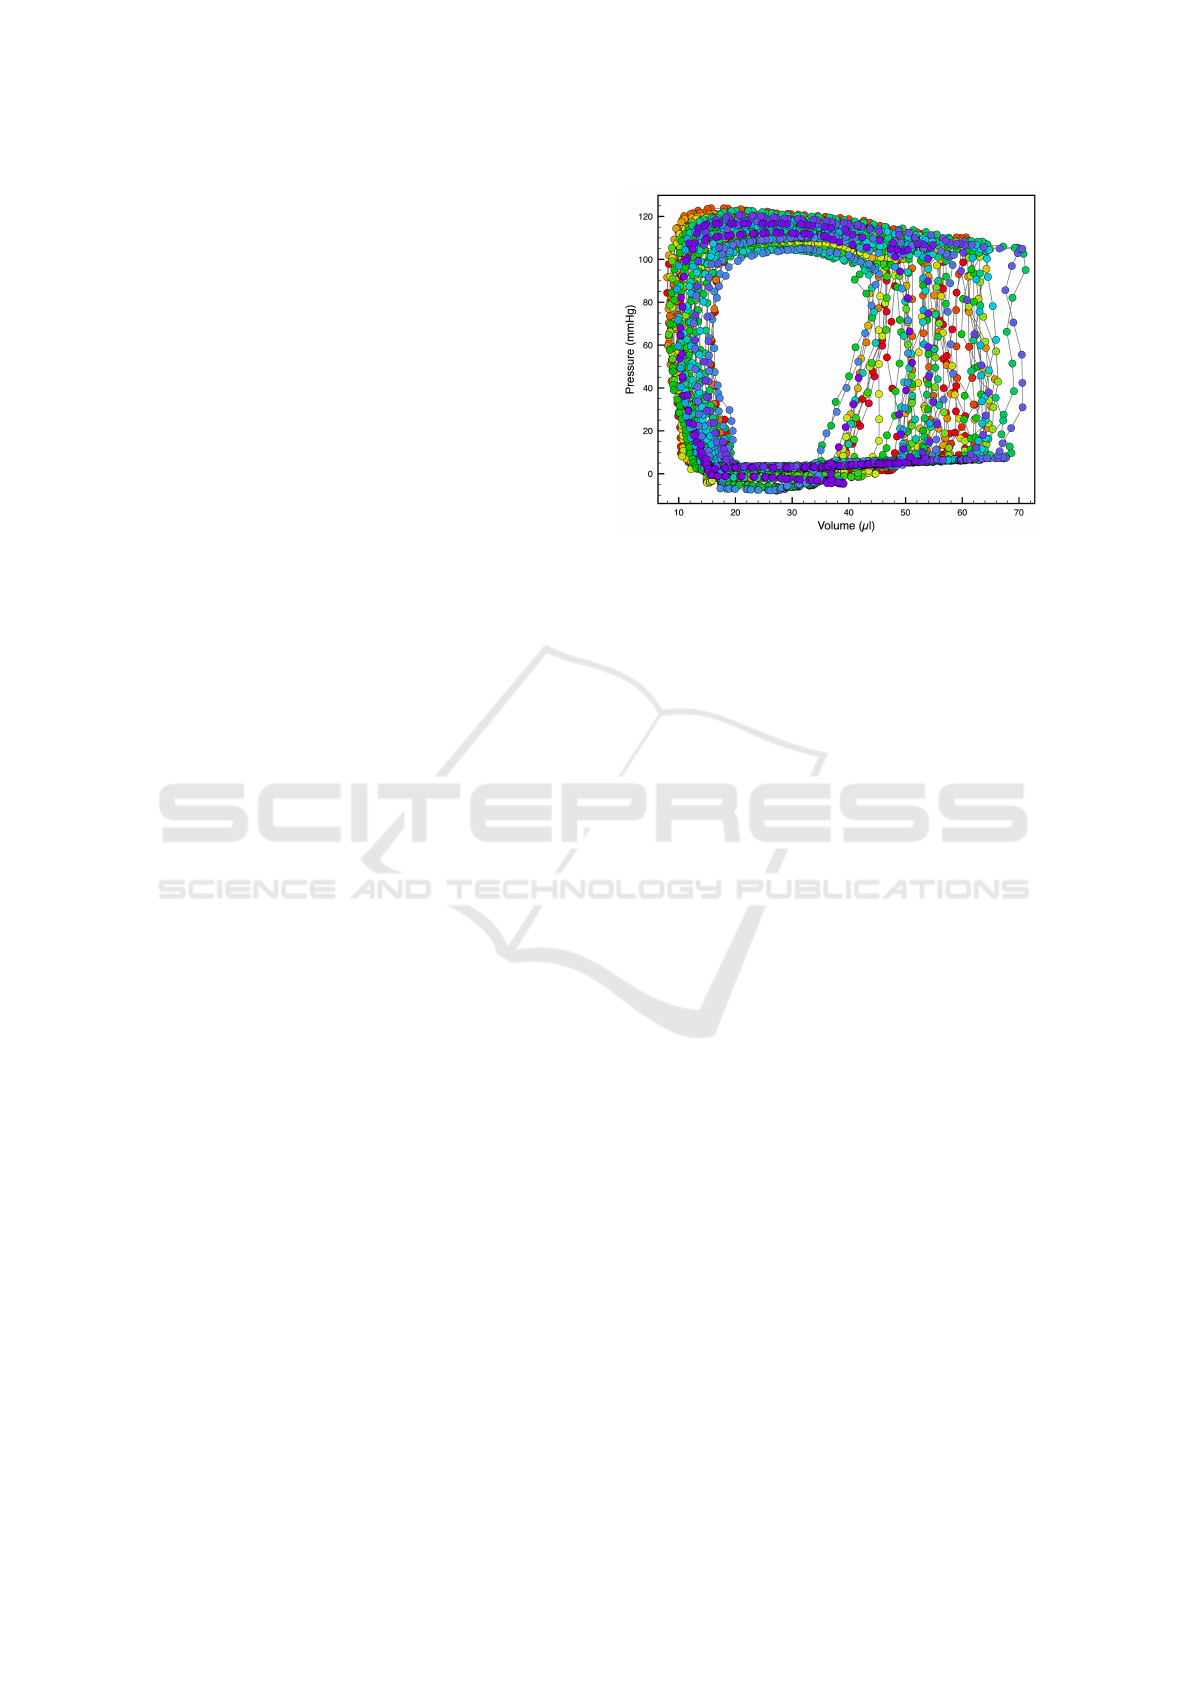
Figure 2: A typical Pressure-Volume “loop” (PV-loop)
dataset. PV-loops are created by measuring paired values
of pressure and volume in the left ventricle at 1000Hz. The
“loop” shape seen in PV-loop data can be understood in
terms of the properties of a heart beat. Starting from the
lower left, the low-pressure filling, followed by a near-fixed-
volume increase in pressure, followed by a fixed pressure
decrease in volume, and then a relaxation to baseline pres-
sure to fill again, completes a single beat of the heart. Mea-
sured PV values over 46 heart beats are colored temporally
in the figure on a rainbow gradient from Red (initial beat)
to Indigo (last beat). PV-loops are not identical beat-to-beat
due to real physiological differences in the beat-to-beat fill-
ing and contraction of the heart.
Metrics for early stopping have been derived that of-
fer quantitative guidance. One example we adopt here
comes from Deng and Kwok (Deng and Kwok, 2017),
that tunes what is considered an upward trend in the
validation loss at each iteration.
2 THE DEMONSTRATION
PROBLEM
For our demonstration, we focus on coronary mi-
crovascular disease (CMD). CMD is notoriously diffi-
cult to diagnose non-invasively, and current methods
of assessing CMD utilize only the peak velocity of
the coronary flow pattern. TTDE data are typically
acquired as a video of the time-varying doppler sig-
nal, and a summary image from a typical TTDE ex-
periment (video fused into a single image in a fash-
ion analogous to a moving-slit aperture) is shown in
Figure 1. There are currently no non-invasive meth-
ods that incorporate the coronary flow pattern over a
complete cardiac cycle to definitively assess and pre-
dict the development of CMD. Coronary blood flow
(CBF) reflects the summation of flow in the coronary
microcirculation, and we have begun to harness the
Invasive Measurements Can Provide an Objective Ceiling for Non-invasive Machine Learning Predictions
75

uniqueness of the CBF pattern under varying flow and
disease conditions (e.g. type 2 diabetes) to determine
whether it might harbor novel clues leading to the
early detection of CMD. Previous studies indicate an
early onset of CMD in both type 2 diabetes mellitus
(T2DM) and metabolic syndrome (MetS) that occurs
prior to the onset of macrovascular complications (16
wks in T2DM db/db mice). This results in blood flow
impairments and alterations in coronary resistance
microvessel (CRM) structure, function, and biome-
chanics (Anghelescu et al., 2015; Gooch and Trask,
2015; Katz et al., 2011; Labazi and Trask, 2017; Lee
et al., 2011a; Lee et al., 2011b; Park et al., 2008; Park
et al., 2011; Trask et al., 2012a; Trask et al., 2012b).
Collectively, these data strongly suggest an early on-
set of CMD, and therefore sub-clinical heart disease,
in T2DM and MetS (Labazi and Trask, 2017). Im-
portantly, Sunyecz et al. uncovered innovative cor-
relations between CRM structure/biomechanics and
newly-defined features of the coronary flow pattern
(Sunyecz et al., 2018), some of which were unique to
normal or diabetic mice.
We have initially utilized the CBF features from
Sunyecz et al., in the presence and absence of other
factors such as cardiac function, to develop a mathe-
matical model that defines 6 simple factors that con-
tain predictive information on normal vs. diabetic
coronary flow patterns. Utilizing a multidisciplinary
approach, we sought to test whether the elements
that influence coronary flow patterning would be use-
ful in the direct assessment of CMD using computa-
tional modeling. We tested this utilizing non-invasive
Transthoracic Doppler echocardiography of coronary
flow combined with simultaneous invasive cardiac
pressure-volume loop (PV-loop) assessment of car-
diac function.
In contrast with TTDE data which are acquired
as a video using an externally-applied transducer,
pressure-volume loop data are acquired as paired
pressure-volume measurements using a probe in-
serted invasively into the heart. PV-loop data provide
a completely different variety of data about cardiac
function and the state of the cardiac microvascula-
ture, from that obtainable through TTDE. A typical
PV-loop recording is shown in Figure 2.
3 DATA SOURCE
Two strains of mice that were 16 weeks old were
housed under a 12-hr light/dark cycle at 22
◦
C and
60% humidity. The two strains were normal control
mice (n = 35) and type 2 diabetic (DB) mice (n = 42)
(Jackson Laboratories). Mice were fed standard lab-
oratory mice chow and allowed access to water ad li-
bitum. This study was conducted in accordance with
the NIH Guidelines and was approved by the Institu-
tional Animal Care and Use Committee at the Abigail
Wexner Research Institute at Nationwide Children’s
Hospital.
3.1 TTDE Data (Non-invasive)
Transthoracic Doppler echocardiography (TTDE)
video files of left main coronary blood flow with ≈ 20
distinct cardiac cycles each were acquired from both
groups of mice at baseline (1% isoflurane anesthesia)
and hyperemic (increased blood flow measured at 3%
isoflurane anesthesia) conditions following the proto-
col described by the Trask lab (Husarek et al., 2016;
Katz et al., 2011; Sunyecz et al., 2018). These videos
were exported as .avi files from the Vevo2100 soft-
ware and analyzed using an in-house Python script for
data pre-processing. A summary image from a typical
TTDE experiment is shown in Figure 1.
3.2 PV-loop Data (Invasive)
Invasive hemodynamic measures of cardiac func-
tion were terminally performed immediately follow-
ing echocardiographic analysis as described by Trask
et al. (Trask et al., 2010). During the terminal
experiment, mice continued to be anesthetized with
isoflurane (2%) in 100% oxygen followed by tra-
cheotomy and ventilated with a positive-pressure ven-
tilator (Model SAR-830P, CWE, Inc.). A 1.2F com-
bined conductance catheter-micromanometer (Mod-
els FTH-1212B-3518 and FTH-1212B-4018, Tran-
sonic SciSense, London, ON, Canada) connected to a
pressure-conductance unit (Transonic SciSense, Lon-
don, ON, Canada) and data acquisition system (Pow-
erLab, AD Instruments, Colorado Springs, CO) was
inserted into the right carotid artery and advanced
past the aortic valve into the left ventricle. Pressure-
volume loops were recorded off the ventilator for
≤ 10 seconds at baseline and during reduced preload
by gently occluding the inferior vena cava with a cot-
ton swab. We used approximately 30 measures ob-
tained from invasive PV loop measurements for our
study. A typical PV-loop recording is shown in Fig-
ure 2.
3.3 Post-processed Data
Each TTDE image contained a varying number of
heartbeats (with an average of 22.63 ±7.13 heartbeats
per image) with low noise that were suitable for anal-
ysis. The number of heartbeats for analysis per group
SIGMAP 2021 - 18th International Conference on Signal Processing and Multimedia Applications
76

was 2810 for control and 3021 for DB. TTDE data
were pre-processed as described by Sunyecz et al.
(Sunyecz et al., 2018).
4 ANALYSIS FRAMEWORK
Our framework consists of deep learning to predict
mouse strain. Each mouse had both a non-invasive
cardiac ECHO and paired invasive catheterization
that obtained left ventricular pressure-volume (PV)
loops. The ECHO data are non-invasive doppler-
sonographic measurements of coronary blood flow,
while the PV-loops are direct invasive measurements
of the pressure and volume in the heart. The volumet-
ric change of the heart, and the pressure produced ulti-
mately influence the coronary blood flow, so the flow
being measured by the non-invasive ECHO method
is highly correlated to these invasive measures. The
two conditions for the DNN to classify are normal
control versus DB mouse strains. Diabetes changes
cardiovascular structure, function, and stiffness, di-
rectly influencing the cardiac pressure-volume rela-
tionship and coronary blood flow. For both ECHO
and PV-loop data, every heartbeat provides an itera-
tion of cardiac data. The images from each mouse
ECHO contain many heartbeats where each provides
information for training the DNN. Labels for classi-
fication derive from the type of mouse. To infer the
performance ceiling we first trained a DNN to clas-
sify control versus DB mice using the invasive PV-
loop data. It is important to note that while this might
appear to simply push the problem of determining a
training ceiling recursively off onto a different ML
training ceiling problem, the invasive PV-loop data is
much more amenable to classification by simple re-
gression. Therefore, training the DNN for the PV-
loop data was compared to logistic regression to show
that the DNN performance is approximately optimal
given the highly informative nature of invasive mea-
surements. In many biological systems, the literature
contains well-studied quantifications of the informa-
tion content available for various invasive measures,
and we suggest that these may be used as ceilings
for non-invasive work on those systems in lieu of per-
forming an actual paired invasive study. Performance
from training a DNN using the non-invasive data to
classify control versus DB mice was compared to the
invasive measurement performance ceiling to assess
if overtraining has occurred. We go on to show that
using both PV-loop and ECHO data in a DNN does
not improve classification, indicating that no new ad-
ditional information relevant to the classification is
offered by the non-invasive measurement. Addition-
ally, we tested several early stopping metrics from the
literature to assess how they perform in this setting
and if they can be misleading, relative to the empirical
ceiling. In all analyses, data were split 80% training,
16% validation (used for testing generalization error
each epoch), and 4% for the final out-of-sample test
dataset. No outlier removal was applied as the ex-
ploratory analysis did not indicate any clear cases of
outliers. The data were approximately balanced (see
above), which is consistent with our experimental ani-
mal design. Our DNN implementation was in Tensor-
Flow (Abadi et al., 2016) and logistic regression was
performed in scikit-learn (Pedregosa et al., 2011).
5 EXPERIMENTAL
5.1 Establishing a Ceiling using
Invasive Data
Invasive PV-loop data were used to classify mouse
strain in a retrospective diagnostic study design.
Heartbeats were randomly sampled across mouse
strain for each batch. No data augmentation was ap-
plied. Batch size was set to 32 and the learning rate
was 0.01 as part of the Adam algorithm (Kingma
and Ba, 2014). The loss function was binary cross-
entropy on a DNN with six hidden layers. Training
was conducted over 2000 epochs and the early stop-
ping procedure using a patience of 6 was applied post-
hoc. Waiting longer in the training than epoch 117
would not improve predictions and final test accuracy
was 0.972. Logistic regression with recursive fea-
ture elimination (RFE) was performed on the PV-loop
dataset. RFE selectively dropped four physiological
parameters from the final model. Logistic regression
of the RFE selected model gave similar prediction ac-
curacy as the DNN (accuracy = 0.971). As expected,
results of the logistic regression indicated a significant
association of the PV-loop physiological parameters
with mouse strain (χ
2
= 7338.1, d f = 15, p < .0001).
As the logistic regression model is less complicated
than the DNN, this result highlights the high infor-
mation content of the PV-loop data, making the less
complicated regression model adequately powered to
have similar predictive accuracy. From this we infer
that training with PV-loop data is essentially optimal
for classification and can therefore be used as a ceiling
to infer early stopping for non-invasive data. Given
the postulate of the study, we assert that 97% is the
ceiling for cardiac-based predictions of mouse strain
in this experimental setting.
Invasive Measurements Can Provide an Objective Ceiling for Non-invasive Machine Learning Predictions
77

Table 1: Summary of DNN training results by stopping rule.
Note that Test Accuracy (subset) refers to hold out data from
animals that were in the training data while Test Accuracy
(novel) refers to data from hold-out animals that had no data
in the training, validation, or test sets.
Test Test
# Accuracy % Accuracy %
epochs (subset) (novel)
GL 54 0.904 0.979
PQ
3
61 0.909 0.975
PQ
6
629 0.895 0.950
Patience
3
93 0.946 0.977
Patience
6
345 0.925 0.925
DK 212 0.946 0.975
5.2 Evaluating the Non-invasive
Transthoracic Doppler
Echocardiogram
For non-invasive TTDE data to classify mouse strain,
the analysis set up was similar to the PV-loop data.
Pre-processed data were classified along 15 physio-
logical parameters, four metrics for variability and
the number of heartbeats per animal. TTDE data ex-
hibits scale variability due to the physical properties
the measurement, therefore, data were normalized to
the grand mean and standard deviation prior to train-
ing. Without normalization, training was inefficient
and inaccurate (shown below). Training was con-
ducted over 2000 epochs and the early stopping pro-
cedures were applied post-hoc.
5.3 Early Stopping
We applied several early stopping guidelines based
on metrics and heuristics from the literature to assess
how each performed in this setting and whether they
could be misleading. Additionally, we used the em-
pirical ceiling (97%) for additional guidance. The pa-
tience parameter is commonly used in the literature
with values of 3 or 6 (Patience
3
and Patience
6
in Ta-
ble 1). We also used the Generalization Loss (GL in
Table 1) metric which is a function of the loss func-
tion value in a given iteration divided by the minimum
loss observed in any previous epoch (Prechelt, 1998).
We chose a value that was 5% of the initial loss. The
Progress Quotient is a function of the Generalization
Loss smoothed over a strip of N previous iterations
(Prechelt, 1998). We chose N to be 3, and 6 (PQ
3
and
PQ
6
in Table 1), to be comparable to our selected pa-
tience values. Lastly we implemented an early stop-
ping procedure from a non-medical context that mod-
ifies the patience parameter dynamically based on the
loss from the latest iteration (Deng and Kwok, 2017).
If the validation loss is smaller than 0.996 of the low-
est observed up to that point, then the patience is in-
creased by 0.3 times the current number of iterations.
Training stops when patience is less than the current
number of iterations (DK in Table 1). Accuracy from
the various early stopping procedures is summarized
in Table 1, and the per-epoch accuracy and loss are
shown in Figure 3.
On the unnormalized data, the best validation ac-
curacy was 0.752 across 2000 training epochs. Given
the disparity with the normalized data, we did not
analyze early-stopping heuristics. This result high-
lights the critical need for pre-processing to reduce
non-biological sources of variation in the biomedical
data for this classification task.
5.3.1 Prediction from Combined PV-loop and
TTDE Data
Merging the PV-loop and TTDE DNNs into a single
network did not improve classification (96.5%) over
PV-loop data alone (97%)–which are the same ac-
curacy within the variability of the design–using the
same early stopping rule as employed in the PV-loop
only analysis. These results indicate that no addi-
tional information useful for the classification task is
present in the non-invasive measurement.
6 DISCUSSION
In this paper, we develop the idea that an objective
ceiling for early stopping using noise-prone, “distant”
measurements, could be derived from more direct
measurements of an underlying process. In this case,
we postulated that an invasive measurement should
provide as much, or more predictive power as a non-
invasive measurement of the same underlying pro-
cess. We used data from animal experiments that
are part of an ongoing project to study early markers
for a type of cardiac disease that affects blood flow.
Cardiac catheterization to determine pressure-volume
loops is an invasive measurement while sonographic
cardiac TTDE is not. The latter is important since
non-invasive measurements are preferred for diagnos-
tics in humans and machine learning on diagnostics in
humans is an important area for biomedical science.
Yet, early stopping for noisy biomedical measure-
ments in real world applications relies on the same
ad hoc procedures as other machine learning applica-
tions. Though biomedical datasets are often expen-
sive to obtain and difficult to effectively work with,
perhaps in one way biomedical data have an advan-
SIGMAP 2021 - 18th International Conference on Signal Processing and Multimedia Applications
78
0 100 200 300 400 500 600
Epochs
0.86
0.88
0.9
0.92
0.94
0.96
0.98
1
Accuracy (%)
0
0.2
0.4
0.6
0.8
1
Loss (%)
GL
PQ
3
Patience
3
DK
Patience
6
PQ
6
Information Ceiling
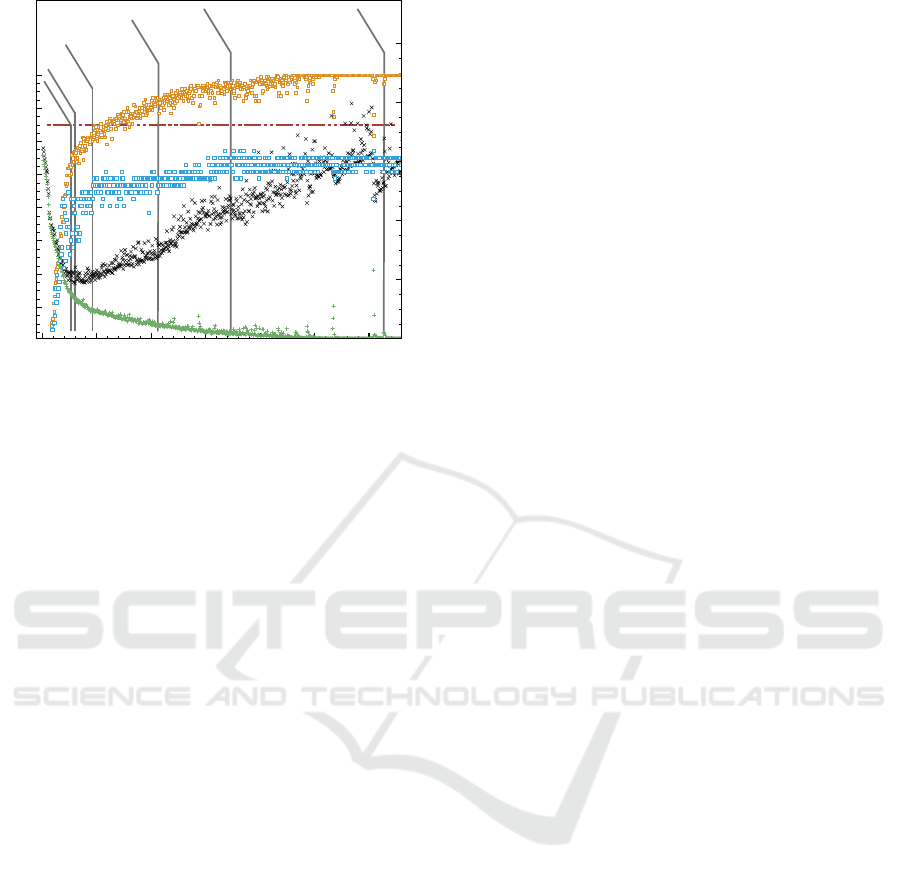
Figure 3: Accuracy (left y-axis) and loss (right y-axis) of
the DNN with the training data (tan circles and green plus,
respectively) and validation data (blue squares and black x,
respectively) by epoch. As expected, the DNN on train-
ing data eventually becomes 100% accurate with a steady
decrease in loss, due to memorization. Validation accu-
racy largely levels off, while validation loss reaches a mini-
mum, and then climbs for the remainder of the 2000 epochs
(data beyond 660 epochs not shown). Each early stopping
rule application (described in the text and Table 1) is indi-
cated at the epoch where the stopping rule was triggered.
The best performance is around epoch 100 for generaliza-
tion error, and the Patience
3
procedure was the closest to
that ideal in this scenario. Training the DNN beyond the
invasively-determined information ceiling at 97% (horizon-
tal brown dashed line) should be impossible without over-
fitting by learning training-data-specific features. Assum-
ing zero information loss in the indirect, non-invasive data,
our information-ceiling method would trigger stopping at
approximately 120 epochs.
tage over naturalistic data from, for example, inter-
net traffic derived information. Biomedical sciences
can perform experiments that clearly delineate di-
rect measurements of an underlying biological pro-
cess from indirect measurements of the same process.
Given the precept guiding this work, it is unlikely
that non-invasive measurements will outperform inva-
sive measurements based in machine learning appli-
cations. Any time accuracy in the non-invasive train-
ing dataset exceeds the invasive performance ceiling,
we can be sure that modeling is overtraining and an
early stopping rule needs to be chosen to find a stop-
ping point with less generalization error.
Notably, stopping based on our criteria of training
until the non-invasive dataset reaches the invasive per-
formance (97%), would result in stopping training in
this experiment at approximately 120 epochs, which
is just past the point (approximately 100 epochs)
when validation loss begins to climb. If one assumes
as a heuristic that some information loss occurs in
the indirect (non-invasive) measurement compared to
the direct (invasive) measurement, a ceiling might be
specified slightly below that determined from the in-
vasive data, resulting in stopping somewhat earlier.
This is near-ideal for this dataset.
Could the objective performance ceiling come
from animals and applied to non-invasive human
data? While this is tempting as a possible general
rule, there are key differences between animals and
humans that preclude strong advice. In our setting,
we note that the animal models of cardiac function
are indeed very similar in important ways to humans
but the measurements offer a few distinct differences.
First, the size of the mouse heart is much smaller. The
ultrasound measurement procedure will have some-
what different noise issues. For example, given the
size of the heart, noise is introduced based on the ori-
entation of the ultrasound probe that is much greater
than would be seen in humans. Second, the animals
are sedated during the sonographic TTDE acquisition,
where humans would not be. Third, in human data it
may be possible to improve classification results be-
yond what is shown here using other clinical variables
(such age, sex, other diagnosed diseases etc.).
We postulate that when multiple approaches are
available to evaluate a system, results from a more di-
rect measurement may be used to define an informa-
tion ceiling for the less direct measurements. In the
bio/life sciences, it is common for there to be many
different ways to measure a phenomenon, ranging
from inexpensive indirect inferential measurements to
expensive direct invasive measurements. We suggest
that the results of the expensive direct invasive mea-
surements, which are frequently available in the lit-
erature, may be used to define informational ceilings
for machine learning on the less expensive, indirect
measurements. Overall, this study is an example that
offers an additional guidance possibility for machine
learning researchers working in biomedical research
or other similar experimental contexts.
ACKNOWLEDGMENTS
We thank the animal care support staff for their time
and effort in maintaining the extensive number of an-
imals used to create the dataset. This work was sup-
ported in part by the High Performance Computing
Facility at the Abigail Wexner Research Institute at
Nationwide Children’s Hospital. This work was sup-
ported by NIH R00 HL116769 (to AJT), NIH R21
EB026518 (to AJT), and The Abigail Wexner Re-
search Institute at Nationwide Children’s Hospital (to
CWB, AJT and WCR).
Invasive Measurements Can Provide an Objective Ceiling for Non-invasive Machine Learning Predictions
79

REFERENCES
Abadi, M., Barham, P., Chen, J., Chen, Z., Davis, A., Dean,
J., Devin, M., Ghemawat, S., Irving, G., Isard, M.,
and et al. (2016). Tensorflow: A system for large-
scale machine learning. In 12th USENIX symposium
on operating and systems design and implementation
(OSDI 16), page 265–283.
Anghelescu, M., Tonniges, J. R., Calomeni, E., Shamhart,
P. E., Agarwal, G., Gooch, K. J., and Trask, A. J.
(2015). Vascular mechanics in decellularized aortas
and coronary resistance microvessels in type 2 dia-
betic db/db mice. Annals of biomedical engineering,
43(11):2760–2770.
Blanchard, N., Kinnison, J., RichardWebster, B., Bashivan,
P., and Scheirer, W. J. (2019). A neurobiological eval-
uation metric for neural network model search. 2019
IEEE/CVF Conference on Computer Vision and Pat-
tern Recognition (CVPR).
Deng, J.-Q. and Kwok, Y.-K. (2017). Large vocabulary au-
tomatic chord estimation with an even chance training
scheme. In ISMIR, page 531–536.
Gooch, K. J. and Trask, A. J. (2015). Tissue-specific vascu-
lar remodeling and stiffness associated with metabolic
diseases.
Goodfellow, I., Bengio, Y., and Courville, A. (2016). Deep
Learning. MIT Press.
Husarek, K. E., Katz, P. S., Trask, A. J., Galantowicz, M. L.,
Cismowski, M. J., and Lucchesi, P. A. (2016). The an-
giotensin receptor blocker losartan reduces coronary
arteriole remodeling in type 2 diabetic mice. Vascular
pharmacology, 76:28–36.
Katz, P. S., Trask, A. J., Souza-Smith, F. M., Hutchin-
son, K. R., Galantowicz, M. L., Lord, K. C., Stew-
art, James A., J., Cismowski, M. J., Varner, K. J., and
Lucchesi, P. A. (2011). Coronary arterioles in type
2 diabetic (db/db) mice undergo a distinct pattern of
remodeling associated with decreased vessel stiffness.
Basic research in cardiology, 106(6):1123–1134.
Kingma, D. P. and Ba, J. (2014). Adam: A method for
stochastic optimization. arXiv.
Labazi, H. and Trask, A. J. (2017). Coronary microvascular
disease as an early culprit in the pathophysiology of
diabetes and metabolic syndrome. Pharmacological
research: the official journal of the Italian Pharmaco-
logical Society, 123:114–121.
Lee, S., Park, Y., Dellsperger, K. C., and Zhang, C. (2011a).
Exercise training improves endothelial function via
adiponectin-dependent and independent pathways in
type 2 diabetic mice. American journal of physiology.
Heart and circulatory physiology, 301(2):H306–14.
Lee, S., Park, Y., and Zhang, C. (2011b). Exercise train-
ing prevents coronary endothelial dysfunction in type
2 diabetic mice. American journal of biomedical sci-
ences, 3(4):241–252.
Liu, K., Song, J., Zhang, W., and Yang, X. (2018). Allevi-
ating over-fitting in attribute reduction: An early stop-
ping strategy. In 2018 International Conference on
Wavelet Analysis and Pattern Recognition (ICWAPR),
page 190–195.
Park, Y., Capobianco, S., Gao, X., Falck, J. R., Dellsperger,
K. C., and Zhang, C. (2008). Role of edhf in type 2
diabetes-induced endothelial dysfunction. American
journal of physiology. Heart and circulatory physiol-
ogy, 295(5):H1982–8.
Park, Y., Yang, J., Zhang, H., Chen, X., and Zhang, C.
(2011). Effect of par2 in regulating tnf-α and nad(p)h
oxidase in coronary arterioles in type 2 diabetic mice.
Basic research in cardiology, 106(1):111–123.
Pedregosa, F., Varoquaux, G., and Gramfort, A. (2011).
Scikit-learn: Machine learning in python. of machine
Learning . . . .
Prakash, S. S. and Visakha, K. (2020). Breast cancer malig-
nancy prediction using deep learning neural networks.
In 2020 Second International Conference on Inventive
Research in Computing Applications (ICIRCA), page
88–92.
Prechelt, L. (1998). Automatic early stopping using cross
validation: quantifying the criteria. Neural networks:
the official journal of the International Neural Net-
work Society, 11(4):761–767.
Sunyecz, I. L., McCallinhart, P. E., Patel, K. U., Mc-
Dermott, M. R., and Trask, A. J. (2018). Defining
coronary flow patterns: Comprehensive automation of
transthoracic doppler coronary blood flow. Scientific
reports, 8(1):17268.
Trask, A. J., Delbin, M. A., Katz, P. S., Zanesco, A., and
Lucchesi, P. A. (2012a). Differential coronary resis-
tance microvessel remodeling between type 1 and type
2 diabetic mice: impact of exercise training. Vascular
pharmacology, 57(5-6):187–193.
Trask, A. J., Groban, L., Westwood, B. M., Varagic, J.,
Ganten, D., Gallagher, P. E., Chappell, M. C., and
Ferrario, C. M. (2010). Inhibition of angiotensin-
converting enzyme 2 exacerbates cardiac hypertrophy
and fibrosis in ren-2 hypertensive rats. American jour-
nal of hypertension, 23(6):687–693.
Trask, A. J., Katz, P. S., Kelly, A. P., Galantowicz, M. L.,
Cismowski, M. J., West, T. A., Neeb, Z. P., Berwick,
Z. C., Goodwill, A. G., Alloosh, M., and et al.
(2012b). Dynamic micro- and macrovascular remod-
eling in coronary circulation of obese ossabaw pigs
with metabolic syndrome. Journal of applied physiol-
ogy, 113(7):1128–1140.
Wu, X. and Liu, J. (2009). A new early stopping algorithm
for improving neural network generalization. In 2009
Second International Conference on Intelligent Com-
putation Technology and Automation, volume 1, page
15–18.
Ying, X. (2019). An overview of overfitting and its
solutions. Journal of physics. Conference series,
1168(2):022022.
SIGMAP 2021 - 18th International Conference on Signal Processing and Multimedia Applications
80
