
GRANEF: Utilization of a Graph Database for Network Forensics
Milan Cermak
a
and Denisa Sramkova
b
Institute of Computer Science, Masaryk University, Brno, Czech Republic
Keywords:
Network Forensics, Graph Database, Dgraph, Zeek, Association-based Analysis.
Abstract:
Understanding the information in captured network traffic, extracting the necessary data, and performing inci-
dent investigations are principal tasks of network forensics. The analysis of such data is typically performed by
tools allowing manual browsing, filtering, and aggregation or tools based on statistical analyses and visualiza-
tions facilitating data comprehension. However, the human brain is used to perceiving the data in associations,
which these tools can provide only in a limited form. We introduce a GRANEF toolkit that demonstrates
a new approach to exploratory network data analysis based on associations stored in a graph database. In this
article, we describe data transformation principles, utilization of a scalable graph database, and data analysis
techniques. We then discuss and evaluate our proposed approach using a realistic dataset. Although we are at
the beginning of our research, the current results show the great potential of association-based analysis.
1 INTRODUCTION
Network forensics covers a variety of techniques used
for cyber-attack investigation, information gathering,
and legal evidence using identification, capture, and
analysis of network traffic (Khan et al., 2016). The
crucial part is the analysis of collected data (e.g.,
packet data or IP flows) to filter and extract the re-
quired information and gain a situational overview.
Such analysis can be partly automated using anomaly
or intrusion detection tools (Fernandes et al., 2018).
However, these tools may not reveal details impor-
tant to evidence collection, and therefore manual ex-
ploratory network data analysis plays an important
role, as it allows analysts to verify detected anomalies,
examine contexts, or extract additional information.
One of the main challenges of the exploratory
analysis of network traffic is the volume of data that
faces high computational demands. Besides, foren-
sic analysis requires that the analyst has access to
all the data, which limits the use of some automated
tools aggregating the data. Such analysis is typi-
cally based on two approaches: interactive raw data
analysis and statistical analysis. Tools such as Wire-
shark or Network Miner are commonly used in in-
teractive raw data analysis to filter, aggregate, and
extract meaningful information. Their disadvantage
is a limited visualization, amount of obtained infor-
a
https://orcid.org/0000-0002-0212-6593
b
https://orcid.org/0000-0002-3746-5114
mation, high demands on computing resources, and
limited automation of analysis queries. In the sta-
tistical approach, the significant packet elements are
extracted from network traffic and visualized in the
form of various statistics charts and overview visual-
izations. The main advantage of tools such as Arkime
or Elastic Stack is processing large amounts of net-
work data and providing an overview via interactive
visualizations. Nevertheless, because of the data ag-
gregation, the analyst has limited access to raw data.
Our research aims to combine the advantages of
both approaches and enable the analyst to investigate
the captured data using interactive visualization. To
achieve this goal, we introduce the GRANEF toolkit
focused on association-based network traffic analysis.
This method is widely used to analyze real-world ob-
jects, social networks, or as part of criminal investiga-
tion (Atkin, 2011). It also reflects the way people nat-
urally think (Zhang et al., 2020). In contrast to current
methods focused only on hosts relations, we focus on
an exploratory analysis of all significant attributes of
collected network traffic data, including connection
properties and application data. The toolkit is based
on graph database Dgraph (Dgraph Labs, Inc., 2021)
capable of storing and analyzing a large volume of
logs provided by the Zeek (The Zeek Project, 2020)
network security monitor. Unlike interactive raw data
analysis, our approach allows the analysts to browse,
filter, and aggregate all collected information and vi-
sualize the results in a relationship diagram providing
a broader context to analyzed data.
Cermak, M. and Sramkova, D.
GRANEF: Utilization of a Graph Database for Network Forensics.
DOI: 10.5220/0010581807850790
In Proceedings of the 18th International Conference on Security and Cryptography (SECRYPT 2021), pages 785-790
ISBN: 978-989-758-524-1
Copyright
c
2021 by SCITEPRESS – Science and Technology Publications, Lda. All rights reser ved
785
2 RELATED WORK
Commonly used techniques, analysis methods, and
research directions of network forensics are summa-
rized in the survey by Khan et al. (Khan et al., 2016).
In addition to a taxonomy proposal, they also sum-
marize the open challenges and discuss possible so-
lutions. A well-arranged insight into the area is also
provided by Ric Messier’s book (Messier, 2017) pre-
senting the whole process of network forensics to-
gether with commonly used tools. The main empha-
sis is on the practical use of these tools in a real-world
environment, allowing us to better understand the an-
alyst’s needs. Besides analysis approaches used in
the network forensics area, our research is also mo-
tivated by criminal investigation processes. To solve
the crime and maintain an overview of the whole case,
criminal investigators typically capture associations
between real-world objects and events through link
analysis (Atkin, 2011). Thanks to this approach, they
can maintain a good overview of the data while pre-
serving all the analysis details, which is also the goal
of network forensics.
The utilization of graph databases for network
traffic analysis was introduced by Neise (Neise,
2016). He proposed to use Zeek for data extraction
and store the data in the Neo4j graph database (Neo4j,
2021). To capture the extracted information, Neise
proposed a simple data model, which we further de-
velop in our work. Besides, we propose to utilize
Dgraph to efficiently store and analyze large amounts
of data, which is difficult to achieve in the Neo4j
database. The use of Neo4j is also proposed by
Diederichsen et al. (Diederichsen et al., 2019). They,
however, were focused only on the analysis of con-
nection, DNS, and HTTP logs. They designed a data
model that takes into account all attributes in the form
of associations. This approach generates many nodes
and edges, which places huge demands on storage
and computing capacity. Another example of a graph-
based network traffic analysis is Sec2graph proposed
by Leichtnam et al. (Leichtnam et al., 2020). They
have further developed the approach of Neise and
proposed automatic detection of attacks and anoma-
lies. They did not store the data in a database for ex-
ploratory analysis but transformed them into associa-
tions, which they analyzed using machine learning.
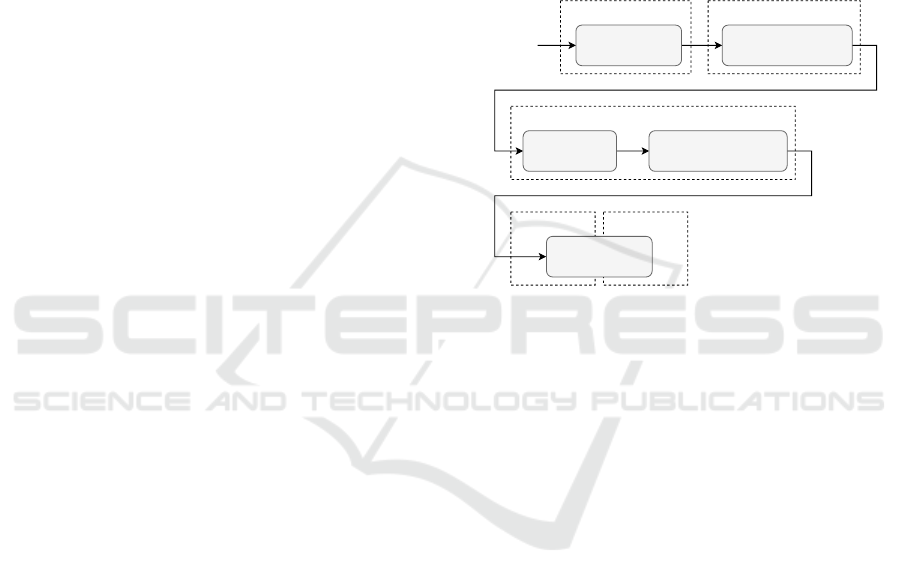
3 TOOLKIT DESIGN
The central part of the GRANEF toolkit is graph
database Dgraph which enables scalable data storage,
and processing of large-size network traffic captures.
The toolkit further consists of tools for data prepro-
cessing as well as their exploratory analysis. These
data processing and analysis tools are implemented
as standalone modules as Docker containers where
one module can implement more than one tool, or
one tool can be implemented by more than one mod-
ule, as shown in Figure 1. For example, the indexing
and graph database tools, both working directly with
a running instance of Dgraph, use the functionality of
one Data handling module. The Transformation mod-
ule is our custom solution, and the remaining modules
are based on the use of already existing tools.
extraction transformation
indexing graph database
analysis
Transformation moduleExtraction module
Data handling module
API module
Web module
PCAP
Figure 1: Data pipeline of the GRANEF toolkit.
Separation of data processing into standalone mod-
ules allows us to easily replace or update some mod-
ules without changing the remaining, as long as the
compatibility with subsequent modules is preserved.
Besides, this approach allows us to store intermediate
results and use them in other analysis tools or speed
up the data processing for a new analysis.
3.1 Data Extraction
Network traffic captures are initially processed by
Zeek, which extracts information from packet headers
and application layers (e.g., from HTTP, DNS, TLS,
and SSH protocols) and produces them as log files.
By default, it aggregates packets to connections and
stores their characteristics. Individual records across
log files are linked through a unique connection iden-
tifier that easily links extracted data as associations.
The advantage of Zeek is the variety of data process-
ing settings and especially the possibility of extend-
ing it with new extraction methods. This functionality
makes it possible to respond to various requirements
of network traffic forensics and reflect new trends and
applications. One possible extension to the Extrac-
tion module would be to add the export of transferred
application data or files. Zeek manages to save cap-
tured files in a separate folder, whereas the reference
SECRYPT 2021 - 18th International Conference on Security and Cryptography
786

to these files is retained in the corresponding log. It
is also possible to extend packet analysis scripts and
extract additional information about the connection
not available in a default configuration. The modu-
larity feature of the GRANEF toolkit plays an impor-
tant role in this case as it allows us to prepare sev-
eral containers with various configurations and data
processing extensions allowing us to reflect different
requirements to the current case of network forensics.
3.2 Data Transformation
The Transformation module takes log files produced
by Zeek, utilized in the previous module, and converts
them to the RDF triples format (W3C, 2014) accepted
by Dgraph. This conversion of log data is performed
by a custom script that processes selected log files
record by record. Since each log file has a prede-
fined set of attributes, we can manually decide which
ones to transfer to the database and how to treat them.
This approach makes it very easy to incorporate any
changes in the design of the database schema or any
information obtained from external sources. Such in-
formation can be, for example, an attribute value that
indicates that the host with a given IP address has
some property that was discovered during forensics
analysis. This information can also be added later
through a unique external identifier given to the node
at the stage of its definition.
The conversion is done according to a scheme
whose simplified form is shown in Figure 2. This
scheme is based on Neise (Neise, 2016) and Leicht-
nam et al. (Leichtnam et al., 2020), who represent in-
dividual logs as separate nodes and connect them with
defined associations. The information contained in
log records is stored in the database as node attributes
allowing to perform filtering or aggregation on them.
Compared to previously proposed schemas, we add
an additional edge communicated between individ-
ual hosts to facilitate the definition of queries focused
only on the connection’s existence and optimize the
query execution. Communicating hosts are extracted
from the connection log and represented as separate
nodes. We also simplify edge naming to be uniform
throughout all logs and make it easier to query the en-
tire schema. The resulting schema is designed to re-
flect people’s common perception of how a computer
network works and simplifies analysis as queries can
be formed at the highest level of abstraction.
Each node of the schema has an assigned type.
Host nodes represent a device on the network with
a given IP address. These nodes can be associ-
ated with Host-data nodes containing information ex-
tracted from application data related to the host. Ex-
originated
responded
<host-data>
Host
produced
Connection
<Host-data>
communicated
<host-data/uid> <Application>
Figure 2: Simplified database schema showing nodes and
their associations.
amples of such data are domain names extracted from
DNS, HTTP, or TLS traffic. Further, it can refer to
transferred files, certificates, or user-agents. It is also
possible to associate external information relevant to
the host, such as details from reputation databases.
The Connection nodes contain information about the
network connection, such as its duration, the number
of bytes transferred, relevant ports, and used proto-
col. The Application nodes contain application data
extracted from the Connection and may be mutually
connected by an additional edge. Edge host-data/uid
is present to preserve what Application node created
the associated Host-data node. All edges are direc-
tional but allow reverse processing for querying from
an arbitrary node regardless of its type.
Thanks to the universal definition of the proposed
scheme, it is possible to transform other types of data
related to network traffic analysis in a similar way
as using the Zeek. An example is IP flows, which
may currently contain information about individual
connections and can be extended by information ex-
tracted from application data (Velan, 2018). Alterna-
tively, it is possible to transform system logs related
to network connections or collected from network de-
vices. These transformations can be represented as
separate modules of the toolkit to be easily intercon-
nected according to the network forensics case.
3.3 Data Handling
The core part of data handling is the Dgraph clus-
ter consisting of two types of computational nodes.
Dgraph Zero controls the cluster and serves as the
main component responsible for the orchestration of
the database and analysis. Data processing is per-
formed by Dgraph Alpha nodes containing indexed
data. At least one Zero and Alpha node are needed
to handle stored data. Additional details about the
database and data analysis abilities can be found in
its documentation (Dgraph Labs, Inc., 2021).
The Data handling module consists of indexing
and graph database components, working directly
with an instance of Dgraph. The indexing compo-
nent uploads and indexes RDF triples and stores them
in an internal database structure. The main part of
GRANEF: Utilization of a Graph Database for Network Forensics
787

the component is Dgraph Bulk Loader which oper-
ates on the MapReduce concept. It appropriately uti-
lizes available computational resources. In addition,
the component allows us to specify the number of Al-
pha nodes that will be utilized in the following graph
database component. Large volumes of data can thus
be distributed within the cluster while maintaining the
ability to perform fast analysis over stored data. Re-
sults of the indexing component are binary files stor-
ing both the data and indexes. The advantage of this
approach is a reduction of data processing time when
it is reloaded. Besides, it is possible to use the gen-
erated index within another instance of Dgraph de-
ployed on a more powerful computation node.
The graph database component takes care of man-
aging Dgraph nodes and their communication. Data
provided by the indexing component are loaded to Al-
pha nodes. The exposed Dgraph user interface al-
lows, among other things, to perform basic queries
over the data. However, it is not suitable for ex-
ploratory analysis as it has only a limited degree of
interaction. The analyst must also know the specifics
of the query language, which complicates the adapta-
tion of the proposed network forensics approach.
3.4 Data Analysis
Data stored in Dgraph are queried using Dgraph
Query Language (DQL) based on GraphQL. An ex-
ample of such a query is provided in Figure 3 con-
taining a selection of TCP connections and trans-
ferred files from a local network. A DQL query finds
nodes based on search criteria matching patterns in
the graph and returns a graph in JSON format (Dgraph
Labs, Inc., 2021). Queries are composed of nested
blocks; their evaluation starts by finding the initial set
of nodes specified in the query root, against which
the graph matching is applied. In addition to filter-
ing, DQL allows variables definition and data aggre-
gation. Thanks to the pre-defined schema, results
are predictable. A disadvantage is that DQL is not
widespread yet, and the analyst must devote some
time to perform advanced queries. To overcome this
issue, we have created an additional analysis module
providing an abstract layer over DQL.
The GRANEF analysis tool consists of two mod-
ules: the Application interface (API) module and the
Web user interface module. This approach supports
greater versatility of the entire solution, as it is pos-
sible to connect other systems to the API without the
need to use a web user interface. The API implements
querying and processing of data stored in Dgraph,
while only filter properties or immersion rates are re-
quired as input. The provided API functions reflect
common tasks of exploratory analysis and are based
on both our experience and the steps typically per-
formed by analysts within our CSIRT team.
{getConn(func: allof(host.ip, cidr, "10.10.0.0/16")) {
name : host.ip
host.originated @filter(eq(connection.proto, "tcp")) {
expand(Connection)
connection.produced {
expand(_all_)
files.fuid { expand(File) }
}
~host.responded { responded_ip : host.ip }
}
}}
Figure 3: Selection of local network TCP connections and
transferred files using DQL.
The web user interface utilizes the API and repre-
sents its user-friendly extension that allows perform-
ing defined queries and supports exploratory analy-
sis. The query results are displayed in an interactive
relationship visualization which uses a force-directed
graph layout and allows nodes aggregation to show
large relationship diagrams while preserving a simple
overview of the data. Based on our experience, this
layout seems to be the best comprehensible. However,
we plan to verify other variants in the future. An ex-
ample of such a visualization is shown in Figure 4,
containing one specific connection of response to the
query from Figure 3. This approach supports interac-
tivity as the analyst can select nodes or edges, see all
attributes, and perform another analytical query over
them while the result is added to the same visualiza-
tion or displayed in a new analysis tab. As part of the
exploratory analysis, it is possible to browse through
the associations between information extracted from
network traffic and observe a context that would oth-
erwise remain hidden.
host.originated
~host.responded
connection.produced
connection.produced
http.resp_fuid
files.fuid
Host
Host
File
Files
HTTP
Connection
Figure 4: Visualization of one connection between hosts.
4 DISCUSSION
To evaluate the toolkit capabilities, we use network
traffic datasets containing realistic scenarios with
small-size captures and larger ones with size in the
SECRYPT 2021 - 18th International Conference on Security and Cryptography
788
order of gigabytes. Especially, analysis of large net-
work traffic captures is a typical use-case of network
forensics, so we pay more attention to it. In this case,
however, the analyst expects that preprocessing of
such data puts considerable computational demands
increasing processing time. Therefore, greater em-
phasis is on the subsequent analysis, which must be
sufficiently interactive without delays.
4.1 Computational Requirements
To test data processing speed, we have prepared a vir-
tual machine with Debian OS, 4 VCPU, and 16 GB
RAM, which corresponds to today’s ordinary hard-
ware performance. The data processing speed of
a small capture file (Digital Corpora, 2020) with the
size of several megabytes was affected more by con-
tainer startup. Nevertheless, the processing took an
average of tens of seconds. To test the processing of
a larger network capture, we selected a capture from
the second day of the CyberCzech exercise (Tovar
ˇ
nák
et al., 2020) which is approximately 6 GB in size
and contains 330,564 connections. The average pro-
cessing time for this file was approximately 7 min-
utes, with extraction taking approximately 120 sec-
onds, transformation 50 seconds, and indexing 250
seconds. The transformed dataset resulted in 718,475
nodes and 397,632 edges, with an index size of ap-
proximately 820 MB. Although this data processing
time is not critical for network forensics, it is possible
to achieve further improvements by parallelizing the
extraction using multiple Zeek runs or using a bigger
cluster for the data indexing task.
Once the data are indexed, analytical queries are
performed fast, whereas the results are typically re-
turned in one or two seconds. However, the main
challenge is to render the results in the form of rela-
tionship visualization. It is necessary to spread nodes
in a suitable layout to reasonably support the visual
analysis. Besides, a larger number of nodes place
great computational demands and causes the result-
ing graph to become less clear. For this reason, it is
necessary to allow the grouping of similar nodes so
that the overall visualization could offer a sufficient
response. We perceive this visualization requirement
as a crucial factor of the toolkit, which we plan to fo-
cus on more in future work.
4.2 Exploratory Analysis
The main benefit of graph-based network forensics
is the support of exploratory analysis. The general
queries that are part of API follow the analyst’s typi-
cal behavior. In the beginning, it is essential to restrict
the set of nodes we want to focus on. To do so, we
need to understand the nature of as many hosts and
connections as possible to distinguish unusual net-
work traffic. Examples of some queries are "return
all connections and protocol types between two spe-
cific hosts" or "return number of all specified connec-
tions for hosts that fall within given CIDR range". We
have also taken advantage of DQL and defined queries
utilizing aggregation functions, allowing us, for ex-
ample, to group all host connections according to the
number of transferred bytes.
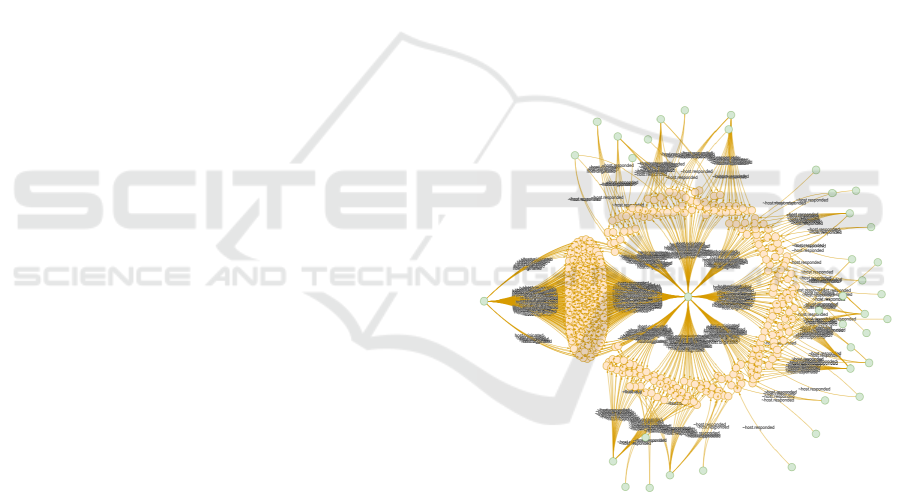
The result of a query that focused on a subset of
outgoing TCP connections of one host can be seen in
Figure 5. An advantage of such visualization is that it
often allows the analyst to distinguish regular network
traffic from suspicious just at first glance based solely
on the resulting pattern. In the provided example, it
would be relevant to pay attention to the communi-
cation with the left node. In the subsequent analy-
sis step, the analyst can select nodes or a group of
nodes, further explore their associations, and go into
the graph’s depth and explore observed connections.
Figure 5: TCP connections in the National Gallery DC Sce-
nario dataset (Digital Corpora, 2020).
Besides the mentioned advantages, our experience
has also shown the challenges that need to be faced
with the proposed graph-based network forensics ap-
proach. Fast relationship visualization is crucial as
it directly affects the exploratory analysis. Another
challenge we have encountered is taking time percep-
tion into account. Associations of individual connec-
tions are created independently of the time context.
This approach allows the analyst to overview events
that have occurred over a longer time. On the other
hand, it is necessary to consider the continuity of indi-
GRANEF: Utilization of a Graph Database for Network Forensics
789

vidual network connections in certain cases. This can
be achieved through appropriate attribute filtering, but
a challenge is how to make both of these methods ac-
cessible to the analyst. Another challenge associated
with graph analysis is the need for a mindset change
as analysts are used to other approaches. However,
our experience shows that they can naturally analyze
the data provided in this way after a while. This ob-
servation requires a more detailed verification, which
we plan to perform in future work.
5 CONCLUSION
Graph-based network forensics is a new approach
to analyzing network traffic data utilizing mod-
ern database technologies capable of storing large
amounts of information based on their associations.
It follows the typical way of human thinking and
perception of the characteristics of the surrounding
world. Its main advantage is the connection of ex-
ploratory analysis of network traffic data with results
visualization allowing analysts to easily go through
the acquired knowledge and visually identify interest-
ing network traffic. Our experience also shows that
this approach is not only the new method of data stor-
age and querying, but it is a shift of mindset that al-
lows us to perceive network data in a new way.
In this paper, we introduced the GRANEF toolkit
utilizing Dgraph database that stores transformed in-
formation from network traffic captures extracted by
Zeek network security monitor. The stored data are
presented to the user via a web-based user interface
that provides an abstraction layer above the database
query language and allows the user to efficiently
query data, visualize results in the form of a relation-
ship diagram, and perform exploratory analysis.
Our aim of the provided toolkit description was
to introduce a new approach to network forensics
and incident investigation and describe this solution’s
specifics. As part of future work, we want to further
compare this approach with other typically used an-
alytical methods, both in terms of functionality and
analyst’s behavior. Furthermore, we plan to focus on
the definition of new methods for automatic analysis
of network traffic based on the associations provided
by our proposed data model. We also see great po-
tential in connecting various data types and sources,
which could create a unified analytical environment
allowing us to analyze the data obtained from hosts
and network traffic in one place. The first evaluation
results of the proposed approach demonstrate its great
potential for network forensics and generally for ex-
ploratory analysis of network traffic data.
ACKNOWLEDGEMENTS
This project has received funding from the European
Union’s Horizon 2020 research and innovation pro-
gramme under grant agreement No 833418.
REFERENCES
Atkin, H. (2011). Criminal Intelligence: Manual for Ana-
lysts. UNODC Criminal Intelligence Manual for Ana-
lysts. United Nations Office on Drugs and Crime (UN-
ODC).
Dgraph Labs, Inc. (2021). Native GraphQL Database: The
Best Graph DB | Dgraph. https://dgraph.io/. Ac-
cessed: 2021-01-21.
Diederichsen, L., Choo, K.-K. R., and Le-Khac, N.-A.
(2019). A Graph Database-Based Approach to Ana-
lyze Network Log Files. In Network and System Secu-
rity, pages 53–73. Springer International Publishing.
Digital Corpora (2020). The 2012 National Gallery DC Sce-
nario. https://digitalcorpora.org/corpora/scenarios/
national-gallery-dc-2012-attack. Accessed: 2021-01-
21.
Fernandes, G., Rodrigues, J. J. P. C., Carvalho, L. F., Al-
Muhtadi, J. F., and Proença, M. L. (2018). A com-
prehensive survey on network anomaly detection.
Telecommunication Systems.
Khan, S., Gani, A., Wahab, A. W. A., Shiraz, M., and Ah-
mad, I. (2016). Network forensics: Review, taxon-
omy, and open challenges. Journal of Network and
Computer Applications, 66:214–235.
Leichtnam, L., Totel, E., Prigent, N., and Mé, L. (2020).
Sec2graph: Network Attack Detection Based on Nov-
elty Detection on Graph Structured Data. In Detection
of Intrusions and Malware, and Vulnerability Assess-
ment, pages 238–258. Springer International Publish-
ing.
Messier, R. (2017). Network Forensics. John Wiley & Sons,
Ltd.
Neise, P. (2016). Intrusion Detection Through Relationship
Analysis. Technical report, SANS Institute.
Neo4j (2021). Neo4j Graph Platform - The Leader in Graph
Databases. https://neo4j.com. Accessed: 2021-01-30.
The Zeek Project (2020). The Zeek Network Security Mon-
itor. https://zeek.org/. Accessed: 2021-01-21.
Tovar
ˇ
nák, D., Špa
ˇ
cek, S., and Vykopal, J. (2020). Traffic
and log data captured during a cyber defense exercise.
Data in Brief, 31.
Velan, P. (2018). Application-Aware Flow Monitoring.
Doctoral theses, dissertations, Masaryk University,
Faculty of Informatics, Brno.
W3C (2014). RDF 1.1 N-Triples. https://www.w3.org/TR/
n-triples/. Accessed: 2021-01-21.
Zhang, H., Zeng, H., Priimagi, A., and Ikkala, O.
(2020). Viewpoint: Pavlovian Materials—Functional
Biomimetics Inspired by Classical Conditioning. Ad-
vanced Materials, 32(20).
SECRYPT 2021 - 18th International Conference on Security and Cryptography
790
