
Classifying Biometric Systems Users among the Doddington Zoo:
Application to Keystroke Dynamics
Denis Migdal
1 a
, Ilaria Magotti
2
and Christophe Rosenberger
2 b
1
Universit
´
e Clermont Auvergne, CNRS, Mines Saint-Etienne, Clermont Auvergne INP, LIMOS,
F-63000 Clermont-Ferrand, France
2
Normandie Univ., ENSICAEN, UNICAEN, CNRS, GREYC, 14000 Caen, France
Keywords:
Doddington Zoo, Performance Evaluation of Biometric Systems, Keystroke Dynamics.
Abstract:
Doddington zoo defines four categories of users when using a biometric system related to their difficulty to be
recognized or attacked. In this paper, we propose an original work consisting in predicting for any biometric
modality the associated animal in the Doddington menagerie related to a user given few captured biometric
samples. Such a prediction could be useful for many applications, as for example, to adapt the behavior of
biometric systems to each user. In this work, we apply this methodology to keystroke dynamics as it is an
interesting behavioral biometric modality for user authentication. It consists in analyzing the way of typing
of a user in order to recognize him/her. We use a significant keystroke dynamics dataset and we demonstrate
through experimental results the benefit of the proposed approach.
1 INTRODUCTION
The performance of biometric systems varies for dif-
ferent reasons as detailed in (Phillips et al., 2000)
among human interactions (Blanco-Gonzalo et al.,
2017), environmental conditions (Tan et al., 2010) or
intrinsic variations related to users (Yager and Dun-
stone, 2008; Kirchgasser and Uhl, 2016). In this pa-
per, we focus on this last point. As it has been iden-
tified in 1998 by a pioneer article (Doddington et al.,
1998), the performance of biometric systems is far to
be similar for all users. A biometric system could
be efficient for some users and generate many false
rejection for others. The biometric menagerie usu-
ally known by Doddington zoo, is a collection of an-
imal labels describing the performance behavior of a
user with biometric systems. It is an interesting ap-
proach usually used to improve biometric recognition
systems performance (Barron et al., 2008). In the bio-
metric menagerie, users are classified based on legit-
imate scores (comparison with samples belonging to
the user) and impostor ones (comparison with sam-
ples from other users considered as impostors) . In
fact, users are split into four categories: 1) Sheeps
are easy to recognize, 2) Goats are difficult to rec-
ognize, 3) Lambs are easy to forge or counterfeit, 4)
a
https://orcid.org/0000-0002-4741-1849
b
https://orcid.org/0000-0002-2042-9029
Wolves are good to forge others. Being able to clas-
sify a user in the Doddington menagerie has many in-
terests, mainly for the definition of adaptive biomet-
ric systems. The biometric reference template of a
user can be updated considering the type of user (or
animal) (Mhenni et al., 2018). Synthetic biometric
datasets can be created by generating biometric sam-
ples from users considering these categories of ani-
mals (Lopes Silva et al., 2019). A multibiometric sys-
tem can be tuned in function of the animal associated
to the user (Poh, 2010). We believe that this user clas-
sification is particularly useful for behavioral biomet-
ric modalities. Indeed, the stability of user’s behavior
has a great impact on performance on such biometric
systems. In this work, we consider the keystroke dy-
namics as biometric modality in order to apply the
proposed method. Note that the proposed method
could be applied on any biometric modality.
Keystroke dynamics is a behavioral biometric
modality defined in 1980 (Gaines et al., 1980). Its
principle consists in analyzing the behavior of a user
when typing on a keyboard. Times (pressure, flight,
release) are measured by the operating system and can
be used as raw information on user’s behavior. This
biometric modality is very interesting for user authen-
tication as it does not require any additional sensor
and it is natural for users to type their password. Its
main drawback concerns the performance that cannot
Migdal, D., Magotti, I. and Rosenberger, C.
Classifying Biometric Systems Users among the Doddington Zoo: Application to Keystroke Dynamics.
DOI: 10.5220/0010577507470753
In Proceedings of the 18th International Conference on Security and Cryptography (SECRYPT 2021), pages 747-753
ISBN: 978-989-758-524-1
Copyright
c
2021 by SCITEPRESS – Science and Technology Publications, Lda. All rights reserved
747

be as good as face or fingerprint for example. We can
summarize here the contributions of this work. In this
paper, we propose an original method whose objective
is to classify a user in one of the 3 Doddington classes
(sheep, goat and lamb) given few biometric samples.
We do not consider wolves in this work because we
want to propose solutions to enhance the performance
and not necessary the robustness face to attacks (it
could concern perspectives of this study). Most of
studies in the literature classify users with a posteri-
ori samples from a dataset (Teli et al., 2011). Another
contribution in this paper is to propose a validation
process for users classification. In general, classifi-
cation results are associated to performance (i.e. the
goat class should have the poorest results). It is clear
that the frontier between animal classes is difficult to
establish. We assume in this work that a user classi-
fied to a specific animal for a biometric modality re-
mains the same for different data. Under this assump-
tion, we can measure a recognition rate considering
the consensus between the classification among data.
The paper is organised as follows. We present in sec-
tion 2, the state of the art concerning the classifica-
tion of users among the Doddington zoo. In section 3,
we provide a brief background on keystroke dynam-
ics. Section 4 is dedicated to the proposed method for
associating a user with an animal from the Dodding-
ton zoo. Experimental results on a large dataset on
keystroke dynamics data are given in section 5. We
conclude this study in section 6.
2 LITERATURE REVIEW
The biometric menagerie has been defined in 1998
(Doddington et al., 1998) with a first study show-
ing the relationship between users and their perfor-
mance when using biometric systems. In 2009, Ross
et al. (Ross et al., 2009) proposed a user-dependent
multibiometric system by considering the animal in
the Doddington menagerie associated to a user in a
biometric dataset. They propose a classification ap-
proach by considering all legitimate and impostor
scores in the dataset. Even if this classification per-
mits to enhance the performance during the fusion, no
validation of the classification is proposed. In 2011,
Teli et al. (Teli et al., 2011) investigated the biometric
zoos generalization across algorithms and data sets.
The question was to answer as for example if a sub-
ject classified as a goat for algorithm A on dataset X,
is also a Goat for algorithm B on data set Y? Experi-
ments have been conducted on a face database (FRVT
2006) with two matching algorithms. They propose
a framework for describing and testing for the exis-
tence of different levels of biometric zoo. Zeroth-
Order Zoo implies only that people may be labeled
as animals in a single experiment. A first-order zoo
exists when personal identity is considered important
to others data within the same scenario. In this work,
we are addressing the first-order zoo for different data
and matching algorithms to classify users. Morales et
al. in 2014 (Morales et al., 2014) proposed a predic-
tion method of ”good users” with keystroke dynam-
ics. They used the Kullback-Leibler divergence as a
quality measure to categorize users. They split users
from a keystroke dynamics dataset into 3 classes con-
sidering the value of the Equal Error Rate (EER) for
the validation process. This work is interesting even
if the proposed method permits to identify good bio-
metric samples more than good users (or sheeps). Re-
cently, Mehnni et al. (Mhenni et al., 2018) proposed
in 2018 to classify users in the Doddington menagerie
in order to adapt the template update strategy. This
approach has been applied to keystroke dynamics and
uses the notion of relative entropy for user classifi-
cation. This adaptive process permits to improve the
verification performance over time.
All these works are interesting and provide good
studies on users classification in the Doddington
menagerie. Nevertheless, we have many remarks. In
most works, legitimate and impostor scores are used
for user classification. Consequently, the process be-
comes very dependent of the used matching algo-
rithms (as identified by Teli at al. (Teli et al., 2011)).
The resulting fact is that the frontier between animal
classes is far to be clear. Considering scores is not
maybe a good idea. Studies in the literature on the
biometric menagerie are often dataset driven i.e. re-
searchers try to classify users in the dataset. Could it
be possible after acquiring few biometric samples to
predict the associated animal related to the user? The
validation of users classification is not completely sat-
isfying. In machine learning applications, we expect
to measure a recognition rate but the ground truth is
here difficult to establish. In many studies (Mhenni
et al., 2018), user classification is used as posteriori
information to adapt the user recognition, the fron-
tier between classes has not to be precise. An im-
portant question remains. Are some users more dif-
ficult to recognize/attack for any matching algorithm
and dataset? For morphological biometric modalities,
the question remains open. We think that it is easier
for behavioral modalities. It is well known that some
users are more difficult to recognize for keystroke dy-
namics as for example (stability of typing, habits. . . ).
That is why we consider this biometric modality in
this work. Before presenting the proposed method for
user classification in the biometric menagerie, we pro-
SECRYPT 2021 - 18th International Conference on Security and Cryptography
748
vide a brief background on keystroke dynamics as it
is the considered biometric modality in this paper.
3 BACKGROUND IN
KEYSTROKE DYNAMICS
Keystroke dynamics is a behavioral biometric modal-
ity. keystroke dynamics systems are low cost because
only a keyboard and an accurate timer are needed
to record the timings that will be used to recognize
the user. No other sensor must be purchased. In
term of usability, this solution is very good. Its main
drawback is a lower performance as it uses a behav-
ior less stable than morphological modalities. Try-
ing to adapt the processing to users is thus very im-
portant to enhance the performance of such systems.
It is possible to capture this behavior considering 1)
OS events (times), 2) video of the typing, using a
camera or a webcam to monitor the hands while the
user is typing on a keyboard and 3) audio sound of
the typing. In this paper, only the first type of data
is employed, which represents the timing pattern of
keystroke (Idrus et al., 2013). After the capture phase,
an amount of unprocessed data is obtained. This in-
formation can be considered as a list of events in se-
quential order recorded from the moment in which the
user starts typing on the keyboard. The next phase
concerns the processing of the data collected during
the biometric capture, the data need to be organized
and modified in order to obtain a processed record
consisting in an ensemble of features (Idrus et al.,
2013). The time-based measure we consider in our
analysis can be described as: keystroke latencies can
be defined as the differences of time between two keys
events (Giot et al., 2011) and can be determined by the
timing delay experienced by a process (Idrus et al.,
2013); keystroke duration represents for how long a
key is pressed. The notion of digraph has also to be
introduced: it is the time necessary to press two keys.
This notion has been extended to n-graphs, when con-
sidering n events.
As keystroke dynamics is a behavioral modal-
ity, the generation of the reference template requires
many samples to capture the behavior. The more data
we acquire on a user, the better will be the recogni-
tion results. The reference template of a user u
i
is
defined by R
i
= {b
i
1
, .., b
i
M
} where b
i
j
corresponds
to a biometric feature vector, for keystroke dynamics,
it corresponds to collected times associated to the typ-
ing of a password and M corresponds to the number
of samples used during the enrollment. For usability
reasons, the number of captures should be limited, in
this paper, we use M = 3. Given a biometric probe
b
0
of assumed user u
i
, we consider 3 matching score
computations from the literature (Migdal, 2019):
S
1
(b
0
, R
i
) = min
j=1:M
K
∑
k=1
|b
0
k
− b
i
j,k
| (1)
S
2
(b
0
, R
i
) =
1
M
M
∑
j=1
K
∑
k=1
|b
0
k
− b
i
j,k
| (2)
S
3
(b
0
, R
i
) =
M
∑
j=1
min
k=1:K
|b
0
k
− b
i
j,k
| (3)
Where b
i
j,k
is the kth feature of the sample j from
user u
i
and K is the dimension of the biometric fea-
ture vector (depending on the number of characters in
the password). We consider 3 algorithms in this work
in order to estimate how invariant is our user classifi-
cation to them.
4 PROPOSED METHOD
The proposed method has for objective to define an
operational approach to classify a user in one of the
class in the Doddington zoo. We expect to realize this
classification using few biometric samples acquired
from the user. The proposed approach requires an ini-
tial step to achieve this goal. As mentioned in section
2, we will not use directly matching scores for the
classification but AUC values.
4.1 Initial Step
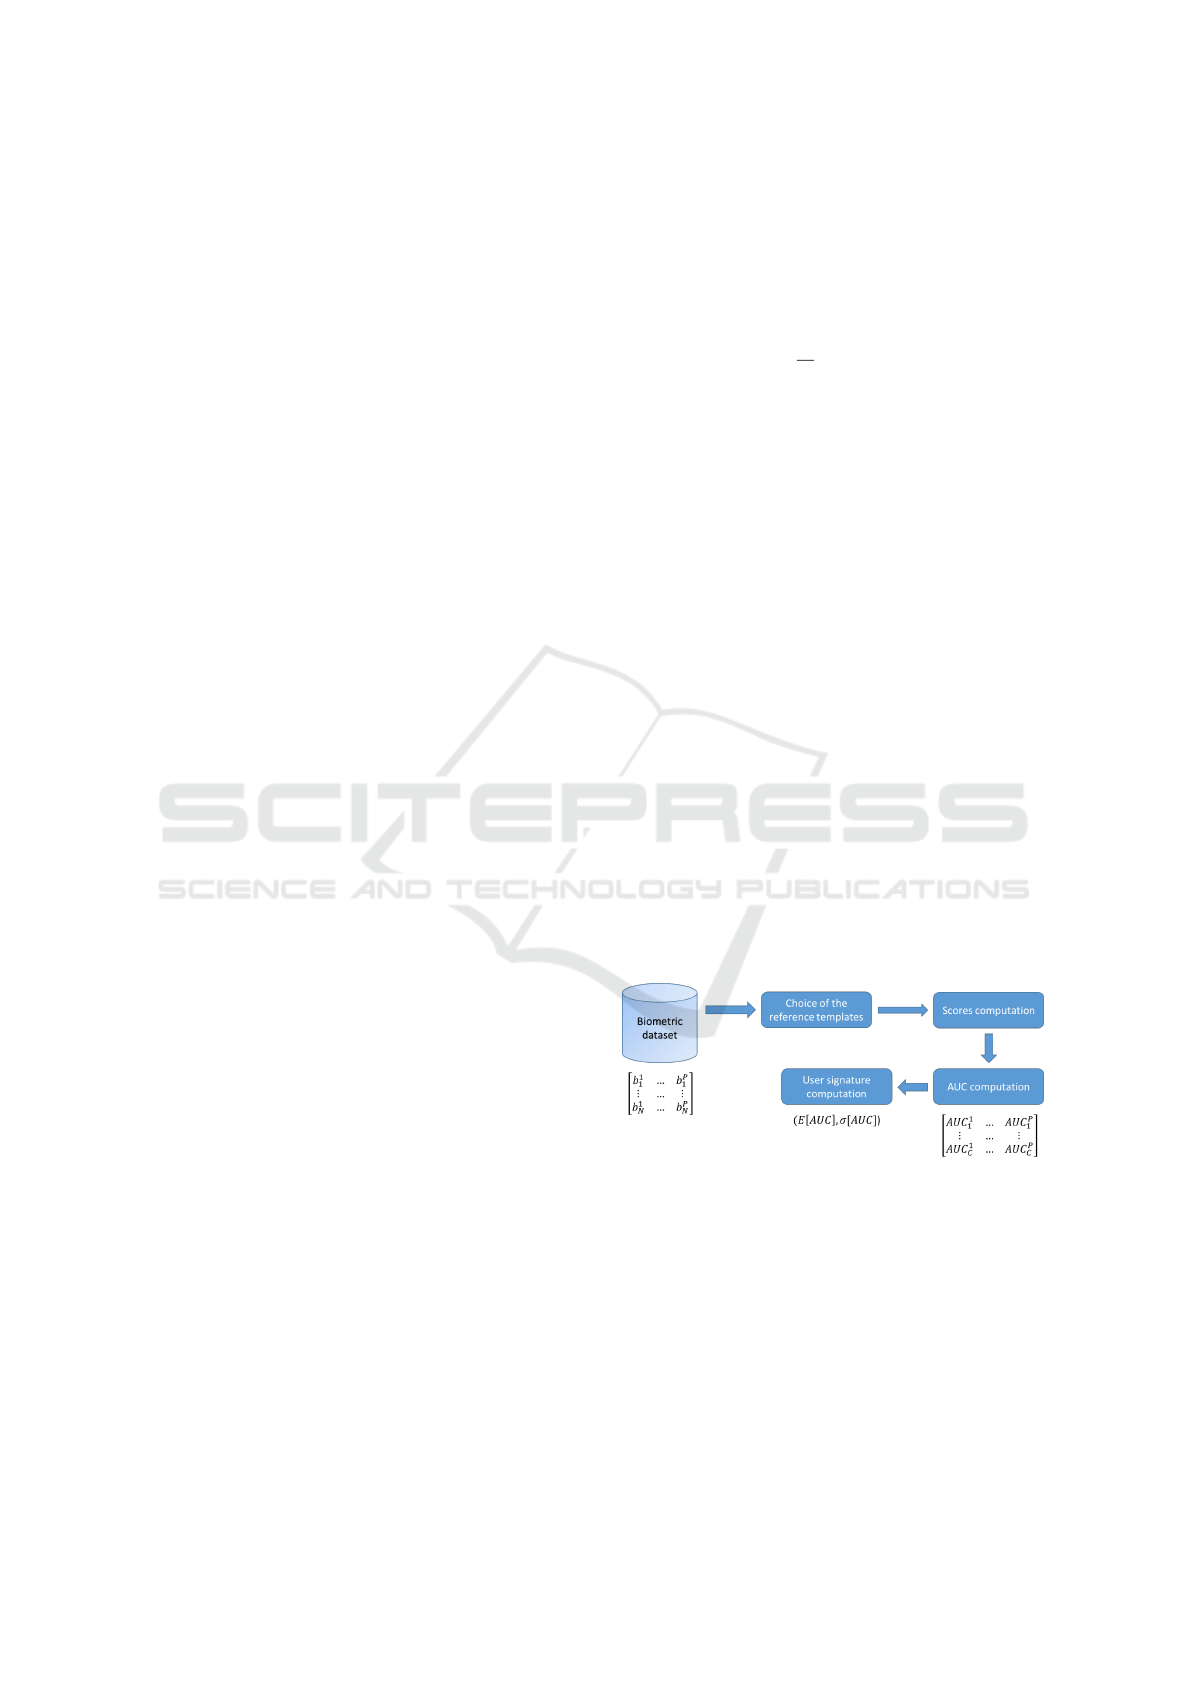
Figure 1: User signature computation. Illustration on a
dataset composed of N biometric samples for each of the
P individuals (C is related to the number of possibilities for
the reference definition.
We suppose having a dataset ∆ = {b
i
j
, i = 1 : P, j = 1 :
N} where b
i
j
corresponds to the jth biometric sample
of size N for user u
i
in a dataset composed of P in-
dividuals. In order to generate the reference template
R
i
of user u
i
, one could use M samples. For mor-
phological biometric modalities, M could be equal
to 1, for behavioral ones, M should be higher (typi-
cally 3 or 5). To generate the reference template for
Classifying Biometric Systems Users among the Doddington Zoo: Application to Keystroke Dynamics
749

one user, there are
N
M
possibilities. For each pos-
sibility (i.e. choice of M samples among N) for the
generation of the reference template, we can com-
pute all legitimate matching scores with remaining
samples for the same user. We obtain for one user
(N − M) legitimate scores. We can also compute im-
postor scores by comparing the reference template of
the considered user with all samples from other users.
We thus obtain, (P − 1) × N impostor scores. Given
these scores, we can compute the False Match Rates
(FMR) and False Non Match Rates (FNMR) values
for each choice of the reference template. We can
compute the associated ROC curves and the Area Un-
der the Curve (AUC) value. This AUC value defines
the performance of the biometric system (describing
the ability to well recognize the considered user and
to differentiate him/her from others) when using this
reference template.
If we apply this process for all users and all
choices of reference templates, we obtain a matrix
Γ = {AUC
i
k
, i = 1 : P, k = 1 :
N
M
}. In order to il-
lustrate the amount of computations, we give some
figures with the dataset we use in this work (dataset
of P = 110 individuals described by N = 10 biomet-
ric samples). If we use M = 3 samples for the ref-
erence generation, we have
10
3
= 120 choices. For
each choice, we compute 10 −3 = 7 legitimate scores
and 109∗10 = 1090 impostor ones. The Γ matrix has
consequently 120 lines (corresponding to the number
of possible reference templates) and 110 columns (re-
lated to the number of users in dataset ∆). The Γ ma-
trix describes the difficulty of recognizing each user
for the different choices of the reference template.
Let’s consider now a column of this matrix (corre-
sponding to the AUC
i
values for user i). If these val-
ues are in average low, it means that user u
i
is easy to
recognize and well differentiated from other users (a
sheep in the Doddington menagerie). On the contrary,
if values are in average high, user u
i
can be a goat or
a lamb. To decide among these two classes, we could
consider the variations of the AUC values for each
choice of the reference template. If there are some
variations, it means that user u
i
is a lamb otherwise
it is a goat. To implement this strategy, we compute
for each user a signature composed of E[AUC] (mean
of AUC values) and σ[AUC] (standard deviation of
AUC values) describing its performance behavior for
the classification. We obtain a signature for each of
the P users. Figure 1 summarizes the whole process.
Once we have a signature for each user, we need to
define the decision frontier to Doddington classes. We
adapted the proposed process in (Ross et al., 2009)
to AUC values. In this paper, they considered the
70th percentile of low legitimate scores as sheep and
the 10th percentile of higher impostor scores as lamb.
Others are classified as goats. In our work, we use
the 70th percentile of low E[AUC] values (associated
to threshold T
1
) as sheep and the 10th percentile of
higher σ[AUC] (associated to threshold T
2
) as lamb.
Others are classified as goats. The classification is
thus achieved with a simple decision rule:
Class =
sheep i f E[AUC] < T
1
lamb i f σ[AUC] > T
2
goat otherwise
(4)
Note the values of the decision thresholds T
1
and T
2
are related to the used matching algorithm. The pro-
posed signature for each user has also the advantage
to be normalized.
4.2 Prediction Step
The user class prediction is quite simple and
consists in first computing the user signature
(E[AUC], σ[AUC]). The predicted class is obtained
by applying equation 4. In order to be used in real
conditions and to especially avoid the computing of
all impostor scores, it is possible to select K biomet-
ric samples as a sub-sampling. It is possible to use a
simple clustering approach with the matching score as
distance to generate K clusters and keep the biomet-
ric samples the closest to the obtained K centroids.
The user will have to give few biometric samples for
computing legitimate scores and the previous K se-
lected biometric samples are used as impostor ones.
The user signature can quickly be generated for the
prediction.
5 EXPERIMENTAL RESULTS
5.1 Experimental Protocol
The first step is to select a biometric dataset. We use
in this paper the GREYC-NISLAB keystroke dataset
(Idrus et al., 2013). The collection of data has taken
place in two locations: France and Norway. Sub-
jects came from 24 different countries. A total of
110 individualshas taken part in the experiment (70
in France and 40 in Norway).Users have been asked
to type 5 static passphrases, which were chosen be-
cause of their popularity. We refer to these pass-
words as P1, P2, ..., P5 in next discussions. There-
fore, the database contains 11000 samples in total (5
passwords * 2 classes of hand * 110 users * 10 en-
tries).The great benefit of this dataset is to have the
biometric samples for many users on different data
SECRYPT 2021 - 18th International Conference on Security and Cryptography
750
(here passwords). Under our assumption, a user clas-
sification should be stable among the data for a given
matching algorithm at least. For the experiments, we
tested 2 scenarios for the choice of the reference tem-
plate with M = 3 (i.e. 3 samples for the reference
generation). In scenario 3/5, e choose the 3 samples
for the reference among the 5 first samples (10 possi-
bilities). This choice has for objective to take into ac-
count the chronology of the data acquisition. It could
be important for a behavioral biometric modality. In
scenario 3/10, we choose the 3 samples for the ref-
erence among all samples (120 possibilities). In this
scenario, we do not consider the chronology of data
for the reference generation.
5.2 Data Visualisation
Before analyzing data, we propose in this section to
visualize data. We use the S
1
matching algorithm de-
fined in Equation 1 in this section. As illustration, we
display the signature of 3 users for the 5 passwords in
Figure 2. Signatures from the same user are displayed
with the same color. Because the decision thresholds
are slightly different for each passwords, we use the
average one. It is not surprising to notice that sheeps
are more stable, this is an important characteristic of
these users. There are some variations for lambs and
goats which is logical as these users are less stable
by definition. If we consider the average signature of
these 3 users, the associated animal in the biometric
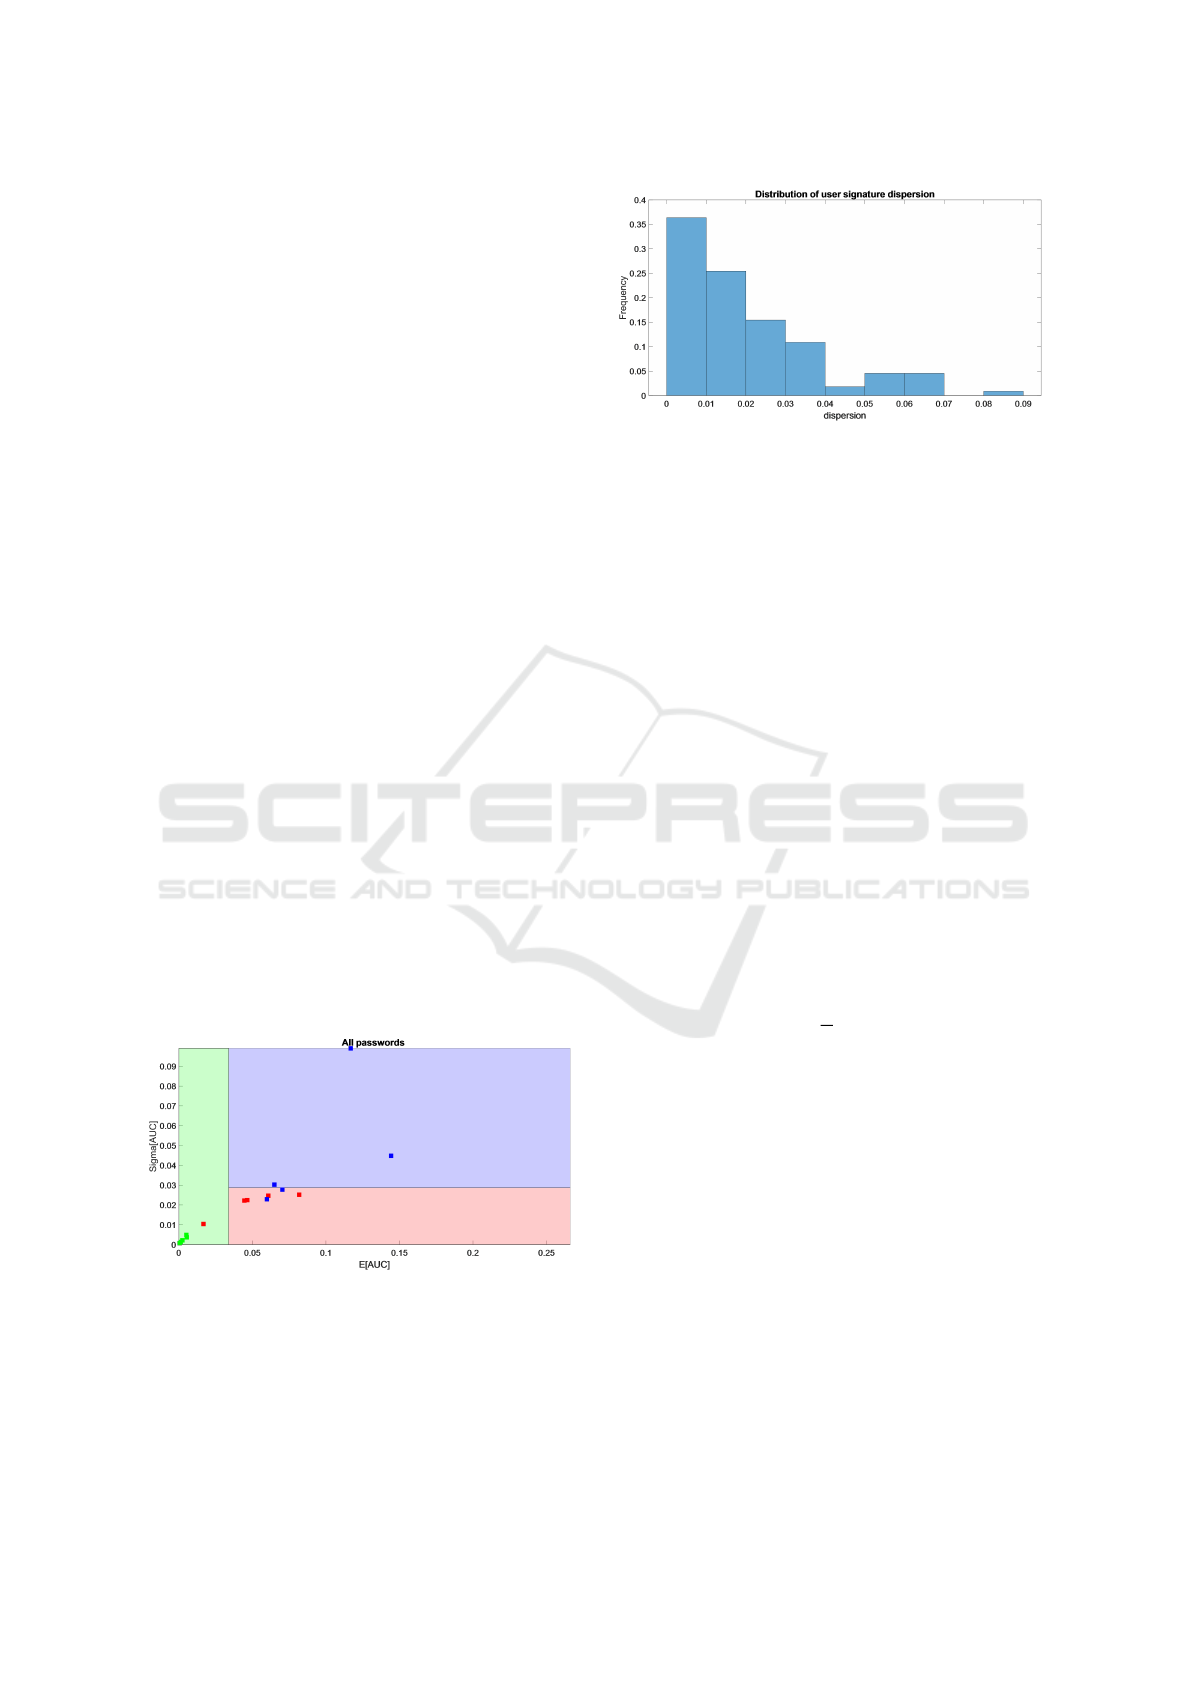
menagerie is rather clear. Figure 3 presents the dis-
tribution of the dispersion measure of users signature
for the 5 passwords. The dispersion measure com-
putes the average distance of users signature with its
average value. As it can be seen, the dispersion is low
showing in general a good stability.
Figure 2: Illustrations of 3 user signatures for the 5 pass-
words.
5.3 Validation Process
The validation process is very important for user clas-
sification within the Doddington menagerie. The
Figure 3: Distribution of the dispersion measure of users
signature.
main problem is that there is no ground truth like in
many machine learning problems. In most of stud-
ies in the literature (Poh, 2010; Ross et al., 2009;
Mhenni et al., 2018), the efficiency of user classifi-
cation is demonstrated by obtaining different perfor-
mances for each predicted class (i.e. sheeps have bet-
ter performance than goats). In this work, we can use
an additional information and concerns the biomet-
ric samples for different users on different data. We
have no ground truth but under our assumption, a user
classified as a goat should be affected in this class for
all data. In the GREYC-NISLAB dataset, we have
5 passwords typed by the same users. We can thus
compute a consensus value between all passwords for
user classification. For each user, we apply the pro-
posed method for the 5 passwords. A majority vote is
then applied to define the consensus class with a con-
fidence index (CI). As for example, a user could be
affected to the goat class with a confidence CI=60%
(meaning that for 3 passwords among 5, the user has
been affected to this class). We then propose a global
metric called Global Consensus Rate (GSR) as:
GSR =
1
P
P
∑
i=1
CI(i) (5)
Where P is the number of individuals in the dataset
(here P=110). Note that CI is normalized by the num-
ber of available data (here 5 passwords).
5.4 Results
Table 1 provides the GSR values for the 3 matching
algorithms (defined by equations 1 to 3) and the two
scenarios (for the choice of the reference). We can see
first that the GSR value is quite stable for all match-
ing algorithms. This is an important result, it confirms
our assumption that user classification is not related to
the used matching algorithm. Second, the two testing
scenarios permit to obtain very similar results. Con-
sidering we have processed keystroke dynamics data
that are less stable than morphological biometric data,
reaching GSR ' 80% is a good result.
Classifying Biometric Systems Users among the Doddington Zoo: Application to Keystroke Dynamics
751

Table 1: Value of the consensus value (GSR) for the 3
matching algorithms and for the 2 scenarios.
Matching Scenario 3/5 Scenario 3/10
S
1
79,8% 78,9%
S
2
80,4% 80,4%
S
3
79,4% 78,7%
We tried to improve the previous results by optimizing
the decision thresholds. The question we wanted to
answer is to know if it was possible to define common
values of T
1
and T
2
for the 5 passwords. We tested dif-
ferent threshold values between the minimal and max-
imal values for the 5 passwords. Table 2 presents the
obtained results by optimizing the thresholds. Note
that we used the testing scenario 3/10 as we saw pre-
viously that there was no difference with the other.
We obtain a nice gain of the GSR value showing that
it is possible to enhance slightly the performance of
the proposed method.
Table 2: Value of the consensus value (GSR) for the 3
matching algorithms with optimized thresholds.
Matching algorithm GSR value
S
1
82.4%
S
2
83,6%
S
3
82.7%
6 CONCLUSION AND
PERSPECTIVES
In this work, we addressed the problem of user clas-
sification in the biometric menagerie. Such a method
could have many applications in biometrics mainly to
adapt the processing in function of the behavior of the
user while using a biometric system. The proposed
approach is based on the definition of a signature re-
lated to the stability and performance associated to a
user. The proposed framework makes it possible to
predict user class in an operational mode by a sim-
ple decision rule. Obtained results on a keystroke dy-
namics dataset composed of biometric data for dif-
ferent passwords permits to measure the consensus of
the prediction. We obtained quantitative results up-
per than 82%. Perspectives of this study concern the
application of the proposed method on other biomet-
ric modalities. We believe that the Doddington zoo is
particularly interesting for behavioral ones. We also
intend to apply the prediction results to enhance/adapt
the performance of biometric systems.
REFERENCES
Barron, U. G., Corkery, G., Barry, B., Butler, F., McDon-
nell, K., and Ward, S. (2008). Assessment of reti-
nal recognition technology as a biometric method for
sheep identification. Computers and electronics in
agriculture, 60(2):156–166.
Blanco-Gonzalo, R., Sanchez-Reillo, R., Liu-Jimenez, J.,
and Sanchez-Redondo, C. (2017). How to assess user
interaction effects in biometric performance. In 2017
IEEE International Conference on Identity, Security
and Behavior Analysis (ISBA), pages 1–6. IEEE.
Doddington, G., Liggett, W., Martin, A., Przybocki, M.,
and Reynolds, D. (1998). Sheep, goats, lambs and
wolves: A statistical analysis of speaker performance
in the nist 1998 speaker recognition evaluation. Tech-
nical report, National Inst of Standards and Technol-
ogy Gaithersburg Md.
Gaines, R. S., Lisowski, W., Press, S. J., and Shapiro, N.
(1980). Authentication by keystroke timing: Some
preliminary results. Technical report, Rand Corp
Santa Monica CA.
Giot, R., El-Abed, M., and Rosenberger, C. (2011).
Keystroke dynamics authentication. In Biometrics,
page chapitre 8. InTech.
Idrus, S. Z. S., Cherrier, E., Rosenberger, C., and Bours, P.
(2013). Soft biometrics for keystroke dynamics. In
International Conference Image Analysis and Recog-
nition, pages 11–18. Springer.
Kirchgasser, S. and Uhl, A. (2016). Biometric menagerie
in time-span separated fingerprint data. In 2016 Inter-
national Conference of the Biometrics Special Interest
Group (BIOSIG), pages 1–7. IEEE.
Lopes Silva, P., Luz, E., Moreira, G., Moraes, L., and
Menotti, D. (2019). Chimerical dataset creation proto-
col based on doddington zoo: A biometric application
with face, eye, and ecg. Sensors, 19(13):2968.
Mhenni, A., Cherrier, E., Rosenberger, C., and Amara, N.
E. B. (2018). Adaptive biometric strategy using dod-
dington zoo classification of user’s keystroke dynam-
ics. In 2018 14th International Wireless Communi-
cations & Mobile Computing Conference (IWCMC),
pages 488–493. IEEE.
Migdal, D. (2019). Contributions to keystroke dynamics for
privacy and security on the Internet. PhD thesis, Nor-
mandie Universit
´
e.
Morales, A., Fierrez, J., and Ortega-Garcia, J. (2014). To-
wards predicting good users for biometric recognition
based on keystroke dynamics. In European Confer-
ence on Computer Vision, pages 711–724. Springer.
Phillips, P. J., Martin, A., Wilson, C. L., and Przybocki, M.
(2000). An introduction evaluating biometric systems.
Computer, 33(2):56–63.
Poh, N. (2010). User-specific score normalization and fu-
sion for biometric person recognition. Advanced Top-
ics in Biometrics, 16:401–418.
Ross, A., Rattani, A., and Tistarelli, M. (2009). Exploiting
the “doddington zoo” effect in biometric fusion. In
2009 IEEE 3rd International Conference on Biomet-
SECRYPT 2021 - 18th International Conference on Security and Cryptography
752

rics: Theory, Applications, and Systems, pages 1–7.
IEEE.
Tan, B., Lewicke, A., Yambay, D., and Schuckers, S.
(2010). The effect of environmental conditions and
novel spoofing methods on fingerprint anti-spoofing
algorithms. In 2010 IEEE International Workshop on
Information Forensics and Security, pages 1–6. IEEE.
Teli, M. N., Beveridge, J. R., Phillips, P. J., Givens, G. H.,
Bolme, D. S., and Draper, B. A. (2011). Biometric
zoos: Theory and experimental evidence. In 2011
International Joint Conference on Biometrics (IJCB),
pages 1–8. IEEE.
Yager, N. and Dunstone, T. (2008). The biometric
menagerie. IEEE transactions on pattern analysis and
machine intelligence, 32(2):220–230.
Classifying Biometric Systems Users among the Doddington Zoo: Application to Keystroke Dynamics
753
