
Improved Software Product Reliability Predictions using Machine
Learning
Sanjay Joshi
1,*
and Yogesh Badhe
2,*
1
Quality & Ops Excellence, Persistent Systems Ltd., Kashibai Khilare Street, Pune, India
2
Data Practice Group, Persistent Systems Ltd., Kashibai Khilare Street, Pune, India
Keywords: Software Reliability, SonarQube, Empirical Study, Experimentation, Correlation, Software Product,
Reliability Prediction, Post-delivery Defects, Skill Level, Review Efficiency.
Abstract: Reliability is one of the key attributes of software product quality. Popular software reliability prediction
models are targeted to specific phases of software product development life cycle. After studying, reliability
models, authors could conclude that they have limitations in predicting software product reliability. A recent
industrial survey performed by the authors identified several factors which practitioners perceived to have
influence in predicting reliability. Subsequently authors conducted set of experiments to find out influential
factors to reliability. In this paper, authors presented model definition approach using most influential
parameters such as review efficiency, skill level of developer/tester and post-delivery defects.
1 INTRODUCTION
An accurate prediction of reliability is very important
factor in today's software product industry (Sandeep
Krishnan et. al., 2011), particularly at later stages of
development. For getting competitive edge, better
market acceptability and wider usage in high integrity
or critical applications domains, reliability plays
crucial role (Dandan Wang et. al., 2012). It also helps
software industry in taking decision regarding
investment in software products. It is important from
user's perspective too. Reliability can be obtained
throughout life cycle of product development.
Analysis of reliability can be performed at various
stages and corrective action can be taken based on the
goal set for software product reliability. Authors
studied more than 25 reliability models referred in
software industry spanning over last 15 years (Bora
Caglayan et. al., 2011).
However, these models have limitations while
predicting software reliability for released products
(M. R. Lyu, 2017). This may be due to availability of
limited operational metrics data at the time of
software development or due to incomplete visibility
of user environment. While describing reliability,
defects in each phase of development and post-
delivery defects play important role. In fact, defect
identification is very essential step in getting
*
https://www.persistent.com
reliability value for any product. However, it should
be separated from reliability measurement.
For defining reliability model, first essential step
is to get baseline reliability in current set up. Authors
found that SonarQube can be used for baselining
reliability (Javier Garca-Munoz et. al., 2016).
However, the proper identification of defects is also
one of the essential steps in deriving reliability
(Hiroyuki Okamura et. al., 2006). Recently authors
published paper on mapping reliability models on
software development life cycle phases (Sanjay L.
Joshi et. al., 2017).
This paper contains section 1 on intoduction.
Section 2 gives background of study conducted. In
section 3, initial experiments are described under
experiment framework heading, which is essential to
identify probable input parameters making inpact on
reliability. Section 4 talks about model definition,
which includes data consolidation and visual analysis.
It further gives details of imputation performed on
input parameters identified in previous section. They
are skill level, review efficiency and post delivery
defects. Section 4 also talks about data processing
and derivation of equation for post delivery defects
and reliability. Section 5 describes about model
validation and section 6 gives the comparison details
with basic musa model. Section 7 talks about
conclusion dervied.
Joshi, S. and Badhe, Y.
Improved Software Product Reliability Predictions using Machine Learning.
DOI: 10.5220/0010576102450252
In Proceedings of the 16th International Conference on Software Technologies (ICSOFT 2021), pages 245-252
ISBN: 978-989-758-523-4
Copyright
c
2021 by SCITEPRESS – Science and Technology Publications, Lda. All rights reserved
245

2 BACKGROUND
Initial study of SRM (software reliability models)
helped authors in mapping different models on
software development life cycle (Sanjay L. Joshi et.
al., 2017). While for second step of field survey,
authors used questionnaires for different roles such as
project managers, testers, designers. It helped in
preparing further roadmap of deriving model
equations for software product reliability (Sanjay L.
Joshi et. al., 2017). Profile and background of
individual interviewee participating in the survey was
taken into consideration before conducting survey
(Sanjay L. Joshi et. al., 2017). It was based on
experience of different stakeholders working in
software product domain. Based on analysis of data,
it was concluded that parameters such as skill level of
developer and tester, post-delivery defects and review
efficiency during software development life cycle
may contribute to reliability (Sanjay L. Joshi et. al.,
2017). Analysis was performed using statistical
techniques. Chi2 test and regression analysis was
performed. Based on this analysis, authors could also
eliminate (or at least keep on backstage) some
parameters such as performance metrics, process
metrics, domain, hardware, and technology in
predicting reliability. During field survey, external
and internal validation study were performed (Judea
Pearl et. al., 2014).
Prediction of product reliability is more realistic
at the end of testing phase. Due to this, reliability
model was targeted addressing testing phase. Weibull
model, Jelinski Moranda model, Musa basic model
and GO model are falling in this category (Sanjay L.
Joshi et. al., 2017).
Experimentation was performed to confirm
critical input factor contributing to reliability of
software product (Christopher M. Lott et. al., 1996).
3 EXPERIMENT FRAMEWORK
Experimentation was initial step in the process of
deriving prediction model. For performing
experiments (Victor R. Basili, 1986), lab facility at
BITS Pilani, K K Birla Complex, Goa and at
Persistent Systems Ltd., Goa were used, which were
having terminals (B.A. Kitchenham ,2002) with
similar configurations. For example, to identify the
impact of skill on reliability, an application was
chosen. Design document was provided to all
developers. Since we wanted to check the impact of
skill on reliability, other parameters such as design
complexity, technology, domain, review efficiency
and other identified input parameters were kept
constant. Reliability data was collected with
compilation error free code.
Thus, for performing the experiments, one factor
was kept “variable" and other factors as constants,
such that the impact of individual factors (David
Card, 2004) on overall reliability can be
quantitatively analysed (M. Staron, 2008).
SonarQube was used for baselining reliability value
of the code developed (Javier Garca-Munoz et. al.,
2016).
To statistically conclude, more than 30 data points
were recorded for each domain/ application.
Minimum 50K lines of code was considered as
threshold for considering application for
experimentation. Authors performed experiments on
125 applications from different domains and
technologies.
With the help of this experiments, authors could
eliminate (or at least keep on backstage) some
parameters such as process metrics (Schedule
Variance, Effort Variance and Productivity), Unit
Test defects, Integration Test defect, System Test
defects (M. Staron et. al., 2008). While other
parameters were making impact on reliability from
less significant to large significant. Authors observed
that skill level of developers/ testers and review
efficiency are major contributors while post-delivery
defects were good /indicator of product reliability.
4 MODEL DEFINITION
For reconfirming influential factors, experiments
were performed on different software products.
Products were selected from real wide spectrum of
domains such as medical (critical applications),
health care, finance, entertainment, mobile
application, cloud computing, utility, enterprise
application etc. Typical examples were Risk Tracker
(AE_V1.0) having sub modules such as risk
capturing, messaging, data management and report
management. It was having high design complexity.
While eFinance (MWM_V1.0) was having data
management and report generation as sub modules. It
was having average design complexity. Photozoom
was having low design complexity and having
submodules as photo processing, post processing.
ECG Management (CP_V1.0) was having very high
design complexity while Patient monitoring
application (CP_V1.0.1) with submodules such as
administrator, master database, system database, UI
module and report module was having high design
ICSOFT 2021 - 16th International Conference on Software Technologies
246

complexity. Risk Tracker, eFinance and Patient
Monitoring was web-based application while Photo
zoom was mobile app. ECG management was cloud
and mobile based application. Besides above,
different other applications were taken for performing
experiments from different domains/ technologies.
For maintaining confidentiality, authors have
given alternate names to products /applications
mentioned in this paper. These products are delivered
from small scale organizations to large scale
organizations from different countries across the
globe to their customers/ users.
4.1 Data Collection & Consolidation
Identification and collection of raw data was done
using different tools such as Jira, RTC (Rational
Team Concert), TFS (Team Foundation Server) or
Microsoft Project Plan (MPP) (Aleksandar Dimov et.
al., 2010). While skill level related data was captured
using resource database of respective industry.
Review efficiency was calculated based on defects
captured in one phase vis a vis defects captured in
subsequent phases due to “that” phase. During data
collection step, post-delivery defects were captured
from the field after release of product (Pankaj Jalote
et. al., 2008). Overall review efficiency was obtained
by taking product of review efficiency at each phase.
The scale for skill level (this is associated with
technology) was identified between “0” to “10”. The
skill level “0” was considered as “No skill” (where
person is not skilled in respective technology) and
“10” being expert. Skill level was measured based on
number of years of experience and test score. For
benchmarking purpose, reliability is obtained using
SonarQube.
For applying regression algorithms, data should
be available in 2D format only. Excel was used for
performing this activity.
4.2 Visual Analysis
Data visualization uses statistical graphics, plots,
information graphics and other tools. During this step
the information is communicated clearly and
effectively. Using statistical tool (R), output can be
obtained in graphical format (i.e., either in 2D or 3D
format).
The outcome of field survey and controlled
experiments indicate that skill level and review
efficiency is having high correlation with reliability.
Authors also observed very high correlation factor
between “reliability” and post-delivery defects".
Based on that, two general equations were defined as:
PDD = f (skill level, Review Efficiency) (1)
Reliabilit
y
=
f
(PDD, Time) (2)
Where PDD = Post Delivery Defects
To simplify processing of data, reliability
class/ranges were identified. The skill level was
identified on the scale of 0 to 10. While review
efficiency was identified on the scale of 0 to 100.
Post-delivery defects were identified as absolute
figures.
4.3 Imputation
Regression algorithms being mathematical
formulations cannot handle missing values
inherently. During imputation, missing figures can be
added in 2D or 3D format and Statistical tool (R) can
be used, and further trend analysis can be done.
4.3.1 Skill Level (Sk)
While capturing data, few cells were blank since no
skill level was associated with reliability range. For
certain reliability range there were no skill levels
associated with or there were few cells, which were
having more than one of skill level assigned. For a
cell having more than one skill level assigned,
representation of skill level was obtained by
calculating an average. However, for blank skill level,
it is essential to perform imputation. Skill levels are
captured for different technologies such as C#, ASP,
Sharepoint and Java. The imputation graph was
plotted, and equation was derived depicting the
relation between skill level and reliability. It was
observed that the reliability is directly proportional to
skill level.
The equation obtained was as follows:
Skill Level = 10- 0.3625
0.0075*reliability
(3)
4.3.2 Review Efficiency (R
e
)
Review efficiency was calculated based on ability of
identifying defects without allowing them to pass to
next phase. Imputation technique is applied for
review efficiency and equation was derived as:
R
e
= 25.11 ln(Reliability) +227.15 (4)
4.3.3 Post Delivery Defects (PDD)
Post-delivery defects were reported from the field.
Same principle of taking average was made
Improved Software Product Reliability Predictions using Machine Learning
247

applicable to post-delivery defects. Imputation is
applied to PDD and equation was derived as:
PDD = 3.6243 ln (Reliabilit
y
) - 10.657 (5)
4.4 Data Processing
Authors could reconfirm that the relation exists
between skill level, review efficiency and post-
delivery defects with different sets of products and
applications and further could conclude that post-
delivery defects are indicative figure of reliability.
Authors performed regression analysis for estimating
the relationships among reliability, post-delivery
defects, skill level and review efficiency. Further
obtained residual output, which is a useful class of
techniques for the evaluation of the goodness of a
fitted model.
During raw data processing, each cell was
representing reliability versus skill level or post-
delivery defects or review efficiency data. Two-
dimensional table was prepared such that no cell will
remain without value as mentioned earlier.
Visualization analysis is next step of data
processing. Based on two-dimensional table, skill
level versus reliability graph was plotted. Visual
analysis helps in understanding the behaviour of
parameter on X axis vis a vis parameter on Y axis.
The graphs were plotted for different technologies
such as C#, ASP, Sharepoint, Java etc.
The visual analysis showed that defects were
more during initial phase and then reduce over the
period. It also indicates that irrespective to any
technology, this trend holds good. In other words,
reliability increases with time. This might be due to
reducing number of defects reported in application or
software product. Reliability (scaled) value was
obtained by multiplying floating value to reliability
(average) value such that reliability (scaled) was
normalized in the range of 0 to 100. While performing
this, there was high possibility that few values may be
out of range. But those were considered as extreme
values and ignored.
After visual analysis, parameter transformation
was performed. Parameter transformation is essential
since values obtained using statistical technique
should be meaningful to users. For example, if value
of review efficiency is more than 100 then it should
be considered as 100.
Exponential transformation formula is applied
such that values of reliability and review efficiency
will get mapped to respective scale. For skill data, the
scale is considered from 0 to 10. Transformed
parameters henceforth denoted with subscript ‘t’ e.g.,
Re
t
stands for transformed value of Review efficiency
and Sk
t
stands for transformed value of skill level.
4.4.1 Equation for Post Delivery Defects
Regression analysis is done with skill level and
review efficiency as X factor and post-delivery
defects as Y factor and summary output consists of
ANOVA and coefficient table was obtained. The
sample regression statistics output for C# based
application shows that (Claes Wohlin et. al., 2000)
intercept (constant) is 1.57. While coefficient for
review efficiency is 49.93. The coefficient for skill
level is -1.08. From these coefficients, regression
equation was derived. This was performed for
different applications with different domains and
technologies. During this step, scaled value of post-
delivery defects and predicted value of post-delivery
defects are taken for performing “t test”. The result of
“t test” showed that the correlation factor was in the
range of 0.95 to 0.97 in most of the applications and
value of p was less than 0.05. Standard error for
intercept coefficient and skill level parameters were
found less. The “t test” output also showed that the
probability is 0.0011 (for two tailed test). The fit plot
was obtained for predicted post-delivery defects
versus actual post-delivery defects. It proved that
predicted post-delivery defects and actual post-
delivery defects for different technologies such as C#,
Java, ASP.NET, Sharepoint were close to each other.
These steps were also performed for object-
oriented programming-based applications, covering
50+ applications and found that the equations are
close to each other. Equation 6 indicates relationship
between review efficiency, skill level and post-
delivery defects for C# technology.
PDD=ln[a*Re
t
+ b * Sk
t
+ c]*10 (6)
In equation 6, PDD is post-delivery defects, R
e
is
review efficiency and S
k
is average skill level of
coders and testers in respective technology.
Summary output of regression statistics gives
coefficient a, b and c of equation 6. It was also
observed that for different technologies, R2 value was
in the range of 0.92 to 0.97, which indicated that trend
is matching. Std error was in the range of 0.011 to 0.2.
while P test value was in the range of 0.01 * e-12 to
0.05* e-12. It further supports our observation that
the post-delivery defects obtained from proposed
equation and actual post-delivery defects obtained are
going hand in hand for wide range of applications.
With above steps, authors could conclude that
there is no gap between actual reliability value and
predicted reliability value. Pearson correlation factor
ICSOFT 2021 - 16th International Conference on Software Technologies
248
supports this statement. “t test” results show that
probability value is greater than 95 percent, which
implies that the probability of getting predicted value
near to actual value of reliability is very high.
Similarly, coefficients were obtained for different
technologies by using applications developed in
ASP.NET, Sharepoint and Java.
Authors found that Intercept coefficient is in the
range of 1.18 to 1.62. Coefficient for review
efficiency is varying from 41.56 to 54.21, covering
majority of technologies in different domains.
4.4.2 Equation for Reliability
To derive reliability equations, two scenarios were
treated separately. It indicates that p (two tailed test)
is 0.0075 for C# application, which indicates that the
probability of getting actual reliability near predicted
is very high and it is supplemented by Pearson
correlation coefficient, which is 0.9857. In this case,
the time value should be measured from the time of
release. For each month, reliability value is obtained.
Reliability (derived) is calculated to scale it between
0 to 100 percent. Predicted reliability is obtained by
running script [ y~ f (x, a, b)] in R.
For equation 7, coefficient a and b were obtained
as 0.003693 and 3.845490, respectively. It was
observed that post-delivery defects (PDD) were
reducing as time elapses. Due to this, “Time/PDD”
factor was considered for deriving reliability equation
(equation 7). It was assumed that the process of
rectification was not introducing more defects.
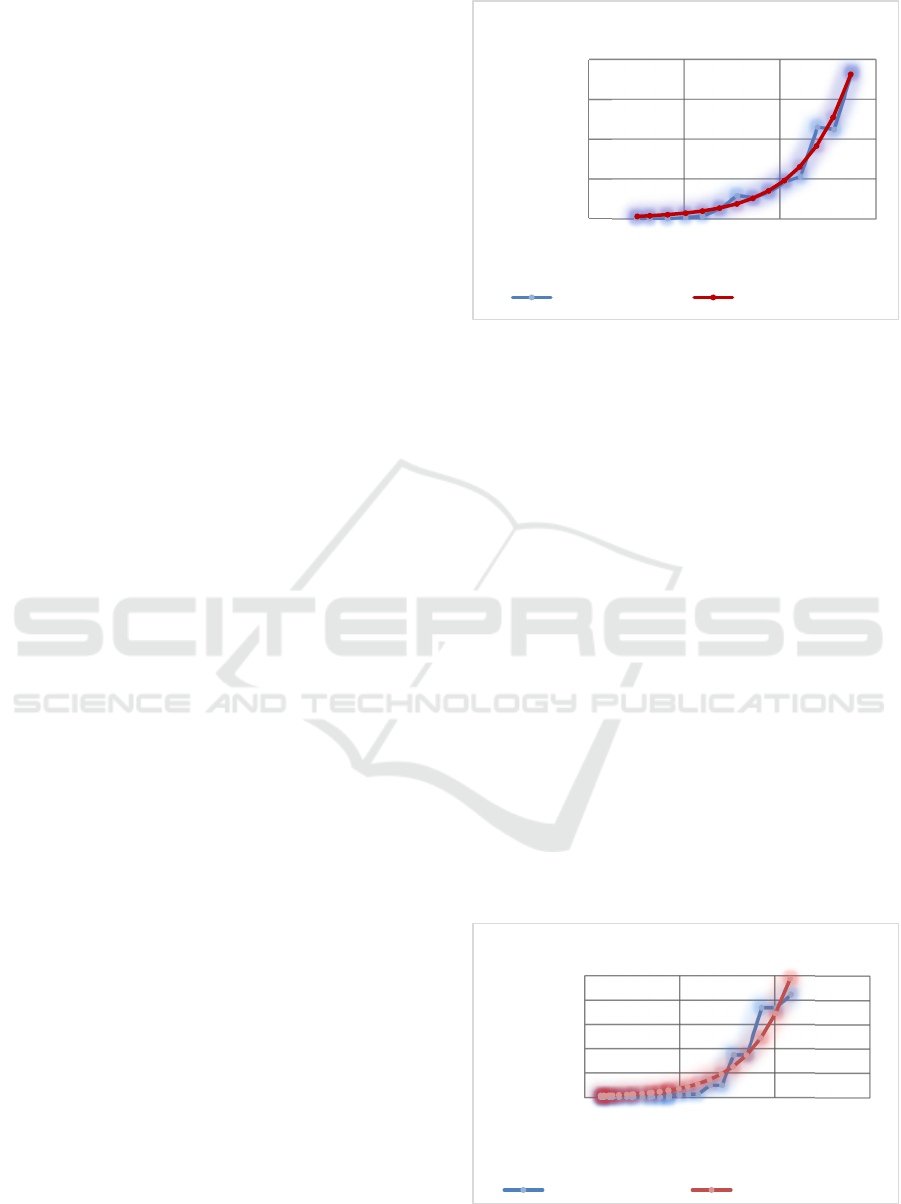
Figure 4 shows the graph of “Reliability versus Time/
post-delivery defect" for scenario 1.
It indicates that reliability was increasing with
time factor in scenario 1. Refer Figure 1.
Similarly, for scenario 2, reliability factor was
obtained with scaling. R script [y~ f (x, a, b)] was run
to get coefficients a and b in equation. Refer Figure 2.
It indicates graph for reliability versus Time/Post-
delivery defects for scenario 2. The output of R tool
shows that “a” and “b” coefficient obtained from the
script were in the range of 1.1 e-05 to 1.3 e-05 and 3
e+01 to 5 e+01 respectively for C# based applications
in equation 7. In the sample taken, post-delivery
defects show decreasing trend after 15th week of
product release. If it changes later or earlier then
corresponding values of “a” and “b” will vary
substantially. The general equation for scenario 1 and
scenario 2 can be derived as reliability equation
below.
Reliability= a * e
b * (time / PDD)
(7)
Figure 1: Reliability versus Time/PDD Graph (Scenario 1).
The “t test” is performed to check the relation
between predicted reliability and actual reliability for
both scenarios.
The outcome of “t test” for scenario 2 indicates
Pearson correlation coefficient values were in the
range of 0.96 to 0.97. It implied good correlation
between actual reliability and predictable reliability.
The value of p was found in the range of 0.013 to
0.015. It indicates high probability in the range of
(100 - 1.3 = 98.7) to (100 – 1.5= 98.5). It means
values of predicted post-delivery defects with actual
post-delivery defects are close to each other.It was
observed that in the equation 7, a constant "a" varies
in the range of 0.003 to 0.004.
While constant "b" varies from 3.5 to 4.0 for
scenario 1 for C# based in medical application
domain. It was observed that constant "a" was varying
in the range of 1.0 e-05 to 1.5 e-05 while constant "b"
was varying between 3.0 e+01 to 5.0 e+01 for
scenario 2.
Thus, authors found that the values of “a” and “b”
are varying within certain range for different
applications.
Figure 2: Reliability versus Time/PDD Graph (Scenario 2).
0,00E+00
2,00E-01
4,00E-01
6,00E-01
8,00E-01
00,511,5
Reliability
Time/PDD
Regression Fit Chart (Scenario 1)
Actual Reliability Predicted Reliability
0,00E+00
2,00E-01
4,00E-01
6,00E-01
8,00E-01
1,00E+00
0,14 0,19 0,24 0,29
Reliability
Time/PDD
Regression Fit Chart (Scenario 2)
Actual Reliability Predicted Reliability
Improved Software Product Reliability Predictions using Machine Learning
249
5 MODEL VALIDATION
The purpose of validation is to ensure that reliability
model meets the operational needs of the user.
Release wise data was captured for post-delivery
defects, review efficiency and skill level.
Post-delivery defects data was captured month
wise or on weekly basis. Post-delivery defect data
was verified before performing “t test” and
establishing relationship between skill level, review
efficiency and post-delivery defects. By performing
“t test" and running R command or /script, actual
reliability (derived from post-delivery defects) was
compared with predicted reliability.
Fit chart was plotted to check the variation of
predicted reliability with respect to actual reliability
obtained from the field. Other parameters such as
Pearson's coefficient, probability factors were used
for validating the outcome. While performing
validation coverage was considered as main criteria.
Above mentioned process was performed on different
products. For example, MWM 1.0 was a sample
product, which is finance domain-based application.
Analysis of MWM 1.0 product (sample) data shows
that Pearson coefficient is 0.942826. It indicates that
high correlation (Maiwada Samuel et. al., 2015)
exists between actual reliability and predicted
reliability. Residual standard error was 0.1378 on 15
degrees of freedom, which indicates that the predicted
data was near to actual data and p (Two tailed test)
value is 0.047, which gives probability of holding the
validation true is (100- 4.73) = 95.26. Summary of
validation performed on few products is shown in
table 1. Thus, validation was performed on more than
100 products having different design complexities &
domains and results were validated.
Table 1: Validation Summary.
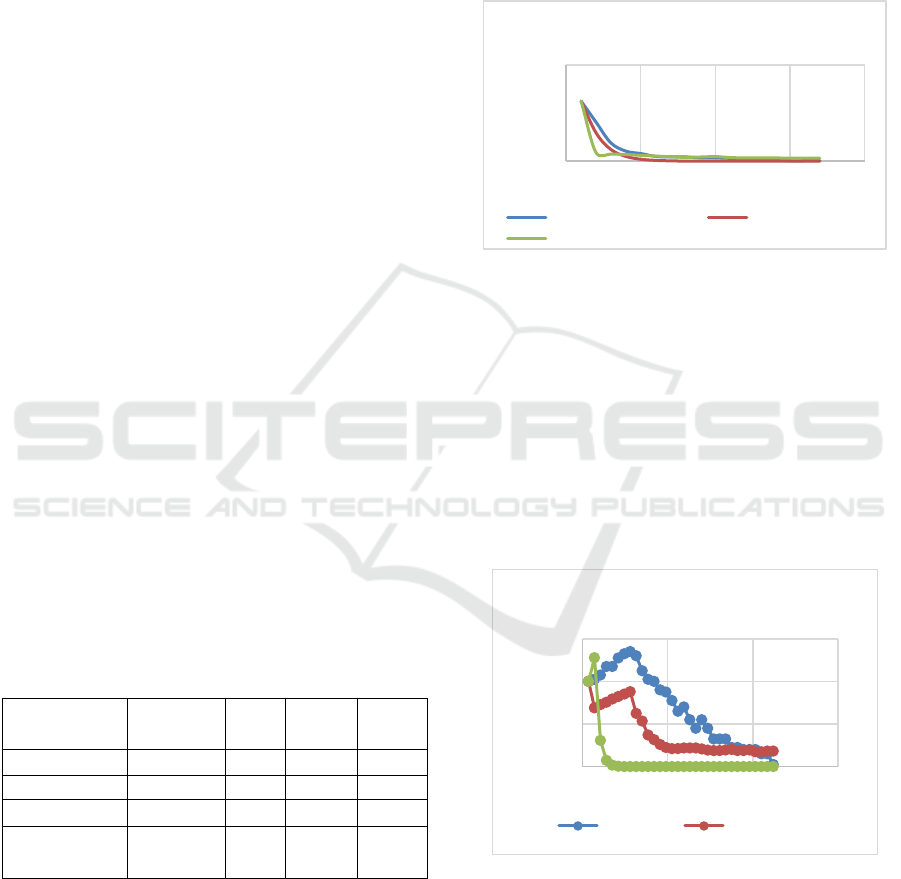
Product Ver. Corr. P value Result
eFinance MWM1.0 0.94 0.02 Yes
Life Science CP 1.0 0.95 0.03 Yes
Entertainment LPROD 1.0 0.92 0.01 Yes
Risk
Management
AE1.0 0.98 0.01 Yes
6 COMPARISON WITH MUSA
MODEL
The comparison of proposed model with Musa model
was performed (John D Musa et. al., 1989). Musa
model is chosen for comparison since this model is
basic model and it is associated with testing phase,
associated defects, and defect rate, which is like
proposed model.
In the Figure 3 and Figure 4, the graphs show that
proposed model is closer to actual values of defects
as compared to Musa model for larger time span for
scenario 1 and 2 respectively.
Figure 3: Comparison of proposed model with Musa model
(Scenario 1).
Author performed comparison with 95+ products
and found that statement about average standard error
was much more for Musa model as compared to
proposed model.
In scenario 1, standard error was found in the
range of 0.70 to 0.78. While in proposed model, it was
0.27 to 0.37. In scenario 2, for Musa Model, standard
error was in the range of 0.90 to 0.97. While for
Scenario 2, proposed model, standard error was in the
range of 0.37 to 0.47.
Figure 4: Comparison of proposed model with Musa model
(Scenario 2).
7 CONCLUSIONS
It was observed that reliability measurement at each
phase of software development life cycle is possible.
0,00
200,00
0 5 10 15 20
Post Delivery Defects
Days
Comparison of Models
(Scenario1 - Set 1)
Defects Musa Model
Proposed Model
0,00
20,00
40,00
60,00
0 100 200 300
Post Delivery Defects
Hours
Comparison of Models
Scenario 2 - Set 1
Defects Proposed Model
ICSOFT 2021 - 16th International Conference on Software Technologies
250

However, it does not represent the reliability of final
product.
During physical survey and experiments study, it
was observed that the skill level, review efficiency
and post-delivery defects are highly correlated with
reliability. By performing experiments, authors could
re-confirm that most influential parameters for
reliability are skill level, review efficiency and post-
delivery defects. These experiments were performed
in different technologies and domains. For the getting
equation for post-delivery defects, the relationship
was established between skill level, review efficiency
and post-delivery defects. While for getting equation
of reliability, it was based on two scenarios. In the
first scenario, post-delivery defects were reducing
from date of release of product. While in second
scenario, it was increasing initially and then
decreasing. Both equations were validated on more
than 50 products and found encouraging results.
Comparison of proposed model output shows that
introduction of skill level and review efficiency add
value in getting more realistic reliability value as
compare to other models in similar category. Though
authors have derived reliability based on post-
delivery defects data, it is quite clear that reliability
can be defined from requirement phase of
development life cycle. For example, based on
requirement defects data, one can obtain reliability of
requirement document, which is product of
requirement phase. If the defects are high, then
reliability will be less. For requirement phase, skill
level of requirement capturing / development is
essential. Review efficiency for requirement
document can contribute to overall reliability factor.
On similar note, it can be made applicable to
design (architecture), coding phases also. In other
words, software industry should be able to predict or
estimate reliability at each phase of development.
Software industry can take decision of go or no go
based on how much returns they predict on
investment done through product development.
In future, model should be developed, which can
give complete reliability chart for any product right
from the requirement phase to release phase.
Depending upon market situation and acceptability of
product in the market, software industry can also take
decision of further investment in the product or
discontinue the product to target more lucrative
segment area or product.
REFERENCES
Sandeep Krishnan, Robyn and Katerina (2011). Empirical
Evaluation of Reliability Improvement In An Evolving
Software Product Line ", MSR'11, Proceedings of the
8th Working Conference On Mining Software
Repositories.
Dandan Wang, Qing Wang, Zhenghua Hong, Xichang
Chen, Liwen Zhang, Ye Yang (2012). Incorporating
Qualitative and Quantitative Factors for Software
Defect Prediction, EAST' 12 Proceedings of the 2nd
International Workshop On Evidential Assessment Of
Software Technologies.
Bora Caglayan, Ayse Tosun, Andriy Miransky, Ayse Bener
and Nuzio Ruffolo (2011). Usage of multiple prediction
models based on different defect categories, 2nd
International Workshop on Emerging Trends in
Software Metrics.
M. R. Lyu (2017). Software Reliability Engineering: A
Roadmap. In Future of Software Engineering. IEEE
Computer Society, Washington, DC, USA.
Javier Garca-Munoz, Marisol Garca-Valls and Julio
Escribano-Barreno (2016). Improved Metrics Handling
in SonarQube for Software Quality Monitoring,
Distributed Computing and Artificial Intelligence, 13th
International Conference.
Hiroyuki Okamura, Tadashi Dohi (2006). Building phase-
type software reliability model. In: Proc. 17th
International Symposium on Software Reliability
Engineering (ISSRE 2006).
Sanjay L. Joshi, Bharat Deshpande, Sasikumar Punnekkat
(2017). Do Software Reliability Prediction Models
Meet Industrial Perceptions?, Empirical Software
Engineering, Volume 1, Proceedings of the 10th
Innovations in Software Engineering Conferences.
Sanjay L. Joshi, Bharat Deshpande, Sassikumar Punnekkat
(2017). An Industrial Survey on Influential of Process
and Product Attributes on Software Product
Reliability", NE-TACT, ISBN No.: 978-1-5090-6590-5.
Judea Pearl, Elias Bareinboim, (2014). External validity:
From “Do-calculus to transportability across
populations". Statistical Science.
Christopher M. Lott, H. Dieter Rombach (1996).
Repeatable Software Engineering Experiment for
Comparing defect detection technique, Empirical
Software Engineering, Volume 1,
https://link.springer.com/journal/10664/1/3/page/1
Issue 3.
Victor R. Basili, Richard W. Selby and David. Hutchens
(1986). Experimentation in Software Engineering,
IEEE Transactions on software engineering, Vol SE-
12, No.7.
B.A. Kitchenham, S. L. Peeger, L. M. Pickard, P.W. Jones,
D.C. Hoaglin, El K. Emam, Rosenberg, J.Preliminary
(2002). Guidelines for empirical research in software
engineering; IEEE Transactions on Software
Engineering, Vol. 28, No. 8.
M. Staron and W. Meding (2008). “Predicting weekly
defect inflow in large software projects based on project
Improved Software Product Reliability Predictions using Machine Learning
251

planning and test status,” Information and Software
Technology, vol. 50, no. 7-8.
David Card (2004), Statistical techniques for software
engineering practice, Proceedings – 26th International
Conference on Software Engineering, DOI:
10.1109/ICSE.2004.1317505.
Aleksandar Dimov, Senthil Kumar Chandran, Sasikumar
Punnekkat (2010). “How Do We Collect Data for
Software Reliability Estimation?, International
Conference On Computer Systems and Technologies
(CompSysTech).
Pankaj Jalote, Bredan Murphy (2008). Post Release
Reliability Growth in Software Product, ACM
Transactions On Software Engineering And
Methodology (TOSEM), Volume 17, Issue 4, Article
No. 17.
Claes Wohlin, Per Runeson, Martin Höst, Magnus Ohlsson,
Bjorn Regnell, Anders Wesslén (2000).
Experimentation in Software Engineering - An
Introduction; Kluwer Academic Publishers.
Maiwada Samuel and Lawrence Ethelbert Okey (2015).
The Relevance and Significance of Correlation in
Social Science Research, International Journal of
Sociology and Anthropology Research, Vol.1, No.3.
John D. Musa, Anthony Iannino, Kazuhira Okumoto
(1989). Software Reliability: Measurement, Prediction,
Application, McGraw- Hill.
ICSOFT 2021 - 16th International Conference on Software Technologies
252
