
Comparing Support Vector Machine and Neural Network Classifiers
of CVE Vulnerabilities
Grzegorz J. Blinowski
a
, Paweł Piotrowski and Michał Wiśniewski
Institute of Computer Science, Warsaw University of Technology, Nowowiejska 15/19, 00-665 Warszawa, Poland
Keywords: Internet of Things, Internet of Things Security, System Vulnerability Classification, CVE, Neural Networks,
Support Vector Machine.
Abstract: The Common Vulnerabilities and Exposures (CVE) database is the largest publicly available source of
structured data on software and hardware vulnerability. In this work, we analyze the CVE database in the
context of IoT device and system vulnerabilities. We employ and compare support vector machine (SVM)
and neural network (NN) algorithms on a selected subset of the CVE database to classify vulnerability records
in this framework. Our scope of interest consists of records that describe vulnerabilities of potential IoT
devices of different types, such as home appliances, SCADA (industry) devices, mobile controllers,
networking equipment and others. The purpose of this work is to develop and test an automated system of
recognition of IoT vulnerabilities to test two different methods of classification (SVM and NN) and to find
an optimal timeframe for training (historical) data.
1 INTRODUCTION AND
BACKGROUND
1.1 IoT Applications and Architecture:
An Outline
IoT can be most broadly defined as an interconnection
of various uniquely addressable objects through
communication protocols. It can also be described as a
communication system paradigm in which the objects
of everyday life (or industrial devices), equipped with
microcontrollers, network transmitters, and suitable
protocol stacks that allow them to communicate with
one another and (via ubiquitous cloud infrastructure)
with users, become an integral part of the Internet
environment (Atzori et al., 2010). The scope of IoT
deployments is wide and covers areas such as (Da Xu
et al., 2014; Al-Faquaha et al., 2015) home appliances
("smart homes"), smart cities, smart environments
(monitoring), smart agriculture and farming, smart
electricity grids, smart manufacturing and industrial
security and sensing as IIoT (Industrial IoT), and smart
healthcare. In this work, we will consider an IoT model
compatible with the reference architecture model
proposed by the EU FP7 IoT-A project (EU FP7, 2007)
and the IoT-A tree structure (Bauer et al., 2013) that
a
https://orcid.org/0000-0002-0869-2828
consists of three major levels:
Perception and execution layer
Network layer
Cloud or application layer.
1.2 Security Issues with IoT Systems
In this work we will focus on threats against IoT
systems, which occur when a flaw in an IoT device or
application, on the perception, network or cloud level,
is exploited by a hacker, and the device or application
is compromised – i.e. full or limited access to
functions and data is gained by an attacker.
In (Ling et al., 2018), the authors have proposed
five "dimensions" of IoT security: hardware,
operating system/firmware, software, networking,
and data. The majority of security problems emerging
in today’s IoT systems result directly from buggy,
incomplete, or outdated software and hardware
implementations in the perception layer, especially in
home and office appliances and in industrial systems.
Typical vulnerabilities in this layer emerge from
common stack or heap overrun in legacy software,
weak (and often built-in) passwords (such was the
case in the famous Mirai botnet (Antonakakis et al.,
2017)), and faulty pairing and binding
implementation. Major protocol flaw design error
734
Blinowski, G., Piotrowski, P. and Wi
´
sniewski, M.
Comparing Support Vector Machine and Neural Network Classifiers of CVE Vulnerabilities.
DOI: 10.5220/0010574807340740
In Proceedings of the 18th International Conference on Security and Cryptography (SECRYPT 2021), pages 734-740
ISBN: 978-989-758-524-1
Copyright
c
2021 by SCITEPRESS – Science and Technology Publications, Lda. All rights reserved

(such as Heartbleed and DROWN (Durumeric et al.,
2014; Aviram et al., 2016)) is much rarer as a cause
for vulnerabilities but also happens. The most
common vulnerabilities are summarized in the
OWASP Top 10 list (OWASP 2021).
1.3 Scope of This Work and Related
Research
In this work, we propose a classification of device-
related (i.e. not “pure software”) vulnerability data for
IoT and IIoT equipment. We have divided
vulnerability descriptors from the Common
Vulnerability and Exposures (CVE) public database
into 7 distinct categories, including home equipment,
SCADA devices, and networking systems. The
database samples were hand-classified by us based on
our expert knowledge. We used this data to train
neural network (NN) and support vector machine
(SVM) classifiers to predict categories of “new”
vulnerabilities – for example, data from the year 2018
was used to classify 2019’s data, etc. The rationale
behind such predictions is to prevent and mitigate
threats resulting from new vulnerabilities, as when a
new vulnerability or exploit is discovered, it is often
critical to learn its scope by automatic means as fast
as possible. This is a difficult task given the size of
the database and the rate of its growth – each day tens
of new records are added to the CVE database alone.
AI based classification tools operating on the similar
principles to the ones proposed by us can be used to
filter incoming vulnerability data with respect to
given organization’s network and user infrastructure.
Such solutions are part of software tools supporting
SOC's (Security Operating Centers), and also
emerging SOAR solutions (Security Orchestration,
Automation and Response).
Prior research on automatic analysis and
classification of vulnerability databases includes the
following: models and methodologies of categorizing
vulnerabilities from the CVE database according to
their security types based on Bayesian networks
(Wang and Guo, 2010; Na et al., 2016); in (Neuhaus
and Zimmermann, 2010) topic models were used to
analyze security trends in the CVE database with no
prior (expert) knowledge; and Huang et. al. (Huang et
al., 2019) proposed an automatic classification of
records from the Network Vulnerability Database
(NVD) based on a NN – the authors compared their
model to Bayes and k-nearest neighbor models and
found it superior. Inspired by the above mentioned
research we have decided to employ two most
promising methods: SVM and neural networks. All of
the research cited above focused on categorizing the
software aspect of vulnerabilities, such as SQL
injection, race condition, and command shell injection.
In our previous related work (Blinowski and
Piotrowski, 2020), we discussed CVE classification
with an SVM. Here, we extend this research to include
a neural network classifier. According to our
knowledge, no prior work has been done regarding
categorizing the impacted equipment – system or
device – and our work tries to address this gap.
This paper is organized as follows: in section 2,
we describe the contents and structure of the CVE
database and NVD records. In section 3, we introduce
our proposed classes of IoT devices and we briefly
discuss SVM and NN classifier methods and the
measures used by us to test the quality of the
classifiers. In section 4, we present the results of the
classification. Our work is summarized in section 5.
2 STRUCTURE AND CONTENTS
OF CVE DATABASE
2.1 The CVE Database
In this work, we used an annotated version of the
CVE database known as the NVD, which is hosted by
the National Institute of Standards and Technology
(NIST). The NVD is created on the basis of
information provided by the CVE database hosted at
MITRE (Mitre, 2020). CVE assigns identifiers (CVE-
IDs) to publicly announced vulnerabilities. NIST
augments the CVE database with information such as
structured product names and versions, and also maps
the entries to CWE names. The NVD feed is provided
both in XML and JSON formats structured in year-
by-year files as a single whole-database file and as an
incremental feed reflecting the current year’s
vulnerabilities.
The fields NVD record fields that are relevant for
further discussion are as follows:
entry contains
record ID as issued by MITRE – the
id is in the form
CVE-yyyy-nnnnn (e.g. CVE-2017-3741) and is
commonly used in various other databases, documents,
etc. to refer to a given vulnerability;
vuln identifies
software and hardware products affected by a
vulnerability – this record contains the description of a
product and follows the specifications of the Common
Platform Enumeration (CPE) standard (see section
2.2);
vuln:cvs and cvss:base_metrics describe
the scope and impact of the vulnerability, and this data
allows real-world consequences of the vulnerability to
be identified; and
vuln:summary holds a short
informal description of the vulnerabilities.
Comparing Support Vector Machine and Neural Network Classifiers of CVE Vulnerabilities
735

2.2 Common Platform Enumeration
(CPE)
CPE is a formal naming scheme for identifying
applications, hardware devices, and operating
systems. CPE is part of the Security Content
Automation Protocol (SCAP) standard (NIST, 2020),
The CPE naming scheme is based on a set of
attributes called Well-Formed CPE Name (WFN)
compatible with the CPE Dictionary format (NIST
CPE, 2020). The following attributes are part of this
format: part, vendor, product, version, update,
edition, language, software edition, target software,
target hardware, and other (not all attributes are
always present in the CPE record; very often “update”
and the attributes that follow are omitted).
The CVE database uses URI format for CPE,
and we will only discuss this format. For example, in
the CPE record
cpe:/h:d-link:dgs-1100-05:- ,
the attributes are as follows:
part:h (indicating
hardware device),
vendor:d-link, product:dgs-
1100-05, and version and the following attributes are
not provided. In the NIST CVE records, logical
expression built from CPE descriptors are used to
indicate sets of affected software and/or hardware
platforms. An example is given in Figure 1.
<vuln:vulnerable-configuration
id="http://nvd.nist.gov/">
<cpe-lang:fact-ref name="cpe:/o:
d-link:dgs-1100_firmware:1.01.018"/>
<cpe-lang:logical-test operator="OR"
negate="false">
<cpe-lang:fact-ref name="cpe:/h:
d-link:dgs-1100-05:-"/>
<cpe-lang:fact-ref name="cpe:/h:
d-link:dgs-1100-10mp:-"/>
</cpe-lang:logical-test>
</vuln:vulnerable-configuration>
Figure 1: A vulnerable configuration record from CVE – a
logical expression built from CPE identifiers.
3 CVE DATA CLASSIFICATION
AND ANALYSIS
3.1 Data Selection
From the NVD database, we extracted only records
marked in their CPE descriptor as “hardware”. We
assumed that they potentially reflected IoT and IIoT
connected devices from the perception or network
layer. The exact criterion was as follows: if any of the
descriptor in the vuln:vulnerable-configuration
section contained the “part” attribute set to “h”, then
the record was selected for further consideration. We
also narrowed down the timeframe to data from the
years 2010–2019 (data from the first quarter of 2019
was taken into account).
We grouped the selected records into 7 distinct
classes:
H – home and SOHO devices; routers, on-line
monitoring.
S – SCADA and industrial systems,
automation, sensor systems, non-home IoT
appliances, cars and vehicles (subsystems), and
medical devices.
E – enterprise and service provider (SP)
hardware (routers, switches, enterprise Wi-Fi,
and networking) – the network level of IoT
infrastructure.
M – mobile phones, tablets, smart watches, and
portable devices – these constitute the
“controllers” of IoT systems.
P – PCs, laptops, PC-like computing
appliances, and PC servers (controllers).
A – other, non-home appliances: enterprise
printers and printing systems, copy machines,
non-customer storage, and multimedia
appliances.
The rationale behind such classification is the
following: from the security point of view, the key
distinction for an IoT component is the scope of its
application (home use, industrial use, network layer,
etc.). The number of classes was purposefully low –
we were limited by the description of the available
data, so it would have been difficult to use a finer-
grain classification. Additionally, it would not be
practical to introduce too many classes with a small
number of members because the automatic
classification quality would suffer. Table 1 shows the
total number of records and number in classes in the
2010 – 2020 (Q1) timespan. The NVD database is
distributed as XML and JSON feeds. In addition,
there is an on-line search interface. The database, as
of the beginning of 2020, contains over 120 000
records in total, and the number of records usually
increases year by year. The NVD database is neither
completely consistent nor free of errors. For example,
two problems are a lack of CPE identifier (in approx.
900 records) and inconsistencies with the CPE
dictionary (approx. 100 000 CPEs). Binding between
the vulnerability description and the product
concerned may also be problematic. Product names
containing non-ASCII or non-European characters
also pose a problem, as they are recoded to ASCII
often inconsistently or erroneously. Essentially, it is
SECRYPT 2021 - 18th International Conference on Security and Cryptography
736

impossible to extract data relating to web servers,
home routers, IoT home appliances, security cameras,
cars, SCADA systems, etc. without a priori
knowledge of products and vendors.
Table 1: Number of NVD records pre year – total and in
classes.
Year Total Number in class
A CE H M PS
2010 185 6 2 113 28 21 2 13
2011 148 4 2 107 21 6 4 4
2012 288 7 2 180 27 15 9 48
2013 417 8 7 236 84 14 4 64
2014 391 3 0 189 102 16 0 81
2015 386 3 2 174 99 40 8 60
2016 463 6 13 150 75 80 7 132
2017 813 1 26 151 371 94 21 150
2018 1629 64 206 258 582 103 26 390
Q1 2019 400 6 16 193 83 22 7 73
3.2 Data Analysis Methodology
We tested two types of classifiers: (1) a linear SVM
(Vapnik, 1998) and (2) a Neural Net. The same set of
data, i.e. selected attributes of “hardware”
vulnerability records extracted from the NVD
database, was used for training. The feature vector
contained: vendor name, product name and other
product data from CPE (if supplied), and CWE
vulnerability description.
The steps of the process of building a classifier
are the following: 1. pre-processing input data
(removal of stop-words, lemmatization, etc.); 2.
feature extraction, i.e. conversion of text data to
vector space via bag-of-words format; and 3. training
the linear SVM or NN. The length of the feature
vector varied from 1998 to 9911 depending on the
training data time period.
SVN Classifier. We used a standard linear SVM,
which computes the maximum margin hyperplane
that separates the positive and negative examples in
feature space. With the SVM method, the decision
boundary is not only uniquely specified, but statistical
learning theory shows that it yields lower expected
error rates when used to classify previously unseen
examples (Vapnik, 1998; Liu et al., 2010), i.e. it gives
good results when classifying new data. We used
Python with NLTK to pre-process the text data and
SVM and classification quality metrics routines from
scikit-learn libraries.
NN Classifier. The number of network inputs is equal
to the size of the feature vector, the number of outputs
is equal the number of classes. In the last step of data
preparation, we used the term frequency-inverse
document frequency (TF-IDF) technique for data
representation. In TF IDF, we “reward” the words
that occur frequently in a given document but are rare
in others, we use TFIDF on all analyzed text tokens
together. We also used hyperparameter optimization
to tune the NN – we use: 0, 1 or 2 hidden layers, with:
16, 32 or 64 neurons in the layer, we also use 50 – 150
optimization algorithm rounds (epochs). We adjust
other network parameters too, namely: type of the
weight optimizer algorithm, neuron dropout ratio and
some others. For this we employed the GridSearchCV
package. The simulator is written in Python with
scikit-learn, TensorFlow, Keras and Google
Colaboratory libraries. As the volume of training and
validating data is relatively low, we used K-folds
cross validation to optimize the network.
3.3 Classification Measures
To benchmark the classification results, we used two
standard measures: precision and recall. We defined
precision (eq. (1)) as the ratio of true positives to the
sum of true positives and false positives; we defined
recall (eq. (2)) as the ratio of true positives to the sum
of true positives and false negatives (elements
belonging to the current category but not classified as
such.) Finally, as a concise measure, we used the F1
score – eq. (3). The F1 score can be interpreted as a
weighted average of precision and recall, where an F1
score reaches its best value at 1 and worst at 0.
𝑝𝑟𝑒𝑐𝑖𝑠𝑠𝑖𝑜𝑛 =
𝑇𝑃
(𝑇𝑃 + 𝐹𝑃)
(1)
𝑟𝑒𝑐𝑎𝑙𝑙 =
𝑇𝑃
(𝑇𝑃 + 𝐹𝑁)
(2)
𝐹1 = 2 ∗
∗
()
(3)
4 CLASSIFICATION RESULTS
We tested both classifiers on historical data in one
year intervals. We took into account data from the
timeframe of 2010–2019. For example, to classify
data from 2018, we used records from the following
ranges: 2010–2017, 2011–2017, … and finally only
from 2017. The size of the training and testing data is
given in Table 1. Due to limited space, below we will
present the results of classification for data from 2018
and 2019.
Comparing Support Vector Machine and Neural Network Classifiers of CVE Vulnerabilities
737
SVN-2017 SVN-2012-2017
NN-2017 NN-2012-2017
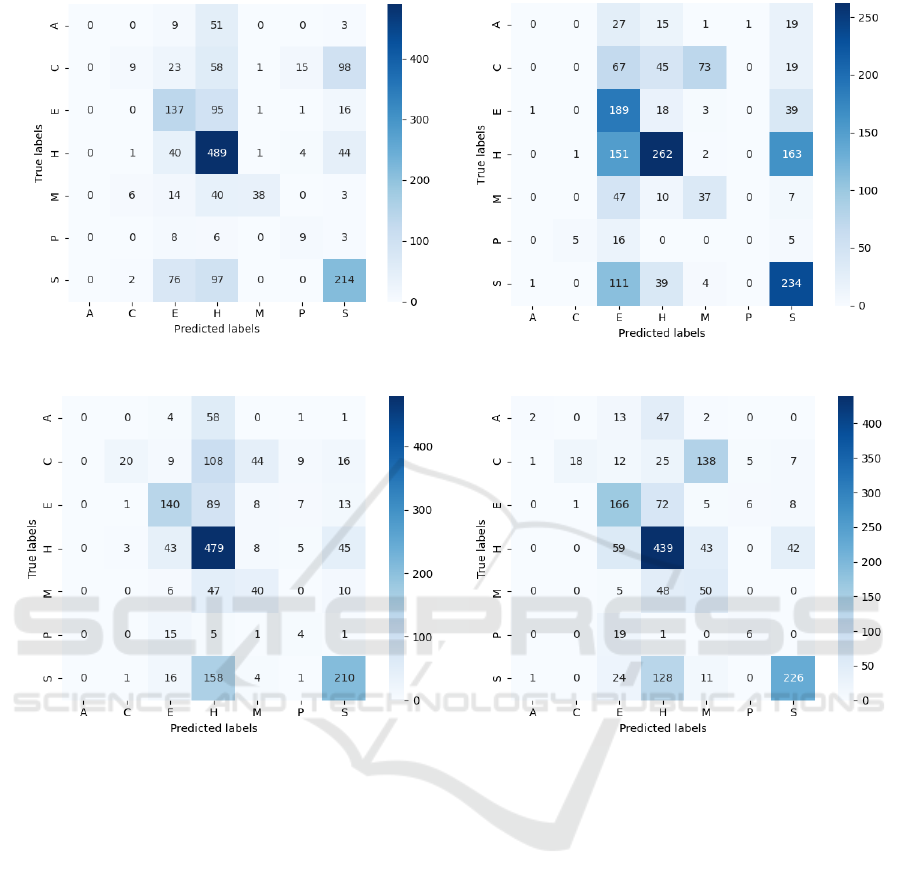
Figure 2: NN and SVN Classification of records from 2018. Left – training data from 2017, right – training data from 2012
to 2017.
In Figure 2, we show the confusion matrices for
the classification of 2018’s records trained using data
ranging from 2012 to 2017 and using data from 2017
alone. From a good classifier, we would expect the
majority of records to be on the diagonal. For the
SVN classifier (top row of Figure 2), we can state that
a larger set of training data (i.e. going back further in
time) reduces the quality of the classification. For
example, for "H" class, we have 489 records
classified correctly (84% recall value) when data
from only 2017 is used for training, but only 262
(45%) when we train using a dataset from 2012–2017.
Classification results from other periods (Blinowski
and Piotrowski, 2020) confirm this trend. For NNs
(bottom row of Figure 2), the case is different: there
is no obvious bias towards better classification results
obtained from shorter or longer historical data.
However, if we analyze weighted precision, recall,
and F1 for NN (Figure 3), we can conclude that using
more historical data increases the quality of the
classification.
Further, from the results shown in Figure 3, we
can conclude that the NN classifier gives slightly
better results in terms of all measures. For NN, the
measures are almost stable, with F1 ranging from
58% to 61%, and the trend that using more historical
data is beneficial is visible. For SVN on the other
hand, the conclusion is more complex: there is an
improvement in classification measures if data from
2016–2017 is used, but classification degrades if
older data is taken into account. Similar conclusions
can be drawn for classified data from 2019 (Figure 4).
Again, the NN classifier gives better and more stable
results than SVN (F1 in the range of 69%–74%), and
SECRYPT 2021 - 18th International Conference on Security and Cryptography
738
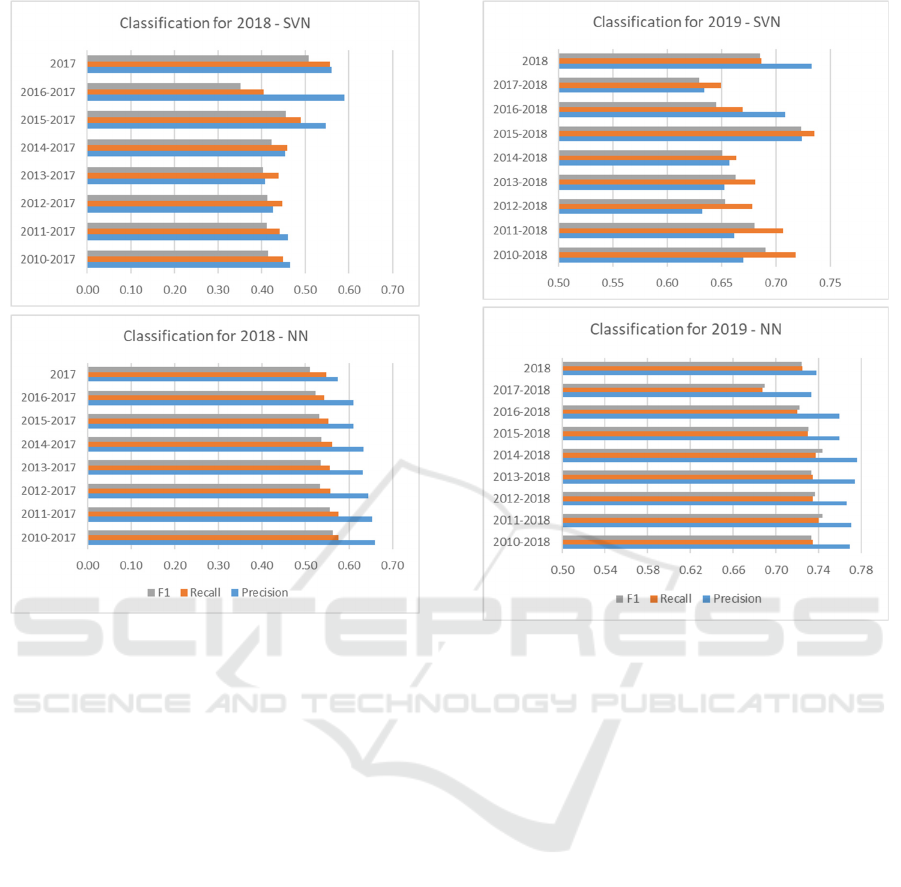
Figure 3: Weighted precision, recall, and F1 for 2018
records based on training data from 2010–2017, 2011–
2017, etc. Top – SVN, bottom – NN.
using more (older) training data is almost always
beneficial. For SVN, F1 varies from 63% to 72%. In
general, NN gives slightly better classification results
than SVM. We should also note that results presented
in Figure 3 and Figure 4 show precision, recall, and
F1 measures weighted with support (the number of
true instances for each label).
Here, we refer the reader to consult full datasets
of this study (http://www.ii.pw.edu.pl/~gjb/
CVE_IoT2020/results.zip), where we show precision
and recall rates of up to 80% for strongly populated
categories and of approx. 50% or lower for less
numerous categories.
5 SUMMARY
We have proposed a system of automatic
classification of IoT device vulnerabilities listed in
the public CVE/NVD databases. We have divided
vulnerability records into 7 distinct categories
relating to the devices’ field of usage. The hand-
classified database samples were used to train SVM
Figure 4: Weighted precision, recall, and F1 for 2019
records based on data from 2010–2018, 2011–2018, etc.
Top – SVN, bottom – NN.
and NN classifiers to predict categories of “new”
vulnerabilities. The purpose of the classification was
to predict, prevent, and mitigate unknown threats
resulting from newly discovered vulnerabilities.
Given the size and the rate of growth of the public
vulnerability database and the requirement for a rapid
response to new data, this is a task that cannot be done
by hand and must be automated. We attained
weighted classification precision and recall rates of
55%–70% – with better measures for the NN
classifier. These are not ideal results, and in practice
they would require further human intervention
(verification and possibly reclassification). The
problem lies with the data itself – neither CVE nor
CPE provide enough specific data for the NN or SVM
to discern record categories. An additional
vulnerability ontology should be introduced to extend
the information currently provided. This should
include more precise vendor and model data. A
similar conclusion, not directly related to IoT
security, was suggested in (Syed, 2016), where the
authors propose a unified cybersecurity ontology that
incorporates heterogeneous data and knowledge
Comparing Support Vector Machine and Neural Network Classifiers of CVE Vulnerabilities
739

schemas from different security systems. It is also
worth mentioning that our method can also be used
on numerous other on-line vulnerability databases
such as those managed by companies (e.g. Microsoft
Security Advisories, Tipping Point Zero Day
Initiative, etc.), national CERTs, or professionals’
forums (e.g. Exploit-DB and others). It may also be
worthwhile to integrate information from various
databases – this should increase the precision of the
classification and is a topic of our further research.
REFERENCES
Al-Fuqaha, A., Guizani, M., Mohammadi, M., Aledhari,
M., & Ayyash, M. (2015). Internet of things: A survey
on enabling technologies, protocols, and applications.
IEEE communications surveys & tutorials, 17(4), 2347-
2376.
Antonakakis, M., April, T., Bailey, M., Bernhard, M.,
Bursztein, E., Cochran, J., ... & Zhou, Y. (2017).
Understanding the mirai botnet. In 26th {USENIX}
security symposium ({USENIX} Security 17) (pp. 1093-
1110).
Atzori, L., Iera, A., & Morabito, G. (2010). The internet of
things: A survey. Computer networks, 54(15), 2787-
2805.
Aviram, N., Schinzel, S., Somorovsky, J., Heninger, N.,
Dankel, M., Steube, J., ... & Shavitt, Y. (2016).
{DROWN}: Breaking {TLS} Using SSLv2. In 25th
{USENIX} Security Symposium ({USENIX} Security
16) (pp. 689-706).
Bauer, M., Bui, N., Jardak, C., & Nettsträter, A. (2013). The
IoT ARM reference manual. Enabling Things to Talk,
213.
Blinowski, G. J., & Piotrowski, P. (2020, June). CVE based
classification of vulnerable IoT systems. In
International Conference on Dependability and
Complex Systems (pp. 82-93). Springer, Cham.
Da Xu, L., He, W., & Li, S. (2014). Internet of things in
industries: A survey. IEEE Transactions on industrial
informatics, 10(4), 2233-2243
Durumeric, Z., Li, F., Kasten, J., Amann, J., Beekman, J.,
Payer, M., ... & Halderman, J. A. (2014, November).
The matter of heartbleed. In Proceedings of the 2014
conference on internet measurement conference (pp.
475-488).
EU FP7 (2007). The 7th Framework Programme funded
European Research and Technological Development
from 2007 until 2013; Internet of Things and Future
Internet Enterprise Systems; https://ec.europa.eu/
transport/themes/research/fp7_en, last accessed:
01.03.2021
Huang, G., Li, Y., Wang, Q., Ren, J., Cheng, Y., & Zhao,
X. (2019). Automatic classification method for
software vulnerability based on deep neural network.
IEEE Access, 7, 28291-28298.
Ling, Z., Liu, K., Xu, Y., Gao, C., Jin, Y., Zou, C., ... &
Zhao, W. (2018). Iot security: An end-to-end view and
case study. arXiv preprint arXiv:1805.05853
Liu, Z., Lv, X., Liu, K., & Shi, S. (2010, March). Study on
SVM compared with the other text classification
methods. In 2010 Second international workshop on
education technology and computer science (Vol. 1, pp.
219-222). IEEE.
MITRE. (2020). CVE Common Vulnerabilities and
Exposures database, https://cve.mitre.org/, last
accessed: 02.01.2020
Na, S., Kim, T., & Kim, H. (2016, November). A study on
the classification of common vulnerabilities and
exposures using naïve bayes. In International
Conference on Broadband and Wireless Computing,
Communication and Applications (pp. 657-662).
Springer, Cham.
Neuhaus, S., & Zimmermann, T. (2010, November).
Security trend analysis with CVE topic models. In 2010
IEEE 21st International Symposium on Software
Reliability Engineering (pp. 111-120). IEEE.
NIST. (2020). Security Content Automation Protocol v 1.3,
https://csrc.nist.gov/projects/security-content-
automation-protocol/, Created December 07, 2016,
Updated August 07, 2020, last accessed 02.01.2021.
NIST CFP. (2020). Official Common Platform
Enumeration (CPE) Dictionary, https://csrc.nist.gov/
Projects/Security-Content-Automation-Protocol/Speci
fications/cpe, Created December 07, 2016, Updated
August 07, 2020, last accessed 02.01.2021.
OWASP Top Ten Project. (2021). https://owasp.org/www-
project-top-ten/; last accessed: 01.03.2021
Syed, Z., Padia, A., Finin, T., Mathews, L., & Joshi, A.
(2016). UCO: A unified cybersecurity ontology. UMBC
Student Collection.
Vapnik, V. (1998). Statistical learning theory, New York.
NY: Wiley.
Wang, J. A., & Guo, M. (2010, April). Vulnerability
categorization using Bayesian networks. In
Proceedings of the sixth annual workshop on cyber
security and information intelligence research (pp. 1-
4).
SECRYPT 2021 - 18th International Conference on Security and Cryptography
740
