
Inferring Flow Table State through Active Fingerprinting in SDN
Environments: A Practical Approach
Marcin Gregorczyk
a
and Wojciech Mazurczyk
b
Warsaw University of Technology, Institute of Computer Science, Warsaw, Poland
Keywords:
SDN, Software-defined Networking, Security, Flow Table, Overflow Attack, Active Fingerprinting.
Abstract:
Software-Defined Networking (SDN) is currently a popular and heavily investigated concept, e.g., in cloud
computing. Despite its obvious benefits, the decoupling of the control and data planes brings new security
risks. One of the major threats is overflow attack, which can lead to network instability. To perform it in an
efficient manner, an attacker needs to infer the flow table state, and for this purpose, typically fingerprinting
techniques are utilized. In this paper, first, we prove that the previously proposed fingerprinting method
exhibits major limitations. Then, building upon the existing solution, we propose an improved attack technique
which is able to predict the flow table state with more than 99% prediction accuracy. Moreover, our solution
has additional advantages over state-of-the-art solutions, i.e., it is adaptive and robust, thus it is suitable for
real-world applications. Finally, we also discuss potential countermeasures that can be used to thwart such
threats.
1 INTRODUCTION
Software-defined Networking (SDN) paradigm
changes the view on networking, e.g., in the current
data centers or other environments where cloud
computing is heavily utilized (Kreutz et al., 2015).
The main characteristic feature of SDN, i.e., the
decoupling of the control and data planes, offers
an opportunity of using network equipment in a
more programmable way. Note that, in traditional
environments, switches and routers are standalone
devices, which typically make all decisions based on
the static configuration. However, in SDN, a central
entity, i.e., the controller decides what happens with
each traffic type and steers the switch how it should
handle it (Kreutz et al., 2015). This is achieved by
controlling the switch flow table so it forwards the
network traffic to the proper destination. If a received
packet does not match any rule defined on the switch,
additional communication between the switch and
the controller must occur. The controller may decide,
e.g., to install a new flow in the switch flow table for
such traffic. However, if the flow table is full, extra
messages must be exchanged between the switch and
the controller to remove one of the existing flows and
a
https://orcid.org/0000-0002-1108-2780
b
https://orcid.org/0000-0002-8509-4127
install the new one. Note that an attacker may exploit
such a flow table management process. If he uses
active fingerprinting methods, it is possible, based
on the response to the artificial traffic, to deduce the
size of the switch flow table and its current utilization
rate. Such a technique is feasible because depending
on whether a specific flow exists in the flow table or
if the flow table is full or not, the system performance
differs. Flow table size and its current utilization
rate are internal SDN characteristics and should
be considered as confidential information and thus
not revealed to the public. However, if an attacker
is able to infer the flow table state, it can use this
information to perform a carefully crafted flow table
overflow attack (Zhou et al., 2018). This may cause
the instability of the overloaded systems and their
unpredictability. Finally, the decreased performance
can inflict additional delays, which may negatively
influence real-time applications such as Voice over
IP (VoIP) or videoconferencing. Moreover, overflow
attacks are especially dangerous for devices with
limited resources, i.e., those that can afford only
limited memory resources to store the flow table.
This includes, for example, Internet of Things (IoT)
equipment as it is predicted that SDN will enrich
such application scenarios in the near future (Li et al.,
2020; Flauzac et al., 2015). In effect, for devices
with a small flow table size, such an attack will be
576
Gregorczyk, M. and Mazurczyk, W.
Inferring Flow Table State through Active Fingerprinting in SDN Environments: A Practical Approach.
DOI: 10.5220/0010573905760586
In Proceedings of the 18th International Conference on Security and Cryptography (SECRYPT 2021), pages 576-586
ISBN: 978-989-758-524-1
Copyright
c
2021 by SCITEPRESS – Science and Technology Publications, Lda. All rights reserved
especially dangerous as it will be much easier to
overwhelm the flow table with the precisely crafted
traffic. In (Ahmed et al., 2020) and (Yu et al., 2020),
the authors propose methods to infer the SDN internal
parameters, while (Xie et al., 2021) introduces the
table overflow Low Rate Denial of Service Attack
(LDoS) attack countermeasure. There are also other
solutions which focus on detecting and mitigating
attacks on SDN and its internal parameters (Baidya
and Hewett, 2019; Wu and Chen, 2020; Nallusamy
et al., 2020; Nurwarsito et al., 2020). However,
their major drawback is that they were created and
evaluated in a simulated environment (typically
Mininet
1
), and thus they may not be applicable to
real-world scenarios.
Considering the above, in this paper, our main
novel contributions are to:
• experimentally demonstrate that the currently ex-
isting solutions to infer the flow table state exhibit
limitations and cannot be applied in practical SDN
environments;
• propose a novel attack technique which relies on
active fingerprinting and algorithms for peak and
level-shift detection, which makes it more robust
and adaptive;
• experimentally evaluate the proposed approach
in the practical testbed using real-world software
products currently popularly used in SDN setups.
The rest of the paper is structured as follows. Sec-
tion 2 outlines the assumed attack scenario. In Section
3, the experimental testbed and methodology are de-
picted. Results from the experimental evaluation are
presented in Section 4, while in Section 5 we discuss
potential countermeasures. Finally, Section 6 con-
cludes our work.
2 ATTACK SCENARIO
In this paper, we consider an attacker trying to in-
fer the flow table state to perform a carefully crafted
overflow attack to disrupt the SDN-based network.
To determine the size and utilization rate of the flow
table, an attacker uses an active fingerprinting tech-
nique. To be effective, the malicious party needs to
understand how the OpenFlow-based communication
is performed. This is explained in detail below.
In the SDN environment, the controller installs
a set of rules on a switch. If the incoming traf-
fic matches one of the installed flows, it will be au-
tonomously forwarded to the proper destination. Such
1
http://mininet.org
a process is fast, as it does not involve any additional
steps. We will denote the time needed for such an
operation as T1. However, if the received network
traffic does not match any rule, it must be sent to the
controller for inspection. Then, the controller may de-
cide to install an appropriate rule for such traffic. Un-
fortunately, additional processing will consume more
time (T2) than in the former case. Likewise, if the
flow table is already full, the controller will have to
decide which flow should be removed, send such in-
formation to the switch, and finally install a new flow.
This process will consume even more time (T3). Note
that using carefully crafted traffic and by measuring
the processing time needed to handle the traffic, an
attacker may be able to accurately deduce the flow ta-
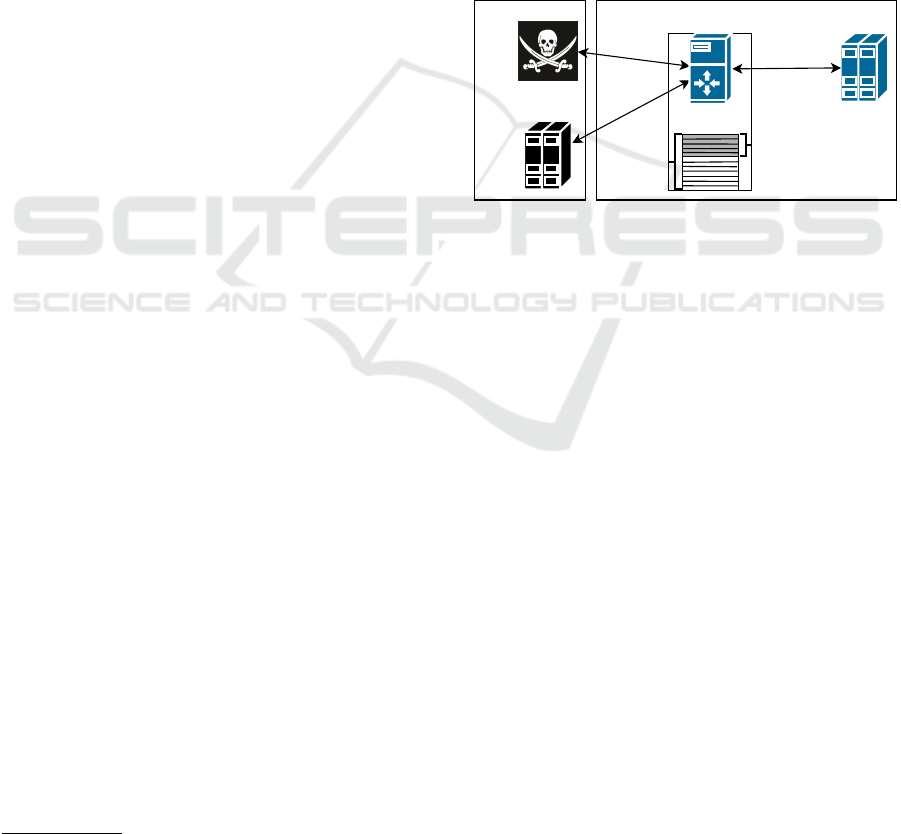
ble state. Fig. 1 presents an assumed attack scenario.
Victim's sideAttacker's side
Host B
(dst)
Host A
(src)
Host D
(Ryu)
SDN
Controller
Flow table
size
Added flows
(Utilization rate)
Host C
(OVS)
SDN
Switch
Figure 1: Attack scenario and the testbed used for the ex-
perimental evaluations.
Host A is the attacker, while Host B may be, in
principle, unaware of the malicious activities. If the
traffic sent from Host A to Host B is sent back to
Host A, the time needed for such an operation will be
recorded by the attacker as a Round Trip Time (RTT).
It will be then considered as a measure of system per-
formance. If, for any reason, the returning traffic does
not reach Host A, Host B can be an active member of
the attack as well. In such a case, instead of measuring
RTT, the difference in time between sending a packet
by Host A and receiving it by Host B can be utilized in
the same manner. In this paper, we assume the former
case. Sequence diagrams for exchanging messages
between hosts in each system state, i.e., representing
RTT as T1, T2, and T3, are illustrated in Fig. 2, 3,
and 4.
The flow table size and its utilization rate should
be considered as nonpublic information. By count-
ing the transmitted packets and analyzing the obtained
RTT (represented as T1, T2, and T3), the attacker can
infer how many packets are needed to fill the flow ta-
ble and its overall size. Since the flow table size de-
pends on the hardware used, such activity is a form
of active fingerprinting. Moreover, as already men-
tioned, such knowledge can be used to successfully
perform an overflowing of the flow table. Such activ-
Inferring Flow Table State through Active Fingerprinting in SDN Environments: A Practical Approach
577
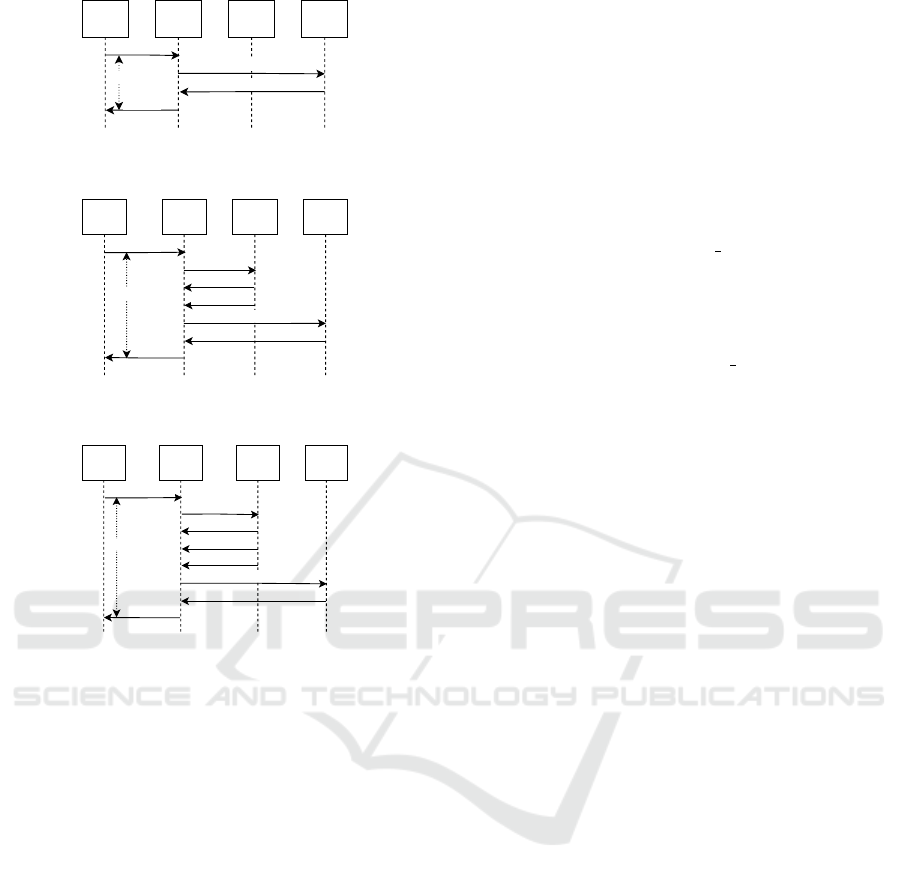
request fl: 1
Host A
(src)
Host C
(OVS)
Host D
(Ryu)
Host B
(dst)
reply fl:1
T1
request fl: 1
reply fl:1
Figure 2: Sequence diagram for RTT measuring for T1 sce-
nario (flow rule already exists in the table).
request new fl: 1
Host A
(src)
Packet_In fl: 1
Host C
(OVS)
install fl: 1
Host D
(Ryu)
Host B
(dst)
Packet_Out
request fl: 1
reply fl:1
reply fl:1
T2
Figure 3: Sequence diagram for RTT measuring for T2 sce-
nario (flow rule does not exist in the table; table not full).
request new fl: X
Host A
(src)
Packet_In fl: X
Host C
(OVS)
install fl: X
Host D
(Ryu)
Host B
(dst)
Packet_Out
request fl: X
reply fl: X
reply fl:1
T3
remove fl: 1
Figure 4: Sequence diagram for RTT measuring for T3 sce-
nario (flow rule does not exist in the table; table full).
ity can significantly harm the overall system perfor-
mance. Clearly, the attacker can simply flood an SDN
switch indefinitely, which at some point will lead to
the denial-of-service, as already studied in the litera-
ture (Kreutz et al., 2015), (Correa Chica et al., 2020).
However, in the assumed threat model, the attacker
aims to establish the table size and its utilization rate.
This can be achieved by means of fingerprinting and
provide more information on the setup, topology, and
utilized software or hardware, which could be used as
attack vectors on the infrastructure.
2.1 Previously Proposed Solution
In (Zhou et al., 2018) the authors implemented and
evaluated the inference attack framework according
to the attack scenario depicted above. To evaluate
their technique, they used Mininet, i.e., simulated en-
vironment, as a network prototyping system to em-
ulate hosts and the switch. They also utilized libnet
(https://github.com/libnet/libnet) for generating artifi-
cial traffic, which raises concerns whether the RTT
or only one-way delay was measured, as the fully
spoofed traffic which was utilized might not be sent
back to the source host. It must be also noted that the
authors sent each spoofed packet only once. By gen-
erating such traffic and measuring the time needed to
complete the rule installation process, and comparing
it to the fixed thresholds (T1, T2, and T3), the authors
tried to deduce the flow table state. Unfortunately, by
using a simulation instead of real-world setup, they
did not take into account several issues that need to
be addressed.
First of all, typically, a switch sends packets to
the controller using the Packet In OpenFlow message
when instructed to do so or does not know what to
do with the packet. Then, the controller can decide to
install a new rule allowing, blocking, or altering such
traffic. However, it may also choose to send a packet
back to the switch (using Packet Out OpenFlow mes-
sage) to be forwarded to the proper destination. With-
out this, the packet would be dropped, and thus ev-
ery first packet for every new flow would be dropped
as well. Removing and installing a new rule can be
done parallel to sending a packet back to the switch.
Therefore, only one packet could not be enough to
distinguish between T2 and T3 RTTs (which allow to
decide if the flow table is full or not). In other words,
the system’s response to a full and empty flow table
for the first packet of a new flow would be very sim-
ilar. It must be noted that in (Zhou et al., 2018), the
authors used only one packet per flow, which, as we
present in this paper, in practical evaluation, gives the
worst results.
The second issue of the existing method is related
to the fact that the same probe packet (which does not
have a corresponding rule on the switch) is sent very
frequently (so-called flooding). In such a case, after
some time, the switch may become overloaded, which
makes it hard to interpret the obtained RTTs. Thus, it
must be noted that apart from the number of probes,
also the interval between them should be considered
as well. As mentioned in (Zhou et al., 2018), the au-
thors used libnet, which as they claim, can generate
tens of thousand packets per second. However, in our
approach, we send packets at a fixed interval.
Finally, the last issue is related to anomalies that
may typically occur in the network. Packets can be
lost or processed longer than usual. Unfortunately,
re-transmission is not always an option. For exam-
ple, if the switch flow table is not full and a new
packet is sent, in (Zhou et al., 2018) the authors as-
sumed that RTT would be near T2. However, it can
be much longer (even longer than the expected T3),
due to anomalies). This means that if the same packet
is sent again, the corresponding flow may be already
installed, and the obtained RTT will be near T1. As
a result, such system responses would be hard to un-
SECRYPT 2021 - 18th International Conference on Security and Cryptography
578

ambiguously interpret. Anomalies typically happen
randomly and thus cannot be foreseen in advance and
eliminated.
All above-mentioned issues lead to the conclusion
that the values (T1, T2, and T3) measured using sim-
ulation may be of limited use when faced with real-
world and diversified environments.
2.2 Proposed Active Fingerprinting
Technique
To address the above-mentioned issues of the existing
method, we propose a novel inferring technique that
can be utilized in real-world networking scenarios and
builds upon the method described in the previous sub-
section.
First of all, for measuring RTT, we propose to uti-
lize the ping tool. In more detail, we define two pa-
rameters useful for the fingerprinting technique, i.e.,
the number of ping probes (in the remainder of the
paper, we call it probes in short) and ping interval (in
short interval). The former describes the number of
ICMP Echo Request messages used for fingerprint-
ing purposes, while the latter defines the gap between
consecutive ICMP messages. The resulting calculated
RTT is the arithmetic average of the values obtained
for all probes during one execution of the ping tool.
We decided to utilize the ping tool, therefore ICMP
protocol, as an example of the most common way of
measuring RTT to prove the effectiveness of the pre-
sented method (other types of traffic may be used as
well). Note that in enterprise environments, ICMP
may be often blocked, however, as described in 2, two
hosts can take part in the attack. In such a scenario,
the difference in time between sending a packet by
Host A and receiving it by Host B can be utilized in
the same manner as ping tool-based measurements.
Note that probes and interval constitute the finger-
printing observation window – the time the attacker
requires to determine the flow table state. When this
time is too short or too long, the attacker may not
be able to correctly establish the characteristics men-
tioned above, which renders the attack less effective
and a more tedious task.
To reduce the influence of anomalies caused by
the networking environment, we deduce the system
state based on its responses and not using fixed thresh-
olds (as it was done in (Zhou et al., 2018)). In re-
sult, our approach is much more robust and able to
automatically adapt to different types of networking
equipment and environments. In more detail, we per-
form three steps to identify the expected changes in
the system’s response instead of comparing the abso-
lute values of the measured RTT: (1) Measuring RTT
for two types of traffic, i.e., control and noise (de-
scribed in subsection 3.1); (2) Identifying peaks in the
control traffic and analyzing their periodicity to esti-
mate the flow table size (presented in subsection 3.2);
(3) Finding level-shift in the noise traffic to estimate
the flow table utilization rate (outlined in subsection
3.2).
3 EXPERIMENTAL TESTBED
AND METHODOLOGY
The testbed that we utilized during the experimental
evaluation is presented in Fig. 1. It includes four
hosts: Host A is running the Linux ping6 command,
generating ICMPv6 traffic (src), used to measure RTT
between Host A and Host B; Host B is the destination
of the ping6 command (dst); Host C is running Open
vSwitch (v. 2.12.0), controlled by the SDN controller
on Host D; Host D has Ryu (v. 4.34) SDN controller
installed.
The above mentioned hosts are KVM virtual ma-
chines created on CentOS 8.3 server (kernel 4.18.0-
240). To avoid the interference of external factors,
only these virtual machines were running at the time
of the experiments and they were connected to an iso-
lated virtual network. Additionally, the CPU governor
on the physical host was set to disable overclocking,
which could lead to misleading results depending on
CPU frequency. Each host has one vCPU and 4GB
RAM, whereas the physical host is equipped with 12
physical cores (24 threads) and 144GB RAM. Due to
these facts, we can assume that the impact of the virtu-
alization overhead was minimized. Virtual machines
were running CentOS 8.3 operating system as well.
To measure RTT, we decided to utilize the most
common tool, i.e., the ping command. We want each
new sent packet (probe) to cause a new flow to be in-
stalled in the flow table. However, as we introduce
probes as a sequence of the same ping packets, we
need to distinguish between the two sequences, so
they can fall into the proper flow table rule. There-
fore, to solve this issue, we decided to utilize the IPv6
flow label header field (Deering et al., 2017) to mark
the consecutive ping messages. Specific flow labels
can be assigned using the ping6 command (option -
F) and thus easily identified. The same mechanism
can also be used in the OpenFlow protocol (version
1.5.1), so it is possible to identify the traffic on the
SDN switch, too.
Open vSwitch (OVS) running on Host C is set
to connect to the Ryu controller running on Host D.
Ryu controller during startup, firstly delete all exist-
ing rules on the OVS, then installs two initial rules:
Inferring Flow Table State through Active Fingerprinting in SDN Environments: A Practical Approach
579

a) redirect all IPv6 ICMP Echo Requests (type: 128
(Conta et al., 2006)) with a unique flow label to the
controller; b) handle the remaining traffic with NOR-
MAL action. With such configuration, the switch will
send every IPv6 ICMP Echo Request packet with a
unique flow label field for further inspection. Every
other traffic, not related to the experiments like, for
instance, ARP or even IPv6 ICMP Echo Reply (type:
129 (Conta et al., 2006)), will be forwarded to the
proper destination and will not reach the controller.
This allows to ensure that the controller is not addi-
tionally overloaded and the obtained results are accu-
rate.
3.1 RTT Measurements
Figs. 2, 3, and 4 illustrate a sequence of pack-
ets/messages exchanged between hosts in the exper-
imental testbed and the related measured RTTs (T1-
T3). It should be noted that, in general, we can as-
sume that T1<T2<T3; however, as described in Sec-
tion 2.1, this may not always be the case.
The first part of our experiments is related to T1,
T2, and T3 RTTs approximation. All experiments
were measured separately to exclude their interfer-
ence. For each RTT measurement scenario, we trans-
mitted 1000 ICMP messages to provide statistical rel-
evance. We assume that if the switch is not over-
loaded, T1, T2, and T3 will be almost constant (ex-
cluding anomalies). On the other hand, if the switch
is unstable, it might be impossible to establish a cor-
rect range of each RTT.
To find the optimal values of T1, T2, and T3 for
our needs and exclude the issues described in Sec-
tion 2.1, we use parameters: number of ping probes
(provided by ping command argument −c) and ping
interval (−i). To establish the optimal ping probes
value, we sent n ICMP messages with the same IPv6
flow label, n ⊂ {1, 2, 3, 4, 5}. We decided to use five as
the maximum value of consecutive ICMP messages as
we experimentally established that a new flow in the
flow table is usually installed after sending 2-4 pings.
We also decided to use three interval values: 0.001,
0.005, and 0.01s. In our setup, we determined that the
intervals below 0.001s cause the switch and the con-
troller to be flooded, which causes the measurements
to be unpredictable in terms of delays as small as less
than 1ms. As for the maximum value (0.01s), we em-
pirically measured that the average T3 is about 5ms,
therefore we doubled it.
To calculate T1, we sent one IPv6 ICMP message
with a fixed flow label. Next, we confirmed that the
flow is installed on the switch, and then we started
generating 1000 IPv6 ICMP messages with the same
flow label. As the rule for such traffic was initiated
before, and this rule is installed on the switch, each
ping is not sent to the SDN controller, but forwarded
directly to the destination host (see Fig. 2). Each
experiment was conducted for every combination of
probes (1-5) and intervals (0.001, 0.005, and 0.01s).
To measure T2, a similar experiment was per-
formed. The only difference is that a new flow label
was used for every 1000 IPv6 ICMP Echo requests.
Additionally, the flow table size was not limited, and
all of the 1000 new flows were installed without any
issues. Some extra messages were exchanged be-
tween OVS and SDN controller to install each flow
(see Fig. 3). Again, each combination of probes and
intervals was experimentally evaluated.
Finally, T3 was measured very similar to T2, but
the flow table size was limited and filled before the
experiment started. In such a case, an additional effort
is required from the SDN controller to remove one of
the existing rules to install the new one (see Fig. 4).
For statistical relevance purposes, each experi-
ment was repeated ten times. We also calculated met-
rics such as minimum, maximum, and average values,
and standard deviation. Therefore, 450 experiments
were run in total (3 RTT x 5 probes x 3 intervals x 10
experiments).
3.2 Flow Table Size and Utilization Rate
Measurements
As described in Section 2, the fingerprinting attack is
successful if an attacker is able to infer the flow table
size and its utilization rate. To perform the experi-
mental evaluation of the flow table state inferring, we
made the following assumptions:
• we manually limit the flow table size to ten differ-
ent values (100, 200, ..., 1000);
• we manually filled half of the table with unique
IPv6 flow labels not used further during the exper-
iments (corresponding values: 50, 100, ..., 500).
To measure the flow table size and its utilization
rate, we need to run two ping6 programs in one loop.
The purpose of the first one was to generate a new
flow label in each loop. We call it the noise ping. We
use it to completely fill the flow table, which, in the
result, will cause the change of the measured RTT.
The second ping with the fixed flow label, i.e., con-
trol ping, is used to measure when a specific flow la-
bel is removed because of the introduced noise. Be-
cause the flow table in our environment uses the most
popular algorithm, i.e., FIFO (First In First Out), the
generated noise will fill the queue causing the con-
trol ping flow to be removed. However, as the control
SECRYPT 2021 - 18th International Conference on Security and Cryptography
580

ping is constantly being executed, after being pushed
off from the FIFO queue, it will cause a short peak
in the RTT measure (T2). After the rule installation
and before noise pushes it again from the queue, the
measured RTT should be around T1.
Moreover, during this part of our research, each
experiment was executed ten times to obtain average
values, and we used all combinations of the number of
probes (1-5), intervals (0.001, 0.005, and 0.01s), and
flow table size (100, 200, ..., 1000). We also assumed
to generate ten times more noise flows than the actual
flow table size. In total, this resulted in 1500 experi-
ments (10 flow table sizes/utilization rate x 5 probes
x 3 intervals x 10 experiments).
The obtained RTT measurements for the control
and noise ping traffic are then utilized during the in-
ferring procedure’s remaining steps. To infer the flow
table state based on RTT, we use three algorithms.
Firstly, we need to find RTT peaks in the control
traffic, which indicate the system state change (purg-
ing control ping rule) and for this purpose we used
“Robust peak detection algorithm (using z-scores)”
2
,
claimed to be the best choice by the community. Z-
score is a measure of how many standard deviations
below or above the population mean a raw score is.
The second algorithm is “Signal find peaks” from the
well-known software collection SciPy
3
. We noticed
that both algorithms are able to identify peaks with
enough accuracy for our needs. After short tuning of
the parameters, we were satisfied with the results and
decided to use the first algorithm.
The next step was to find the periodicity in the
control pings (which we use to infer the flow table
size). We calculate the distance between each pair
of peaks in the control pings and determine the most
frequent one. Assuming that anomalies occur ran-
domly, finding periodicity among them should not be
possible. On the other hand, after sending a number
of noise pings equal to the flow table size, all other
flows will be removed. In such a case, the control
ping peak should be visible, as a new flow will have
to be installed (T1->T3). Note that we do not use any
background traffic in our experiments, which would
change the overall system behavior.
After successfully determining the control peak
periodicity, an assumption can be made that the dis-
covered value is the flow table size. As the flow ta-
ble utilization rate cannot be larger than the flow table
size, finding a level-shift in the noise traffic (i.e., the
flow table utilization rate) can use a narrowed value
2
https://stackoverflow.com/questions/22583391/peak-
recognition-in-realtime-timeseries-data/22640362
3
https://docs.scipy.org/doc/scipy/reference/generated/
scipy.signal.find peaks.html
range. For this purpose, we limit the analyzed data
from ping number 0 to the ping number denoting the
inferred flow table size. Next, we use the NumPy
Convolve
4
algorithm, which returns the discrete lin-
ear convolution of two one-dimensional sequences.
To establish the best parameters for the proposed
active fingerprinting technique, i.e., the number of
probes and the interval value, we use the mean ab-
solute percentage error (MAPE):
MAPE =
1
n
∑
n
t=1
A
t
−F
t
A
t
,
where A
t
is the actual value, and F
t
is the predicted
value. Consequently, the prediction accuracy (PA) is
defined as
PA = max(1 − MAPE,0).
We calculate MAPE of the inferring of table flow
size/utilization rate for each combination of the num-
ber of ping probes and intervals. Additionally, we use
the average values from 10 repetitions of the experi-
ments. However, using mean values can be mislead-
ing due to error compensation. We noticed that the
overall effect of the table size inferring was satisfy-
ing in many cases, but then the standard deviation of
the obtained results proved that it should not be com-
pletely trusted. Thus, it must be emphasized that for
the best configuration of our method, the standard de-
viation was on a very low level.
4 OBTAINED RESULTS
This section presents the obtained results for RTT
measurements and the flow table size and utilization
rate inferring process. First, we show that the mea-
sured RTTs cannot be compared to static thresholds
(as it is proposed in (Zhou et al., 2018)) as this is not
applicable to real-world setups. Then, we present the
experimental results for our approach.
4.1 RTT Measurements
As mentioned, if we infer the flow table state just
based on the measured RTT values, this can lead to
incorrect predictions. In (Zhou et al., 2018), the au-
thors claimed that RTT for the traffic for which flow
entry exists in the flow table (T1) is in the range of
0.2-0.3ms. When the flow entry for a packet does not
exist and the flow table is not full, RTT (T2) is be-
tween 3-5ms. Finally, the traffic for which the flow
entry does not exist and the flow table is full, RTT
(T3) is in the range 6-8ms. It should be noted that
4
https://numpy.org/doc/stable/reference/generated/
numpy.convolve.html
Inferring Flow Table State through Active Fingerprinting in SDN Environments: A Practical Approach
581
0
2
4
6
8
10
0 100 200 300 400 500 600 700 800 900 1000
Round Trip Time [ms]
Ping number
T1
T2
T3
Figure 5: Anomalies and switch saturation (probes=1, interval=0.001s).
0
1
2
3
4
5
6
7
8
9
0 100 200 300 400 500 600 700 800 900 1000
Round Trip Time [ms]
Ping number
T1
T2
T3
Figure 6: Stable switch operation (probes=3, interval=0.01s).
in real-world setups, such fixed thresholds are not re-
alistic as the T1-T3 depend greatly on the used soft-
ware and hardware. In the result, applying the pro-
vided ranges as general thresholds may not work cor-
rectly for every practical setup. Note that the authors
also claim that T1, T2, and T3 values are contained in
small ranges that do not overlap with each other.
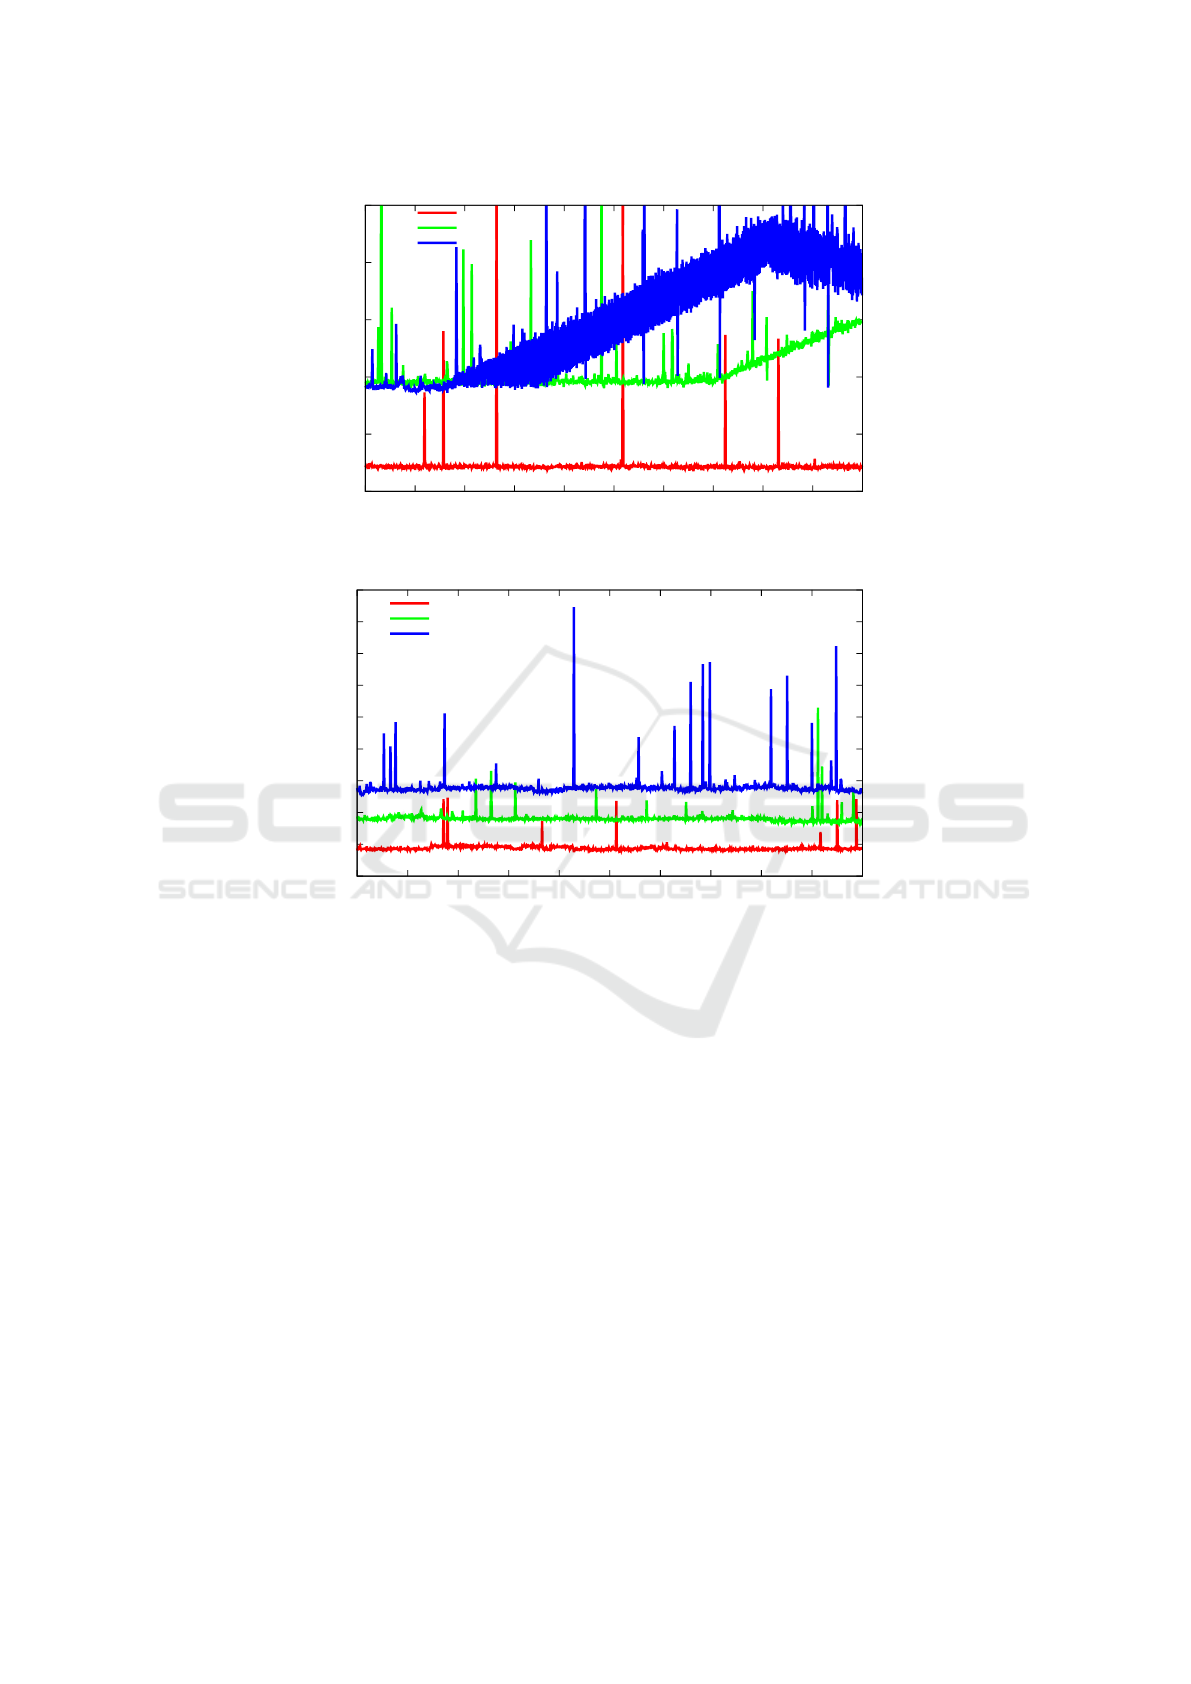
However, through practical experiments, we de-
termined that this is not always the case. All types of
issues described in Section 2.1 are illustrated in Fig.
5 – note: the figure has been scaled down to 10ms for
better visibility and the actual peak values can reach
up to 70ms. Moreover, as in (Zhou et al., 2018), we
used the number of probes equal to one; however, it
must be emphasized that the authors did not state how
often they sent their traffic but only that they use lib-
net to generate tens of thousand packets per second
(thus we decided to use interval = 0.001s). Based on
this figure, the following conclusions can be reached.
First of all, the general rule assumed by the authors of
(Zhou et al., 2018), i.e., that T1<T2<T3 is not always
correct. In Fig. 5, it is visible that there are T1 peaks
higher than T2 and T3, and T2 peaks higher than T3.
Moreover, for pings 0-150, T2 is almost equal to T3,
making it impossible to decide what is the current
flow table state. Finally, after ping number 200 for
T3 and 700 for T2, the switch has problems handling
traffic in a timely manner and works unpredictably.
Note that if we consider also other factors while
observing the traffic, i.e., various number of probes
and intervals, the obtained results are less noisy,
thus more suitable for our purpose. Fig. 6
presents the comparison between T1, T2, and T3 for
ping probes = 3 and interval = 0.01s. It is visible
that the peaks in each signal are still noticeable, but
are not that so frequent as for the single probe case.
Additionally, in this case, T1, T2, and T3 ranges are
generally not overlapping each other. Thus, we de-
cided to investigate further T1-T3 RTT results for the
various number of probes and intervals.
SECRYPT 2021 - 18th International Conference on Security and Cryptography
582
0
1
2
3
4
5
6
7
1 2 3 4 5
Average RTT [ms]
Probes
T1
T2
T3
Figure 7: Comparison of the average RTT - interval=0.001s.
0
1
2
3
4
5
6
7
1 2 3 4 5
Average RTT [ms]
Probes
T1
T2
T3
Figure 8: Comparison of the average RTT - interval=0.005s.
0
1
2
3
4
5
6
7
1 2 3 4 5
Average RTT [ms]
Probes
T1
T2
T3
Figure 9: Comparison of the average RTT - interval=0.01s.
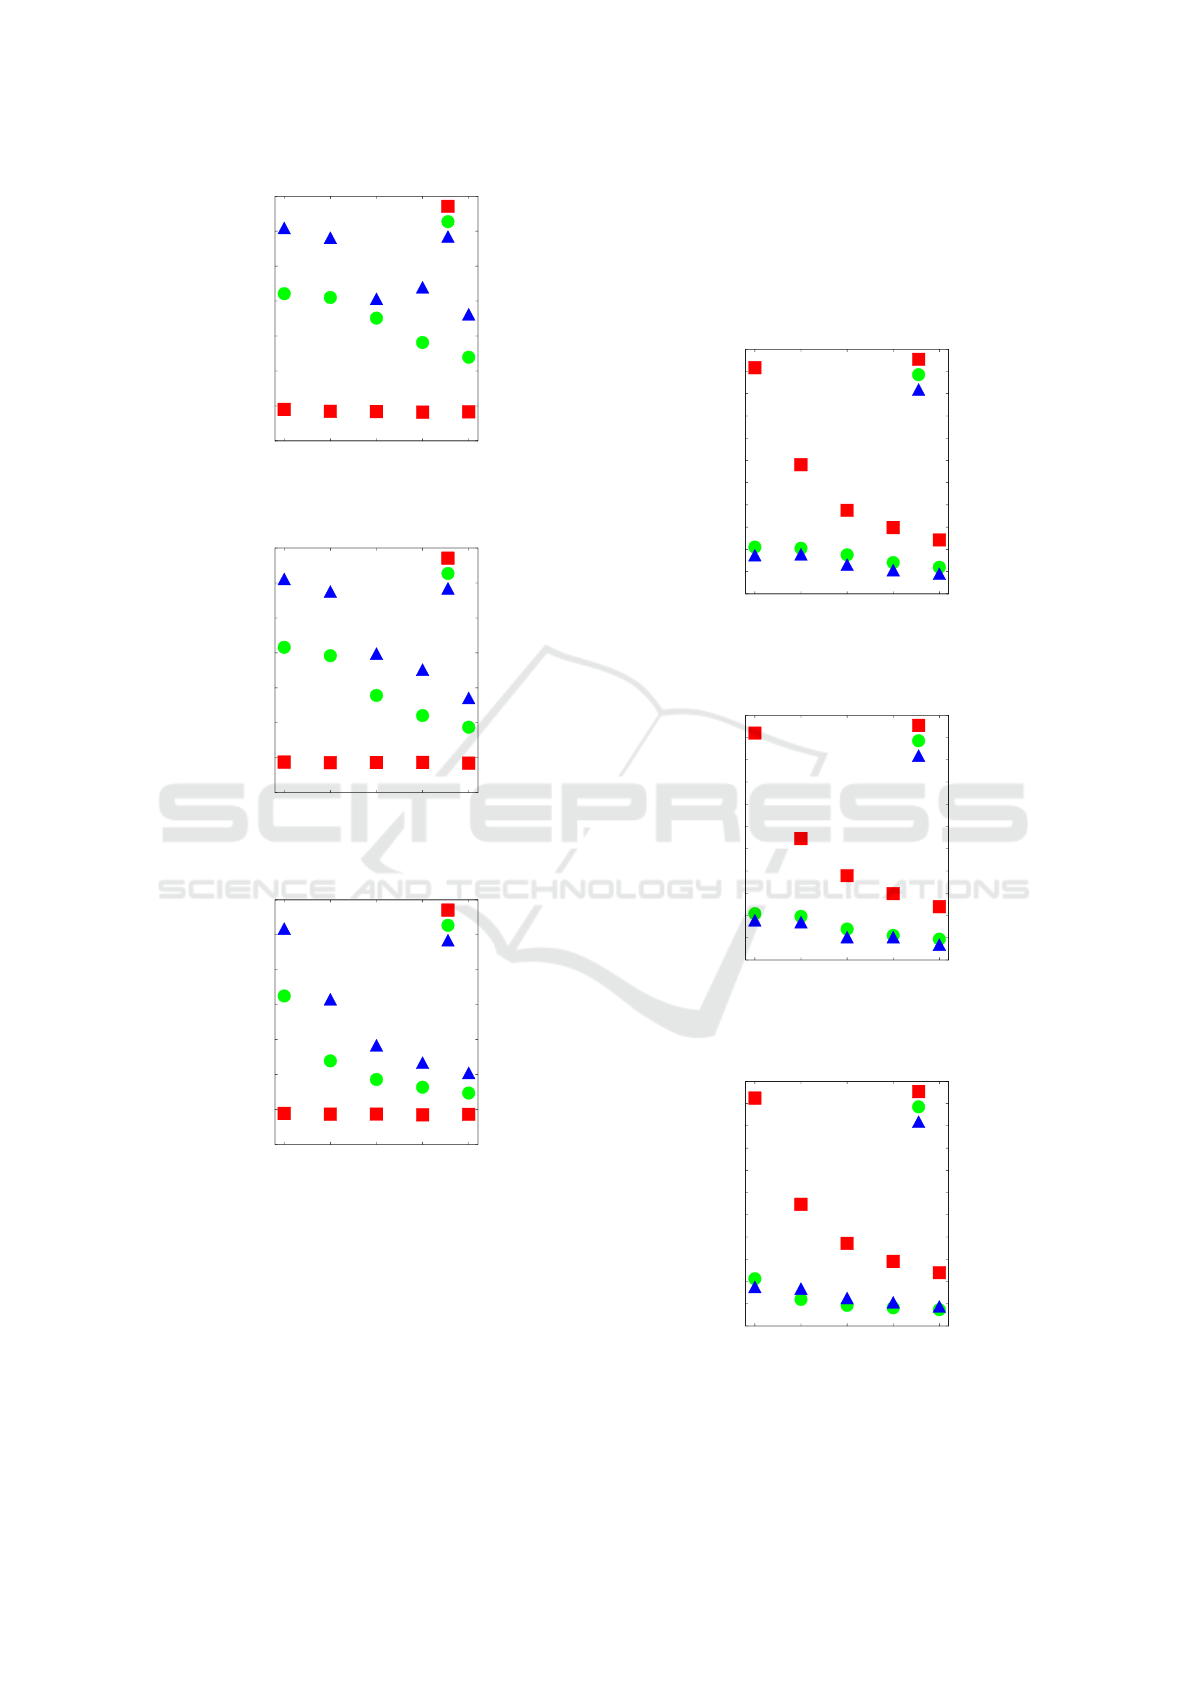
The obtained results are illustrated twofold in
Figs. 7, 8, 9 and 10, 11, 12. Figs. 7, 8, and 9 com-
pare the average RTTs for T1, T2, and T3 depending
on the number of ping probes and intervals. On aver-
age, they all seem similar. Moreover, the general rule
T1<T2<T3 is still valid. However, if T1 max value
and T3 min value are taken into account (as presented
in Figs. 10, 11, and 12), the opposite effect occurs
(T1>T2>T3). As described, the reason for such a sit-
uation can be ping anomalies, lost packets, or switch
saturation. This proves that making decisions about
the flow table state solely based on the RTT measure-
ment is incorrect. That is why, in the next subsection,
we propose a more robust and adaptive approach.
0
2
4
6
8
10
12
14
16
18
20
22
1 2 3 4 5
Average RTT [ms]
Probes
T1
T2
T3
Figure 10: Comparison of the RTT: maximal T1, average
T2, and minimal T3 - interval=0.001s.
0
2
4
6
8
10
12
14
16
18
20
22
1 2 3 4 5
Average RTT [ms]
Probes
T1
T2
T3
Figure 11: Comparison of the RTT: maximal T1, average
T2, and minimal T3 - interval=0.005s.
0
2
4
6
8
10
12
14
16
18
20
22
1 2 3 4 5
Average RTT [ms]
Probes
T1
T2
T3
Figure 12: Comparison of the RTT: maximal T1, average
T2, and minimal T3 - interval=0.01s.
Inferring Flow Table State through Active Fingerprinting in SDN Environments: A Practical Approach
583
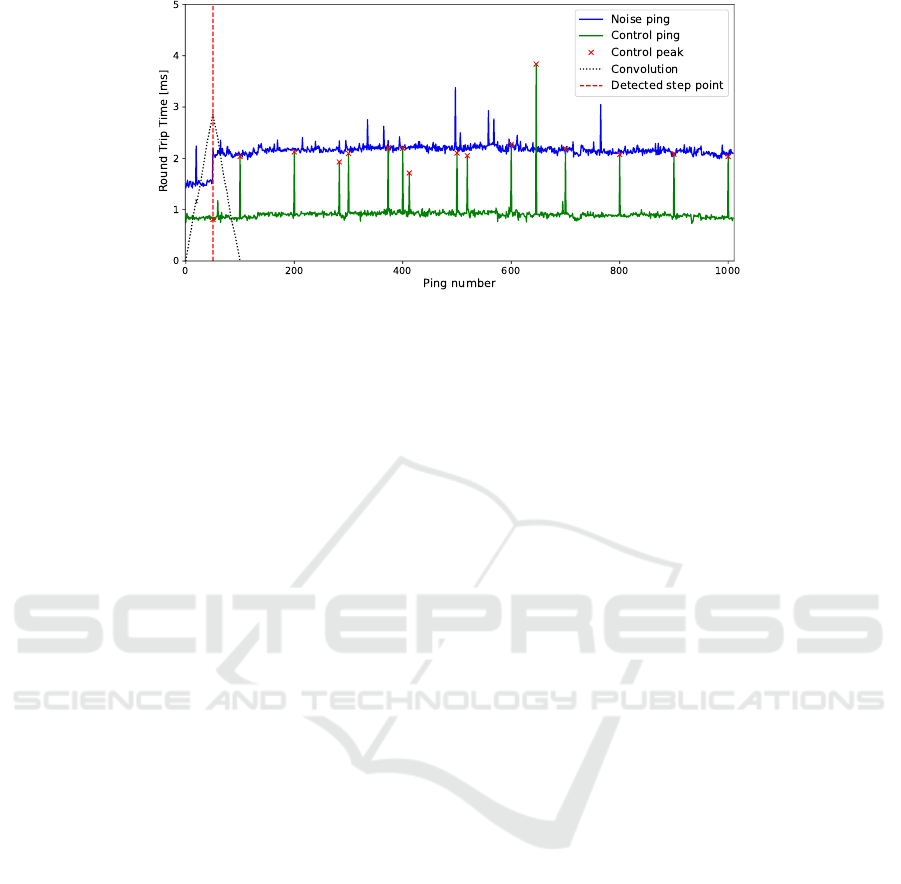
Figure 13: Finding peaks, their periodicity, and level-shift detection (flow table size=100, flow table utilization rate=50,
probes=3, interval=0.01s).
4.2 Flow Table Size and Utilization
Rate: Proposed Approach
As described in Section 3.1, we initially filled the
flow table to 50% of its capacity for each experiment.
Next, we used noise and control pings to decide the
state of the flow table. The obtained results are pre-
sented below.
First, Fig. 13 presents an exemplary measure-
ment with parameters: flow table size=100, flow ta-
ble utilization rate=50, ping probes=3, and ping in-
terval=0.01s. It should be noted that after 50 noise
pings, there is a visible level-shift between 1.5ms and
2.2ms. At this point, the flow table was completely
filled. Moreover, every ca. 100 control pings, there is
a visible control ping peak (100, 200, ..., 1000). From
these results, we can infer that the flow table size is
100 and the flow table is filled with 50 flows. Un-
fortunately, note that anomalies for control and noise
pings are visible in Fig. 13 as well. Thus, the main is-
sue is to determine the periodicity of the control ping
based on which the flow table size can be inferred.
If we narrow down the values from the ping number
0 to the predicted flow table size, we can determine
a level-shift in the control noise, which, in turn, pro-
vides the flow table utilization rate (by subtracting the
discovered table size and the detected level-shift). For
this purpose, we use the algorithms described in Sec-
tion 3.2 (finding peaks, their periodicity, and level-
shift detection). Fig. 13 presents the effect of all al-
gorithms with parameters: probes=3, interval=0.01s.
The actual values of the flow table size and utilization
rate for this experiment were 100 and 50, whereas the
proposed approach inferred these values as 99 and 50,
respectively.
Table 1 presents the overall results for the infer-
ring errors of the table size and its utilization rate and
the mean absolute percentage error for the proposed
fingerprinting technique. We decided to exclude stan-
dard deviation results for the better visibility and fo-
cus on the average values.
Based on the presented outcome, it is visible that
the worst results are obtained for probes=1 – this
again proves that using only one probe packet (as
done in (Zhou et al., 2018)) is disadvantageous. Sur-
prisingly, the highest value used in the experiments,
i.e., 5 probes, gave worse results than for 2-4. More-
over, the results for interval=0.001s are worse than
for 0.005 or 0.01s. The latter intervals behave simi-
larly. However, as we aim to infer the flow table size
and utilization rate as fast as possible, the lower num-
ber of probes and intervals are more favorable. Note
that by multiplying the number of ping probes and
the interval value, we are able to roughly estimate the
time needed to perform a single ping operation. Thus,
it is visible that a trade-off between the time needed to
infer the table flow state and the more accurate results
must be made.
After determining the optimal values for both pa-
rameters for our active fingerprinting method, we
present the final evaluation in Fig. 14. It presents ten
flow table sizes (100, 200, ..., 1000). The red bar rep-
resents the actual flow table size, green – the inferred
values using the proposed method, and blue – values
as predicted by (Zhou et al., 2018). Note that the latter
method is not using additional parameters, i.e., num-
ber of probes or interval which are essential for the
approach proposed in this paper. Thus, it was not
exactly possible to setup the same configuration for
both methods. That is why, thresholds used in (Zhou
et al., 2018) were evaluated against the configuration
of the our method, which is the closest to the origi-
nal approach, i.e., probes=1 and interval=0.001s. As
it is visible, the proposed technique significantly out-
performs the previously proposed approach and gives
estimates very close to the actual values, whereas the
SECRYPT 2021 - 18th International Conference on Security and Cryptography
584
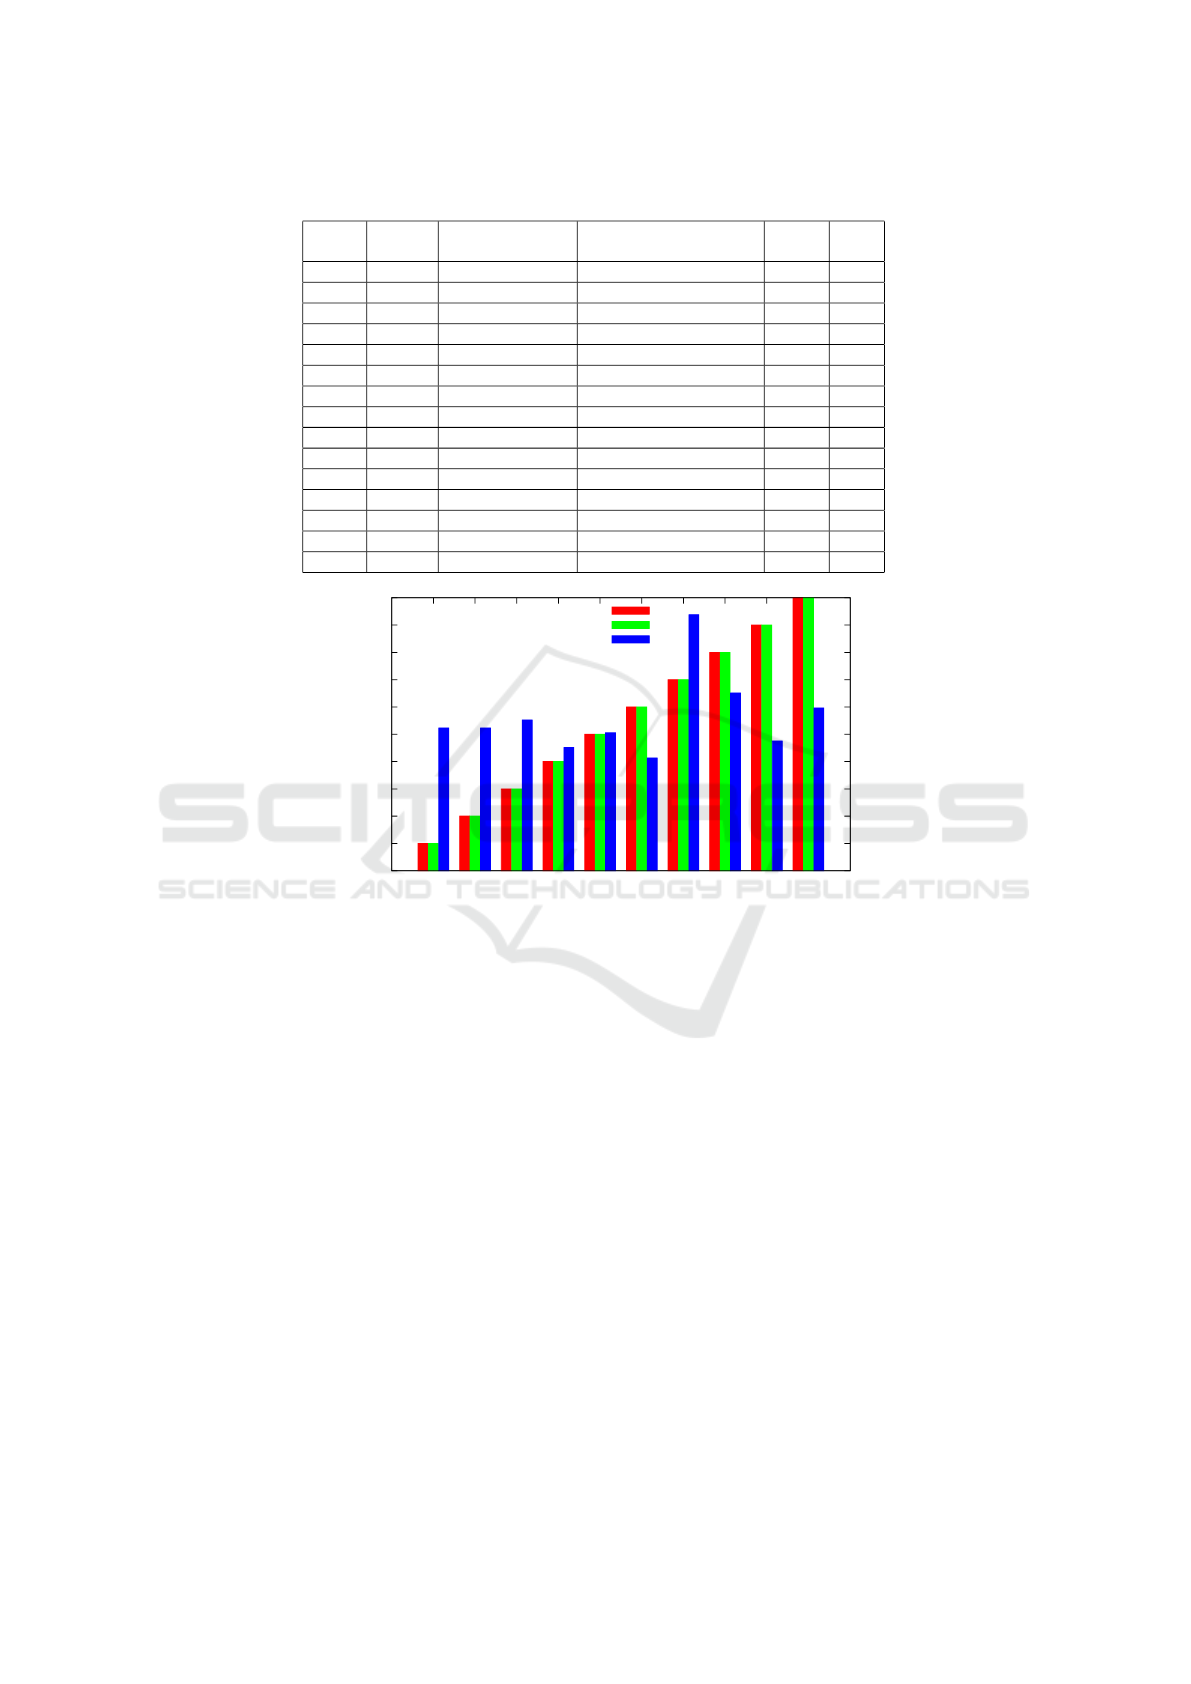
Table 1: Inferring error for all experiments (bold denotes the best result).
No. of
probes
Interval
[s]
Table size inferring
relative error [%]
Table utilization rate
inferring relative error [%]
MAPE
[%]
PA
[%]
1 0.001 67.35 67.59 67.47 32.53
2 0.001 16.30 36.23 26.27 73.73
3 0.001 6.30 7.26 6.78 93.22
4 0.001 8.00 2.33 5.16 94.84
5 0.001 10.05 3.90 6.97 93.03
1 0.005 52.88 60.27 56.57 43.43
2 0.005 3.40 0.02 1.71 98.29
3 0.005 15.07 3.81 9.44 90.56
4 0.005 13.38 3.13 8.26 91.74
5 0.005 26.32 5.04 15.68 84.32
1 0.01 59.68 61.27 60.48 39.52
2 0.01 3.00 0.00 1.50 98.50
3 0.01 1.00 0.00 0.50 99.50
4 0.01 17.59 0.43 9.01 90.99
5 0.01 32.94 3.06 18.00 82.00
0
100
200
300
400
500
600
700
800
900
1000
100 200 300 400 500 600 700 800 900 1000
Table size
Flow table size
Actual value
Inferred (proposed method)
Inferred Zhou et al.
Figure 14: Result of inferring the flow table size for the best parameters (probes=3, interval=0.01s) compared with (Zhou
et al., 2018) (probes=1, interval=0.001s).
method proposed in (Zhou et al., 2018) is not appli-
cable to real-world scenarios and even then results in
more serious underestimates and even overestimates.
However, our approach was always able to infer it cor-
rectly.
5 COUNTERMEASURES
In the previous sections, we demonstrated that active
fingerprinting could be effectively used to infer the
flow table state in real-world environments is feasible.
Therefore, it is vital to discuss also potential defensive
solutions.
In (Zhou et al., 2018), the authors proposed two
defensive solutions:
• Routing Aggregation, which relies on using fewer
flow table entries – similar entries should be ag-
gregated in groups;
• Multilevel Flow Table Architecture to implement
additional memory which will extend the flow ta-
ble possible size.
However, in our opinion, both solutions are in-
adequate to the demands of real-world applications.
Routing aggregation is not implemented in OpenFlow
switches, and it is unlikely to be added in the near fu-
ture. It is also a completely different approach than
the one used in modern switches. On the other hand,
the Multilevel Flow Table Architecture solution is not
always applicable in IoT devices where memory ex-
tension is not an option.
Recently (Nallusamy et al., 2020) published a pa-
per about preventing flow table entries overflow us-
ing decision tree-based algorithm. It operates by clas-
sifying the entries, and by replacing the usual evic-
tion process by pushing the low important entries into
counting bloom filter which acts as a cache to prevent
flow entry miss. However, again experiments were
conducted using a simulated environment (Mininet),
Inferring Flow Table State through Active Fingerprinting in SDN Environments: A Practical Approach
585

thus it may not be applicable to real-world scenarios.
Considering the above, more robust mechanisms
are desired, especially of a proactive nature. Below,
we discuss potential suitable solutions, however, due
to space limitation, we leave the evaluation of these
countermeasures as our future work.
The first possibility is to utilize approaches that
rely on the Moving Target Defense paradigm (Cho
et al., 2020). Such techniques aim at continuous mod-
ification of the configuration of the defended system,
shifting the attack surface and making the attacker’s
cyber reconnaissance methods ineffective. For coun-
tering the flow table state inferring solution presented
in this paper, one of the techniques that rely on apply-
ing periodical dynamic changes to the network topol-
ogy can be used (Sengupta et al., 2020). Such an ap-
proach can disorient the attacker by providing incor-
rect input data and increase uncertainty in the finger-
printing activities he performs.
An alternative solution is to use Cyber Deception
(Wang and Lu, 2018), which aims to confuse the at-
tacker by intentionally feeding him with incorrect in-
formation. In our case, it would be a deliberate modi-
fication of the system response, i.e., increasing or de-
creasing of the RTT.
Both above-mentioned mechanisms are promising
defense methods against the attack described in this
paper and their deployment does not need as signifi-
cant modification to the underlying protocols/systems
as the previously proposed countermeasures.
6 CONCLUSIONS AND FUTURE
WORK
In this paper, we proposed a robust and adaptive fin-
gerprinting method which can be used to infer SDN
switch flow table size and utilization rate. Obtaining
such information allows a malicious party to perform
an effective overflow attack causing disruption in the
network. By running the experiments in the setup us-
ing real-world software products, we proved that the
previously proposed technique, which was evaluated
only via simulations, cannot be utilized in practice.
On the other hand, the approach we propose scales
well and it is compatible with different types of SDN
software and hardware. Results obtained via exper-
imental evaluation revealed that the resulting predic-
tion accuracy to determine the flow table state is more
than 99%. Finally, we also proposed some realistic
defense mechanisms, however, we left the investiga-
tion of their effectiveness as our future work. In the
future, we would like also to introduce an additional
background traffic factor and reevaluate our proposed
method, which will transform the solution presented
in this paper into a usable and more practical mecha-
nism, which can be successfully implemented in the
industry.
REFERENCES
Ahmed, B. et al. (2020). Fingerprinting sdn policy param-
eters: An empirical study. IEEE Access, 8:142379–
142392.
Baidya, S. and Hewett, R. (2019). Sdn-based edge com-
puting security: Detecting and mitigating flow rule at-
tacks. In Symp. on Edge Computing, page 364–370.
Cho, J. et al. (2020). Toward proactive, adaptive defense: A
survey on moving target defense. IEEE Communica-
tions Surveys Tutorials, 22(1):709–745.
Conta, A. et al. (2006). Internet Control Message Protocol
(ICMPv6) for the Internet Protocol Version 6 (IPv6)
Specification. RFC 4443, RFC Editor.
Correa Chica, J., Imbachi, J., and Botero Vega, J. (2020).
Security in sdn: A comprehensive survey. Journal of
Network and Computer Applications, 159:102595.
Deering, S. et al. (2017). Internet Protocol, Version 6 (IPv6)
Specification. RFC 8200, RFC Editor.
Flauzac, O. et al. (2015). Sdn based architecture for iot and
improvement of the security. In IEEE AINA Wkshp.,
pages 688–693.
Kreutz, D. et al. (2015). Software-defined networking:
A comprehensive survey. Proceedings of the IEEE,
103(1):14–76.
Li, Y. et al. (2020). Enhancing the internet of things with
knowledge-driven software-defined networking tech-
nology: Future perspectives. Sensors, 20(12).
Nallusamy, P. et al. (2020). Decision tree-based entries re-
duction scheme using multi-match attributes to pre-
vent flow table overflow in sdn environment. IJNM.
Nurwarsito, H. et al. (2020). Implementation of wlru algo-
rithm to improve scalability in software defined net-
work. In SIET, page 165–170.
Sengupta, S. et al. (2020). A survey of moving target de-
fenses for network security. IEEE Communications
Surveys Tutorials, 22(3):1909–1941.
Wang, C. and Lu, Z. (2018). Cyber deception: Overview
and the road ahead. IEEE Security Privacy, 16:80–85.
Wu, Q. and Chen, H. (2020). Achieving a heterogeneous
software-defined networks with camovisor. In Int.
Conf. on Electronics Technology, pages 804–808.
Xie, S. et al. (2021). A table overflow ldos attack defending
mechanism in software-defined networks. SCN.
Yu, M. et al. (2020). Flow table security in sdn: Adver-
sarial reconnaissance and intelligent attacks. In IEEE
INFOCOM, pages 1519–1528.
Zhou, Y. et al. (2018). Exploiting the vulnerability of flow
table overflow in software-defined network. SCN,
2018:1–15.
SECRYPT 2021 - 18th International Conference on Security and Cryptography
586
