
GUIMETRICS: An Extensible Cloud-based Application for Automatic
Computation of GUI Visual Design Measures
Nicolas Burny
a
and Jean Vanderdonckt
b
Universit
´
e Catholique de Louvain, Louvain-la-Neuve, Belgium
Keywords:
Graphical User Interface, Software Measurement, User-centered Design, Visual Design.
Abstract:
The visual quality of graphical user interfaces can be estimated by software measurement, which consists of
measuring visual design formulas on a dataset of interfaces and interpreting them for improving their overall
quality. When performed manually, this process becomes very tedious and error prone, especially for large
datasets. When performed with existing software, this process is accelerated, but tied to a particular set of
measures with their own interpretation, making them inflexible. To overcome these shortcomings, GUIMET-
RICS improves this process by automatically collecting screenshots in various platform configurations and
resolutions and automatically computing and interpreting measures on-demand. The cloud-based architecture
of GUIMETRICS can be extended with external modules for computing any visual measure, even in different
programming languages, thus making it more flexible.
1 INTRODUCTION
The quality of visual design (Camargo et al., 2018) of
a Graphical User Interface (GUI) influences its over-
all software quality (ISO, 2019) by contributing to
its usability (Abran et al., 2003; Seffah et al., 2006)
and its aesthetics (Miniukovich and De Angeli, 2014)
by manipulating their visual components (e.g., wid-
gets, menus, contents, pictures, videos, banners), their
properties (e.g., size, color, typography), and their
layout by relying on a variety of techniques borrowed
from visual design, such as visual techniques (Ngo
et al., 2003), symbolic qualities (Hartono and Hol-
sapple, 2019), quantitative and aesthetic properties
(Zen and Vanderdonckt, 2014). The visual design also
positively impacts other quality (sub-)factors, such as
credibility, usefulness (Tractinsky et al., 2000), per-
formance (Sonderegger and Sauer, 2009), and overall
usability (Ivory and Hearst, 2002).
A particular research direction that grew con-
siderably in the last few years is the experimental
study of GUI visual design through software measure-
ment (Hartono and Holsapple, 2019; Dupuy-Chessa
et al., 2016). The typical process consists of the fol-
lowing steps: defining and building a GUI dataset for
different configurations (e.g., capturing screenshots in
a
https://orcid.org/0000-0003-4994-9746
b
https://orcid.org/0000-0003-3275-3333
different resolutions on different devices, wireframes,
or mockups), computing visual design measures for
the various configurations, and analyzing their results
by comparing them to qualitative measures provided
by participants (see figure 1 for an example).
However, this reliance of experimental studies
on large datasets reveals problems that hinders the
progress in this research field. The construction of
datasets require time- and resource-consuming pro-
cesses implying human intervention. The manual na-
ture of these processes such as interface segmenta-
tion induces a high variability in the results. Not only
these issues make the construction of datasets in the
field of GUI visual design a hardly scalable and error-
prone process, but it also limits the reproducibility
and verifiability of experiments (Pr
¨
oll et al., 2016)
which is a major requirement in many research set-
tings in order to assess the value of scientific claims.
This paper presents GUIMETRICS
1
, an extensible
cloud-based application for automating the workflow
of defining and computing visual design measures on
GUIs and is structured as follows:
1. Section 2 conducts a literature review targeting
prior work for automating the computation of vi-
sual design measures and their related studies.
2. Based on this review, Section 3 motivates GUI-
METRICS by specifying its underlying conceptual
1
https://github.com/uilab-app
Burny, N. and Vanderdonckt, J.
GUIMETRICS: An Extensible Cloud-based Application for Automatic Computation of GUI Visual Design Measures.
DOI: 10.5220/0010571605050512
In Proceedings of the 16th International Conference on Software Technologies (ICSOFT 2021), pages 505-512
ISBN: 978-989-758-523-4
Copyright
c
2021 by SCITEPRESS – Science and Technology Publications, Lda. All rights reserved
505

model and process for supporting the computa-
tion of GUI measures and by explaining design
choices made for its implementation.
3. Section 4 exemplifies GUIMETRICS by conduct-
ing an experiment comparing automatic aesthetic
measures of electronic commerce web sites to
subjective evaluation performed by participants.
2 RELATED WORK
Usability, as well as its sub-factor “GUI aesthetics”,
is one of the key eight software quality factors de-
fined in the ISO 25010 standard (ISO, 2019). Several
studies (Miniukovich and De Angeli, 2014; Dupuy-
Chessa et al., 2016) attempt to characterize this fac-
tor and its sub-factors through quantitative measures
so as to compute them systematically and to inter-
pret them consistently (Ivory and Hearst, 2002). Bor-
rowed from the field of visual design, several visual
techniques (Vanderdonckt and Gillo, 1994) are in-
troduced to assess this factor that later on were as-
sociated to mathematical formula (Ngo et al., 2003)
for: balance, equilibrium, symmetry, sequence, cohe-
sion, unity, proportion, simplicity, density, regularity,
economy, homogeneity, rhythm, order, and complex-
ity. These studies typically compute these measures
manually for a dataset that should be large enough
to produce significant results, thus resulting into a te-
dious and error-prone process that is very resource-
consuming. To reduce this workload, several software
introduce an automatic mesaure computation.
BALORES (Gonz
´
alez et al., 2012) aims at help-
ing designers to structure their mockups and produce
well-designed, pleasing GUIs to improve user’s sub-
jective satisfaction by measuring five measures on
several “screen areas” (e.g., text, image, form) delin-
eated on the GUI layout: balance, regularity, linearity,
sequentiality, and orthogonality.
GUIEVALUATOR (Alemerien and Magel, 2014)
is a desktop application for evaluating the GUI com-
plexity based on its structure. The application auto-
matically computes five structural measures.
QUESTIM (Zen and Vanderdonckt, 2014) is a web
application for evaluating GUI visual measures to
provide designers with an objective feedback regard-
ing the visual design of their GUIs. It enables the
end user to specify a website URL or upload a file
containing any GUI artifact, such as a screenshot, a
wireframe, a sketch, a picture or a prototype. After
defining graphical regions of interest (e.g., a widget, a
group box, a menu, an image) by direct manipulation,
visual design measures are automatically computed.
AIM (Oulasvirta et al., 2018) is a web applica-
tion for the computational evaluation of GUIs. The
goal of the application is to facilitate the use and ap-
propriation of computational methods in design prac-
tices. After having specified the screenshot or URL
of a website, the end user can choose the measures
to be computed automatically on specified elements.
The screen resulting from the computational evalua-
tion appears with the values of the selected measures
in real-time.
WUI (Bakaev et al., 2019) consists of an online
web application integrating measures computed from
different providers for evaluating GUI visual design.
For this purpose, WUI is able to working with differ-
ent remote services, such as the AIM remote service
as a major provider for visual design measures. As
for QUESTIM and AIM, WUI allows for the auto-
matic capture of screenshots by specifying a website
URL or for the direct upload of GUI screenshot, and
also only one sample can be captured and analyzed at
a time.
3 THE GUIMETRICS
APPLICATION
3.1 Introduction and Motivations
Existing softwares described in Section 2 mainly fo-
cus on the automated computation of measures on
GUIs. These measures are directly implemented and
embedded in the source code of the applications,
thus making them inflexible to accommodate differ-
ent measures, different formulas, and different inter-
pretations of these formula. This implies a new de-
velopment each time a measure needs to be added or
updated. Moreover, these tools only allow to process
one single input at a time, which makes them unsuit-
able for the construction of large datasets required in
the context of experimental studies. In this section,
we describe GUIMETRICS, a software aimed at sup-
porting the automation of the measure computation
process for GUI visual design in an extensible way.
3.2 Definition of Conceptual Model
The application is designed based on a conceptual
model with the following concepts (Fig. 2):
Gallery: A gallery is a set of screenshots that are log-
ically grouped together. Galleries can also be as-
sociated to workflows via “Run” entities.
Screenshot: A screenshot is the captured graphical
representation of an user interface. A gallery is
ICSOFT 2021 - 16th International Conference on Software Technologies
506
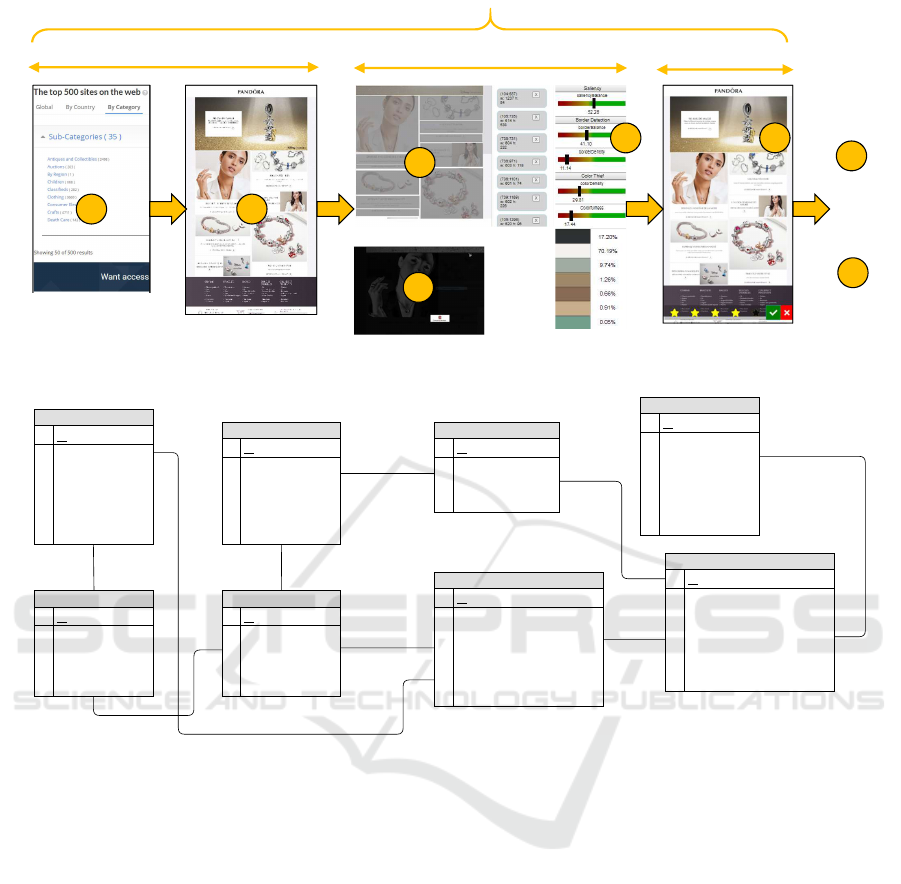
90 most popular shopping sites
URL extraction and
screenshot capture
https://www.alexa.com/top
sites/category/Top/Shopping
Zone segmentation
Color analysis Online rating by participantsMeasures computation
Descriptive
statistics
Inferential
statistics
4
6
8
7
3
21
5
(1) Automatic collection of screenshots
(3) Automatic computation and
interpretation of measures
(2) Parameterizing
of the experiment
G
UI
M
ETRICS
Figure 1: GUIMETRICS workflow illustrated on an experiment for assessing the visual quality of shopping web sites.
Screenshot
id
PK
galleryId
FK
website
resolution
data
createdAt
updatedAt
Gallery
id
PK
title
descritpion
createdAt
updatedAt
Run
id
PK
gallery_id
FK
workflow_id
FK
createdAt
updatedAt
Workflow
id
PK
graph_id
FK
name
description
createdAt
updatedAt
Dependency Graph
id
PK
workflow_id
FK
createdAt
updatedAt
Computation
id
PK
screenshot_id
FK
run_id
FK
computable_instance_id
FK
result
createdAt
updatedAt
Computable
id
PK
title
requirements_file
source_code
type
createdAt
updatedAt
1 1
1
0..n
1
0..n
1
0..n
0..n 1
1..n1
1
0..n
1
0..n
0..n
1
Computable Instance
id
PK
dependency_graph_id
FK
computable_id
FK
dependencies_ids
result_name
createdAt
updatedAt
Figure 2: Conceptual model of GUIMETRICS.
composed of screenshots from different sources
and of various resolutions and densities.
Workflow: A workflow represents a set of com-
putable instances grouped together that can be
computed on screenshots. The computation of a
workflow on a given gallery implies the compu-
tation of all the computable instance entities con-
tained in the workflow on all the screenshots con-
tained in the gallery. For each screenshot of the
gallery, the order of execution of computable in-
stances is determined by the dependency graph as-
sociated to the workflow.
Dependency Graph: A dependency graph is a entity
containing the dependencies between the com-
putable instances of a workflow. A workflow in-
dicates which functions can computed on a given
gallery, the dependency graph indicates in which
order these functions must be computed.
Computable: A computable represents an object
that can be computed on screenshots or derived
results. A computable can be associated to work-
flows by the intermediate of their dependency
graph. A given workflow can be associated mul-
tiple times with the same computable by adding
several computable instances of the computable
to the dependecy graph. A computable can take
several parameters as input and returns an out-
put. This result will be passed to subsequent com-
putable instances according to the related depen-
dency graph. Not all computables are computed
directly on screenshots as some may require the
result of intermediate computations in order to be
executed with the rights parameters.
Computable Instance: A computable instance is an
entity representing the actual integration of a com-
putable into a workflow. A dependecy graph
can have multiple computable instances being in-
stance of one or more computables. Computables
can be related to multiple computable instances,
GUIMETRICS: An Extensible Cloud-based Application for Automatic Computation of GUI Visual Design Measures
507
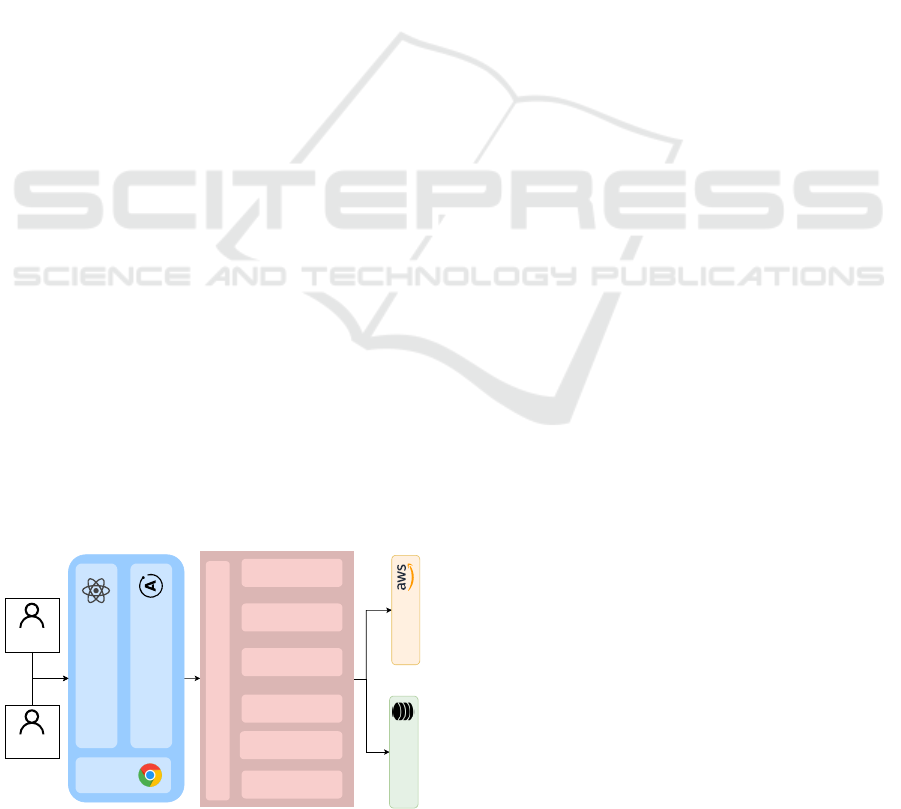
in different dependency graphs but also inside the
same dependency graph (e.g. in the case we want
to compute the same computable with input pa-
rameters being computed in different ways).
Run: A run corresponds to the request of an user
to compute a given workflow on a given gallery.
Each time an user asks the application to compute
a workflow on a gallery, a run entity is created.
Computation: A computation represents the actual
computation of a computable instance on a spe-
cific screenshot. This entity is characterized by
the screenshot and the computable instance it is
related to and the result of the actual computation.
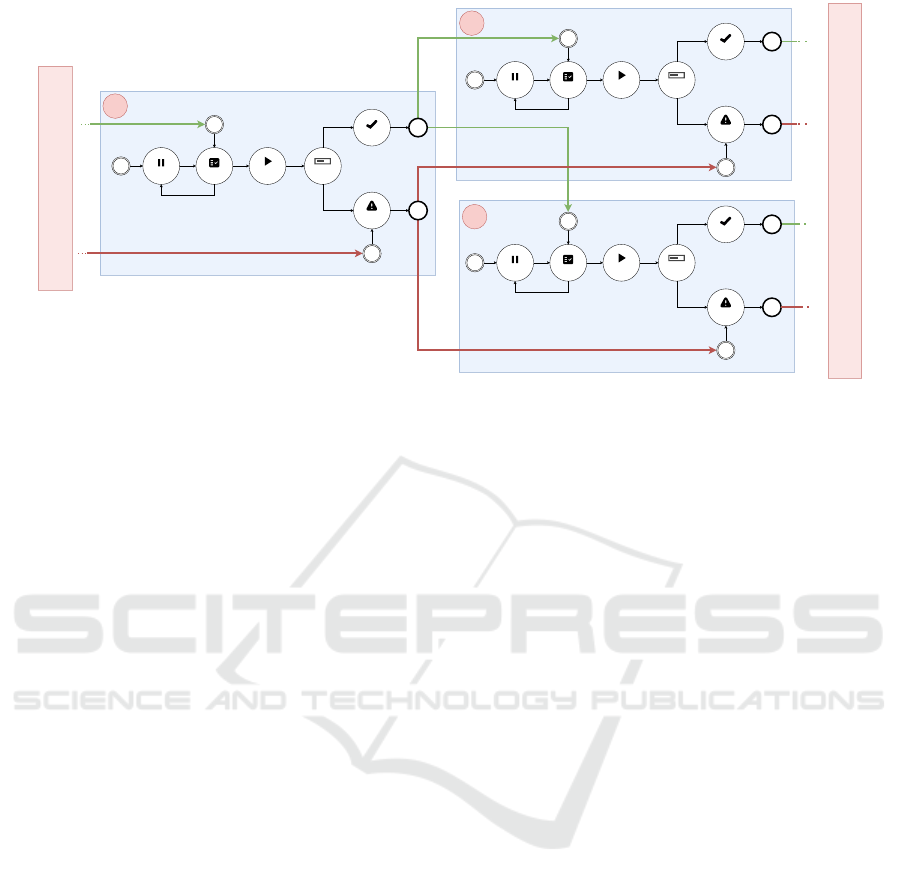
3.3 Architecture and Implementation
The application is built according to a 3-tier archi-
tecture, i.e the frontend tier, the backend tier and the
database tier. The frontend is built using React and
Apollo GraphQL for data fetching. The backend side
of the application is composed of a Node.js server
and a MongoDB database. Aside of these 3-layer ar-
chitecture, the application uses external services such
as Amazon Web Services (abbreviated AWS) S3 for
storage and AWS Elastic Container Service (ECS) for
the computation of measures. A high-level overview
of the architecture is reproduced in Fig. 3.
3.3.1 Automatic Screenshot Capture
In GUIMETRICS, users have to create a gallery be-
fore capturing or uploading screenshots. They have to
specify a title and a description for the gallery. Once
the gallery is created, experimenters have the possibil-
ity to add websites and resolutions to the gallery by
specifying the URL and width, height, pixel density
and if the screenshot has to be taken on an emulated
mobile device or not respectively. The backend ser-
vices will then launch a set of AWS ECS tasks based
on a Docker image tailored for the screenshot capture
process. For each task, specific parameters will be
REACT
Apollo-client
Browser
Workflow
Service
Computable
Service
Computable
instance Service
Computation
Service
AWS
Service
GRAPHQL API
...
AWS API
DATABASE
USER
USER
Figure 3: Overview of GUIMETRICS Architecture.
passed regarding the screenshot to be captured. Once
the screenshots captured, the user manages them in
the corresponding gallery page.
3.3.2 Incremental Development of Measures
GUIMETRICS enables users to define measures that
can be computed over GUIs. Measures such as bal-
ance or equilibrium (Ngo et al., 2003) could require
intermediate computations (e.g. the segmentation of
an UI into zones) that are not themselves considered
as measures. For this reason, GUIMETRICS defines
a broader concept called computable which encom-
passes the notion of measure (see section 3.2). Users
can create computables in the application by provid-
ing the source code and dependencies file. The mea-
sures must implement a defined interface in order to
be valid and executed in the context of a workflow.
Once created, a computable can be associated to a
workflow by the mean of a computable instance (see
section 3.2). A workflow can have multiple instances
of the same computable and vice versa. Computable
instances are organized in a workflow by the interme-
diate of a dependency graph (see section 3.2), which
is a Directed Acyclic Graph (DAG) indicating the de-
pendencies between the computable instances inside a
workflow. When creating a computable instance, the
user has to provide the underlying computable, the
name of the output, and the list of dependencies (i.e.,
the computable instances the one being created de-
pends on) with, for each dependency, the related pa-
rameter name in the code of the computation instance
being created. This parameter mapping is required
due to the fact that several computable instances may
have another particular computable instance as com-
mon dependency, while expecting the output of that
dependency under different parameter names.
Thanks to this support, the researcher, the exper-
imenter or the designer is able not only to reuse ex-
isting measures in multiple experiments with a lim-
ited amount of workload, but also investigate new
measures by composing existing ones into a weighted
model or another model and/or by incorporating other
measure, even computed by other modules or toolkits,
such as AIM (Oulasvirta et al., 2018).
3.3.3 Execution of Workflows on Galleries
The computation of measures on GUIs in GUIMET-
RICS is performed through the creation of runs (see
section 3.2). When creating a run, the user has to
specify the underlying workflow and gallery. The
backend of GUIMETRICS will then create a computa-
tion for each pair of computable instance and screen-
shot. This entity will contain the result of the actual
ICSOFT 2021 - 16th International Conference on Software Technologies
508
LAUNCHABLE
RUNNING
IDLE
CHECK
LAUNCHABLE
COMPLETED
ERROR
RUNNING
IDLE
CHECK
LAUNCHABLE
COMPLETED
ERROR
RUNNING
IDLE
CHECK
COMPLETED
ERROR
A
B
C
PREVIOUS COMPUTATIONS
NEXT COMPUTATIONS
uilab_computations_workflow_horizontal https://app.diagrams.net/
1 sur 1 18/05/2021, 19:14
Figure 4: GUIMETRICS computations: Finite State Machine (A) and Execution flow (A, B and C).
computation of the related computable instance on the
screenshot. The lifecycle of each computation can be
described by a finite state machine such as illustrated
in Fig. 4(A), which states are described as follows:
Idle: When a run is created, associated computa-
tion entities are created and set initially in the
IDLE state. After creating all the required com-
putations, the backend updates the state of all of
computations without dependencies to the CHECK
state.
Check: When a computation enters the CHECK state,
the GUIMETRICS backend verifies that all the
computations associated to the dependencies of
the current computation are in the COMPLETED
state, if any. If so, the backend put the compu-
tation in the LAUNCHABLE state, otherwise it put
the computation back in the IDLE state.
Launchable: When a computation enters the
LAUNCHABLE state, the backend aggregates the
results of the computation of its dependencies in
a file that is made available online in an AWS S3
repository. The backend then triggers the creation
of an AWS ECS task. This task will run a Docker
container tailored for measure computation that
will gather all the required information for the
computation (i.e., the parameters previously
aggregated, the screenshot to evaluate, the source
code, and the dependencies file of the com-
putable) and will put the computation in either
COMPLETED or ERROR state in database, along
with the results of the computation.
Completed: When a computation is marked as COM-
PLETED, the backend of GUIMETRICS will put all
of the dependent computations in the CHECK state
(see the green arrows in Fig. 4).
Error: When a computation is marked as ERROR,
the backend of GUIMETRICS will put all of the
dependent computations in the ERROR state, lead-
ing to a chain reaction of error propagation among
computations (see the red arrows in Fig. 4).
4 A STUDY OF VISUAL
AESTHETICS
To illustrate the usage of GUIMETRICS, we con-
ducted an experiment to investigate the relationship
between the features of visual aesthetics of websites
UIs and their perceived visual appeal.
4.1 Method for the Experiment
To investigate the relationship between the perceived
visual appeal of UIs and the computed measures,
we collected data regarding the user perception of
visual appeal for shopping websites on smartphones
(Fig. 1). The user-led approach for aesthetics is
captured via a five-point rating of the home page of
each website. The computationally-based approach
is achieved by automatic computation of sixteen
aesthetic measures by GUIMETRICS. Consequently,
the research question is stated with its accompanying
hypothesis as follows:
RQ1: Does visual design represents a good indicator
of aesthetics of shopping sites on smartphones?
H
11
: Measures computed by GUIMETRICS are
predictors of UI aesthetics for electronic commerce
web sites on smartphones.
GUIMETRICS: An Extensible Cloud-based Application for Automatic Computation of GUI Visual Design Measures
509

Table 1: Descriptive statistics for aesthetic measures: M=mean, SD=standard deviation, SE=standard error.
Aesthetic measure N M SD Variance Range Min. Max. Skewness Skewness (SE) Kurtosis Kurtosis (SE)
Saliency balance 2105 0.711 0.147 0.022 0.925 0.021 0.946 -1092.000 0.053 2709.000 0.107
Border balance 1788 0.705 0.164 0.027 0.749 0.224 0.973 -0.401 0.058 -0.389 0.116
Border density 1788 0.063 0.038 0.001 0.206 0.002 0.208 1033.000 0.058 1057.000 0.116
Color density 2105 0.373 0.150 0.023 0.675 0.004 0.679 -0.487 0.053 -0.283 0.107
Colorfulness 2105 0.472 0.266 0.071 0.999 0.001 1.000 0.466 0.053 -0.652 0.107
Compression complexity 2105 0.255 0.084 0.007 0.619 0.076 0.695 2126.000 0.053 7426.000 0.107
Balance 2105 0.756 0.167 0.028 0.833 0.164 0.996 -0.858 0.053 0.574 0.107
Vertical balance 2105 0.645 0.245 0.060 0.999 0.000 0.999 -0.443 0.053 -0.629 0.107
Horizontal balance 2105 0.868 0.199 0.039 0.915 0.085 1.000 -2356.000 0.053 5025.000 0.107
Equilibrium 2105 0.951 0.050 0.002 0.545 0.448 0.993 -7126.000 0.053 64036.000 0.107
Density 2105 0.556 0.188 0.035 0.892 0.104 0.997 0.129 0.053 -0.206 0.107
Center alignment 2105 0.365 0.162 0.026 0.750 0.000 0.750 -0.296 0.053 0.243 0.107
External alignment 2105 0.076 0.080 0.006 0.385 0.000 0.385 1125.000 0.053 1254.000 0.107
Concentricity 2105 0.579 0.099 0.010 0.527 0.268 0.795 -0.324 0.053 -0.194 0.107
Simplicity 2105 0.338 0.111 0.012 0.583 0.001 0.585 -0.182 0.053 -0.456 0.107
Symmetry 2105 0.460 0.028 0.001 0.136 0.392 0.528 0.127 0.053 0.006 0.107
By answering this question, we hope to have a
clearer view on how to measure and quantify aesthet-
ics of electronic commerce web sites on smartphones.
We will identify what are the most important aesthetic
measures as well as the correlation of those variables
with the perceived visual appeal of the different e-
commerce web sites. To perform this analysis, we
explain our research method in the next section.
4.2 Research Method
Fig. 1 provides an overview of the research method
decomposed into the following steps (Fig. 1):
1. Distribution calculation: we selected the 100 elec-
tronic commerce web sites best ranked by Alexa
in the Shopping category
2
by applying a distribu-
tion key based on the sub-categories frequencies
since this category is itself made up of several sub-
categories, e.g. “Antiques and Collectibles (2,498
sites)” and “Auctions (203 web sites)”.
2. URL extraction and screenshot: the URL of the
100 web sites was extracted and a screenshot
of their homepage is automatically captured (see
Section 3.3.1) on a smartphone with a 414 × 732
resolution and a device pixel ratio (DPR)=3.5 in
portrait mode and saved in a PNG file.
3. Metric computation: By using GUIMETRICS with
a workflow and computables set up adequately,
sixteen aesthetic measures (Ngo et al., 2003;
Tuch et al., 2012; Miniukovich and De Angeli,
2014) were automatically computed such as bal-
ance, equilibrium, simplicity, symmetry, density,
horizontal/vertical balance, central/external align-
2
See https://www.alexa.com/topsites/category/
shopping. Note that Alexa removed this page on September
17th, 2020, after we conducted the experiment. This is
explained in https://support.alexa.com/hc/en-us/articles/
360051913314.
ment, saliency, and the compression complexity.
4. Online rating by participants: we recruited partic-
ipants from an internal mailing list of volunteers
to provide a rating on a 5-point scale (1=the least
aesthetic to 5=the most aesthetic) for each screen-
shot based on a web application used internally to
collect user-related data. The rating was captured
by one to five stars at the bottom of each screen-
shot (see (6)).
5. Descriptive statistics analysis: we performed de-
scriptive statistics of each individual variable.
6. Inferential statistics analysis: we performed infer-
ential statistics on variables considered together.
5 RESULTS AND DISCUSSION
From the initial pool of the 100 web sites, we with-
drew 10 web sites for various reasons: their home
page was not available at the time of the experiment,
their home page contains a splash screen or an ini-
tial animation, some parts of the page were missing.
Therefore, the analyses will cover only N=90 web
sites. From the initial sampling of thirty-two partic-
ipants, two were considered as outliers as they did not
properly completed the on-line rating.
5.1 Descriptive Statistics of Variables
Table 1 summarizes the statistical properties of the ag-
gregated aesthetic measures for the N=90 web sites
considered in this experiment. These variables are
very volatile as their means and standard deviations
are very different. The range is relatively high for
each measure, as well as the standard deviation (from
3% to 27%). The Skewness value of the variables
are not equal to 0, thus meaning that their distribu-
tion is not symmetric. A Shapiro-Wilk normality test
ICSOFT 2021 - 16th International Conference on Software Technologies
510
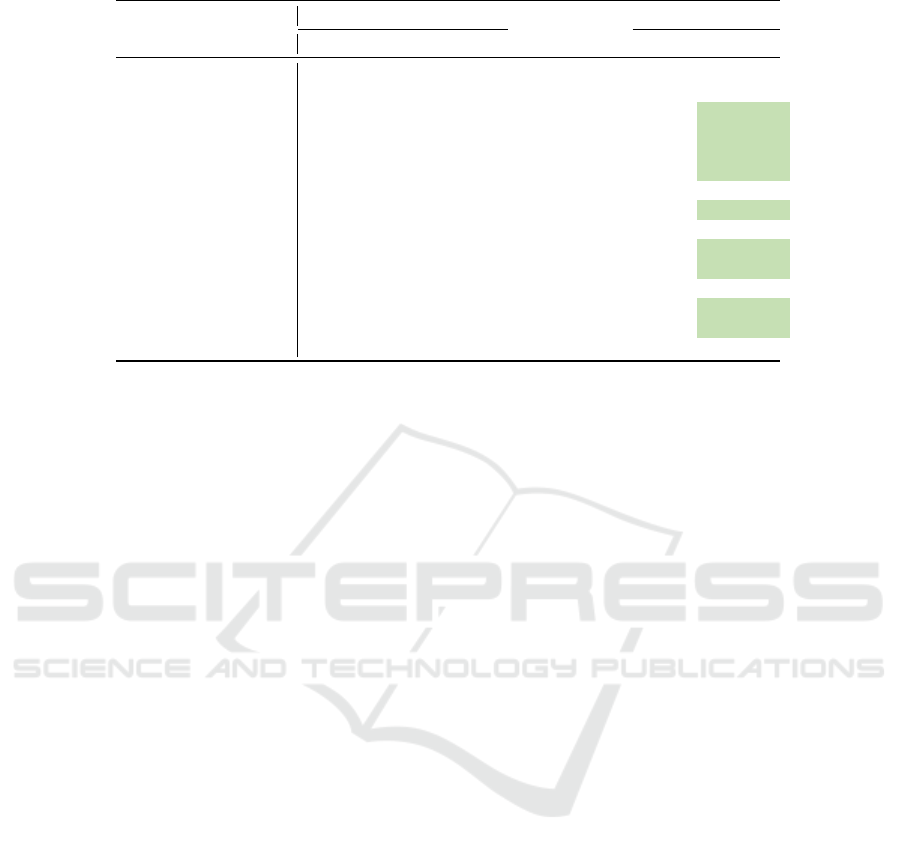
Table 2: Individual Measures significances.
Aesthetic measure Unstandardized coefficients Std. coefficient t Sig.
B Std. error β
Saliency balance 0.256 0.200 0.033 1.279 0.201, n.s.
Border balance -0.113 0.167 -0.016 -0.678 0.498, n.s.
Border density 3.765 0.902 0.127 4.173
∗∗∗
≤0.001
Color density 0.547 0.205 0.076 2.671
∗∗
=0.008
Colorfulness -0.417 0.115 -0.100 -3.634
∗∗∗
≤0.001
Compression complexity -2.100 0.406 -0.155 -5.174
∗∗∗
≤0.001
Vertical balance -0.202 0.118 -0.043 -1.712 0.087, n.s.
Horizontal balance 0.500 0.145 0.093 3.446
∗∗∗
=0.001
Equilibrium -0.450 0.578 -0.020 -0.780 0.436, n.s.
Density -1.600 0.337 -0.275 -4.746
∗∗∗
≤0.001
Center alignment 0.546 0.236 0.076 2.311
∗
≤0.021
External alignment 0.307 0.411 0.020 0.747 0.455, n.s.
Concentricity -1.276 0.308 -0.114 -4.149
∗∗∗
≤0.001
Simplicity -3.695 0.592 -0.377 -6.245
∗∗∗
≤0.001
Symmetry -1.169 0.980 -0.029 -1.193 0.233, n.s.
proves that the measures significantly deviate from a
normal distribution (all values > 0.940 apart for com-
pression with d=.795 and equilibrium with d=.409,
all p
∗∗∗
≤0.001). For example, the concentricity has a
low minimum (around 0.3), a close maximum (around
0.8), a large first quartile (around 0.5), a high median
(around 0.58), and an important third quartile (around
0.65). While some measures share similar distribu-
tions, such as color density and center alignment, they
are not correlated with each other. Balance is an im-
portant influencing factor of visual appeal: it confirms
that the visual weight of any zone is linked to how
prominent it appears compared to all other zones sur-
rounding it (Chettaoui and Bouhlel, 2018; Zain et al.,
2008). Balance is further decomposed in horizon-
tal and vertical balance. Overall, the web sites are
highly balanced but their horizontal balance remains
the main driver of overall balance (high mean, low
standard deviation) on the contrary of vertical balance
which is more widespread.
5.2 Inferential Statistics
In order to address RQ1 and its related hypothesis
H
11
, we ran a multiple linear regression on the col-
lected data with the AVERAGE RATING given by par-
ticipants as dependent variable and the AESTHETIC
MEASURES as independent variables.
Table 2 shows the influence of each aesthetic vari-
able on the average rating. The variables having the
most positive impact are border density (B=3.765,
p
∗∗∗
), color density (B=0.547, p
∗∗
), horizontal bal-
ance (B=0.5, p
∗∗∗
), and center alignment (B=0.546,
p
∗
). Some other variables have a negative impact,
such as the compression complexity (B=−2.100,
p
∗∗∗
), concentricity (B=−1.276, p
∗∗∗
) and simplic-
ity (B=−3.695, p
∗∗∗
). The results obtained for com-
plexity are aligned with those from the experience of
Tuch et al. (Tuch et al., 2012): users prefer an UI with
a lower complexity. The interpretation of the differ-
ent numbers is as follows: if the border density in-
creases by 0.1, then the average rating increases by
0.1 × 3.765 = 0.376.
To further investigate this influence, we com-
puted R=0.317, hence R
2
=0.1, and the adjusted co-
efficient AR
2
=0.093, which means that only 9.3%
(a low value) of the variance of the average rating
is explained by the variation of the aesthetic mea-
sure. The Residual Standard Error is RSE=1.067,
thus enabling us to calculate the Percentage Error:
PE=RSE/M=1.067/2.64 = 40%, which is impor-
tant. From these results and the last column of Ta-
ble 2, we conclude the the null hypothesis H
10
is re-
jected for the following aesthetic measures: border
density, colorfulness, compression complexity, hor-
izontal balance, density, concentricity, and simplic-
ity. These measures are statistically significant for
the linear regression model whereas the other mea-
sures are not. Taking these measures as a whole in
the model, we also reject the null hypothesis for it
(df =15, M=14.991, F=13.158, very highly signifi-
cant: p
∗∗∗
). The resulting model thus states that:
AVERAGE RATING = 3.765 × border density-
0.417 × colorfulness -2.1× compression complexity
+ 0.5 × horizontal balance -1.6 × density -1.276 ×
concentricity -3.695 × simplicity. In conclusion, aes-
thetic measures are predictors of the average rating
with a large effect size (d>0.8) and a very high sig-
nificance, but only seven measures should be assem-
bled to produce the significant model and only 9.3%
of its variance is explained.
GUIMETRICS: An Extensible Cloud-based Application for Automatic Computation of GUI Visual Design Measures
511

6 CONCLUSION
Over the years, visual design of GUIs has been stud-
ied under a large variety of aspects. Its impact on
other dimensions has also been demonstrated. How-
ever, despites the growing interest in the field, a large
number of processes implied in the study of GUI vi-
sual design remains heavily manual. This mandatory
human intervention in the process induces a high vari-
ability in the results and hinders the validity of sci-
entific claims of experimental studies on GUI visual
design. In this paper, we introduced GUIMETRICS,
a web application for automating the computation of
measures on GUI visual design. The application is
built around the concept of directed acyclic graph for
constructing workflows of measures. The applica-
tion allows for the addition of new measures without
the need to change the core of the application. To
exemplify GUIMETRICS and its process, we lead a
proof-of-concept experiment on GUI visual design to
study the relationship between computed features of
GUIs and their perceived aesthetics using 100 web-
sites from Alexa ranking. The formulated hypothesis
was supported for some measures but the overall lin-
ear model only predicted 9.3% of the variance.
REFERENCES
Abran, A., Khelifi, A., Suryn, W., and Seffah, A. (2003).
Usability meanings and interpretations in iso stan-
dards. Software Quality Journal, 11(4):325–338.
Alemerien, K. and Magel, K. (2014). GUIEvaluator: A
metric-tool for evaluating the complexity of graphical
user interfaces. In SEKE’04.
Bakaev, M., Heil, S., Khvorostov, V., and Gaedke, M.
(2019). Auto-extraction and integration of metrics
for web user interfaces. Journal of Web Engineering
(JWE), 17:561–590.
Camargo, M. C., Barros, R. M., and Barros, V. T. O. (2018).
Visual design checklist for graphical user interface
(gui) evaluation. In Proc. of the 33rd Annual ACM
Symposium on Applied Computing, SAC ’18, pages
670–672, New York, NY, USA. ACM.
Chettaoui, N. and Bouhlel, M. S. (2018). I2evaluator: An
aesthetic metric-tool for evaluating the usability of
adaptive user interfaces. In Proc. of the Int. Conf. on
Advanced Intelligent Systems and Informatics 2017,
pages 374–383, Cham. Springer.
Dupuy-Chessa, S., Laurillau, Y., and C
´
eret, E. (2016).
Considering aesthetics and usability temporalities in
a model based development process. In Proc. of 28th
Conf. Francophone on Human-Computer Interaction,
IHM ’16, pages 25–35, New York, NY, USA. ACM.
Gonz
´
alez, S., Montero, F., and Gonz
´
alez, P. (2012).
Balores: A suite of principles and metrics for graphi-
cal user interface evaluation. In Proc. of the 13th Int.
Conf. on Interacci
´
on Persona-Ordenador, INTERAC-
CION ’12, New York, NY, USA. ACM.
Hartono, E. and Holsapple, C. W. (2019). Website visual
design qualities: A threefold framework. ACM Trans.
Manage. Inf. Syst., 10(1).
ISO (2019). ISO/IEC 25010 - Software Quality Product
Standard. standard, Int. Standard Org., Geneva.
Ivory, M. Y. and Hearst, M. A. (2002). Statistical profiles of
highly-rated web sites. In Proceedings of the SIGCHI
Conference on Human Factors in Computing Systems,
CHI ’02, pages 367–374, New York, NY, USA. ACM.
Miniukovich, A. and De Angeli, A. (2014). Visual im-
pressions of mobile app interfaces. In Proc. of the
8th Nordic Conf. on Human-Computer Interaction,
NordiCHI ’14, pages 31–40, New York, USA. ACM.
Ngo, D. C. L., Teo, L. S., and Byrne, J. G. (2003). Mod-
elling interface aesthetics. Inf. Sci., 152(1):25–46.
Oulasvirta, A., De Pascale, S., Koch, J., Langerak, T., Joki-
nen, J., Todi, K., Laine, M., Kristhombuge, M., Zhu,
Y., Miniukovich, A., Palmas, G., and Weinkauf, T.
(2018). Aalto interface metrics (AIM): A service and
codebase for computational GUI evaluation. In Adj.
Proc. of the 31st Annual ACM Symposium on User
Interface Software and Technology, UIST ’18, pages
16–19, New York, NY, USA. ACM.
Pr
¨
oll, S., Rauber, A., and Meixner, K. (2016). Precise data
identification services for long tail research data. In
Proc. of the 13th Int. Conf. on Digital Preservation.
Seffah, A., Donyaee, M., Kline, R., and Padda, H. (2006).
Usability measurement and metrics: A consolidated
model. Software Quality Journal, 14:159–178.
Sonderegger, A. and Sauer, J. (2009). The influence of de-
sign aesthetics in usability testing: Effects on user
performance and perceived usability. Applied er-
gonomics, 41:403–410.
Tractinsky, N., Katz, A., and Ikar, D. (2000). What is beau-
tiful is usable. Int. with Comp., 13(2):127–145.
Tuch, A. N., Presslaber, E. E., St
¨
ocklin, M., Opwis, K., and
Bargas-Avila, J. A. (2012). The role of visual com-
plexity and prototypicality regarding first impression
of websites: Working towards understanding aesthetic
judgments. IJHCS, 70(11):794 – 811.
Vanderdonckt, J. and Gillo, X. (1994). Visual techniques
for traditional and multimedia layouts. In Proc. of
ACM Int. Conf. on Advanced Visual Interfaces, AVI
’04, page 95–104, New York, NY, USA. ACM.
Zain, J. M., Tey, M., and Soon, G. Y. (2008). Using aes-
thetic measurement application (AMA) to measure
aesthetics of web page interfaces. In Proc. of 4th Int.
Conf. on Natural Computation, ICNC ’08, pages 96–
100. IEEE Computer Society.
Zen, M. and Vanderdonckt, J. (2014). Towards an evalu-
ation of graphical user interfaces aesthetics based on
metrics. In Proc. of IEEE 8th Int. Conf. on Research
Challenges in Information Science (RCIS), pages 1–
12, New York, USA. IEEE.
ICSOFT 2021 - 16th International Conference on Software Technologies
512
