
Shade Dispersion using TCT Configuration of PV Array System
under Non-uniform Irradiation: Experimental Study
Sandeep Rawat
1
, Reetu Naudiyal
1
, Yogesh K. Chauhan
2
, Rupendra Kumar Pachauri
3
1
Department of Electrical Engineering, University Polytechnic Uttaranchal University, Dehradun, India
2
EED, Kamla Nehru Institute of Technology, Sultanpur, Uttar Pradesh, India
3
EED, School of Engineering, University of Petroleum and Energy Studies, Dehradun, India
Keywords: Solar energy, series-parallel connection. Total-cross-tied connection, power losses, power, fill factor
Abstract: An experimental analysis to evaluate the depletion of solar photovoltaic (PV) system under the
weather.exploring the effects of blurring on the PV system under varying degrees of solar radiation In the
present study, four panels of PV solar modules (20W, Manf: Usha Solar)subject to parallel (SP) weather
forecast and cross-sectional rate-arrested (TCT). The test set contains an electrical performance
ratingdevices with a flexible load to test the performance of the PV system under artificial lighting fixtures.
In addition, performance similarities were performed over PV modules programmed into the SP and TCT
modified PV modules under the shading I-II test case. The abnormal behavior of current-voltage (V-V) and
power-voltage (P-V) curves in the presence ofmultiple power points such as ground mass points (GMPPT)
and local maximum power points (LMPP) help to obtain a comprehensive analysis. In addition,
performance indicator parameters suchas GMPP power, low power loss and fill factor (FF) were tested in
both PV power assumption under separating shadow cases.
1 INTRODUCTION
The usage of electrical power is on the rise gradually
as a result of transportation and communication
systems etc. A very big part of energy generation is
based on fossil fuels such as diesel, petrol and gas
etc. It is well known that due to scarcity and limited
storage capacity of fossil fuels, the researchers are
doing extensive work toward searching of some more
alternative energy sources. Today, renewable energy
sources like PV, wind turbine and bio-fuel etc. are
gaining popularity due to advantageous features.
Especially, solar PV system is more acceptable in
society because no advanced skills are required to
use it. As the solar PV system is eco- friendly in
nature and it is the most useful system for power
generation in current scenarios in domestic and
commercial areas. The variation of sun irradiation
potential and/or non-uniform nature with respect to
time is a major concern about the PV system
performance reduction. Now-a-days, various
researchers are exploring the solution to enhance the
PV system performance under the influence of
prevailing geographical conditions. The major effect
of shading effect is observed in rural and urban areas
due to various causes such as high-rise commercial
buildings such as malls, hospitals, corporate offices.
All these shadow test cases have major causes of
partial shading conditions (PSCs), which are
responsible to reduce the PV system performance
directly. Various advanced methods are available to
reduce the impact of shading out of which one of the
most suitable methods available in present scenario is
reconfiguration of PV modules in PV array schemes
as are reported in the recent available literature from
the year of spam 2013-2020.
In fact, different levels of irradiation occur during
PSCs throughout the PV array system. As a result of
this inconsistent radiation exposure to the PV list, it
appears that many peaks of high-power points such
as local and global power point (LMPP& GMPP) in
the indirect environment of PV and IV signals.
Comprehensive comparative studies of various
configurations were conducted to determine the
optimal setting on the basis of performance
measurement tests. Typically, the demand for loading
power is fulfilled by installing solar modules in a
series of interlocking modes.Because of the dimming
of one or more panels, the PV array output power
decreases. The authors have prepared a complete
Rawat, S., Naudiyal, R., Chauhan, Y. and Pachauri, R.
Shade Dispersion using TCT Configuration of PV Array System under Non-uniform Irradiation: Experimental Study.
DOI: 10.5220/0010567800003161
In Proceedings of the 3rd International Conference on Advanced Computing and Software Engineering (ICACSE 2021), pages 267-272
ISBN: 978-989-758-544-9
Copyright
c
2022 by SCITEPRESS – Science and Technology Publications, Lda. All rights reserved
267
cross-tied (TCT) connection of the modules in the
PV series. Basically, several experiments were
performed to compare the results obtained such as
power loss, FF position and GMPP preparation for
both under four types of blurring cases such as short
narrow (SN), short wide (SW), narrow wide (NW)
and long length (LW). ). Local and GMPPs were
identified in the experimental study and validated
with the MATLAB / Simulink model under sham
conditions (Rani, et al., 2013). The authors reviewed
the experimental studies with the MATLAB /
Simulink that attempted to achieve MPP during the
series PV modules (SP), TCT and bridge-link (BL),
and it is evident that the TCT suspension is more
favorable than the other two (Koray , 2014). The
authors conducted a study on the series and similar
connections of the PV array under three dimming
conditions. With the corresponding link developed
by FF, a relatively different loss (MML) and a small
number of GMPPs were obtained (Vijaylekshmy, et
al., 2014). The authors have learned ways to enhance
PSC the effects of name distribution on the TCT PV
panel link and compare results with the Su-Do-Ku
puzzle connection based on increased power,
improved FF and low power coal (Bai, et al., 2015).
The authors have proposed various ways to install
PV such as series-parallel (SP), TCT, honey-comb
(HC), bridge-link (BL) and proposed a new
suspension of the list. 6×6 PV size for test research
under PSCs and that ‘new’ suspension has a better
response than others (Malathy and Ramaprabha,
2015). The authors see the passing of clouds because
of the shadow on the PV list to study in the
preparation of SP, HC, BL, TCT and Su-Do-Ku.
Under the contrast pattern of standard TCT and Su-
Do-Ku redesigned TCT (RTCT) suspension puzzle
shows better results (Vijaylekshmy, et al., 2015a).
The authors investigated TCT suspension, hybrid SP-
TCT and Su-Do-Ku found that Su-Do-Ku suspension
connections to PV panels show better results in
features of high FF, low power loss and a small
number of -MPP (smooth PV curve) (Vijaylekshmy,
et al., 2015b). The authors converted the standard
TCT suspension into a Magic Square (MS) puzzle for
various shading conditions such as SW, LW, SN and
LN and found that MS suspensions have the best
effects on all shading situations (Samikannu, et al.,
2016). A good connection of the PV panel to a
particular compound being investigated and the
juxtaposition and regular SP and TCT connection of
the panels under partial blurring results and shows
better performance of the good connection of the PV
panels proposed by the authors (Bana and Sign, 2017
). The authors investigated the configuration of SP,
BL and TCT and compared the shadow dispersion
scheme (SDS) for electrical connection of PV array
under LN and SW shadow connection and found that
SDS had the best results among all configurations (
Satpathy, et al., 2017). The authors performed a
performance evaluation of the PV system to assess
the impacts of the model and verified it with
MATLAB / Simulink modeling to ensure the
reliability of a given model (Lamri, et al., 2018).
The scheme of this studyis divided into as.
Section I description of thethe paper. The notable
points of study are given in Section II. Section III
briefs the novelty of work done in paper. In section
IV, results and discussion is summarized and section
V concludes in the paper.
1.1 Novelty of Work
In this paper, hypothetical investigation is performed
to estimate I–V and P–V bends of 2x2 size PV
system by showing PSCs impact.The important
points of present study are summarized as,
In order to study the experimental comparison
of SP-TCT configuration, two type of shading
cases used.
Experimental results are useful for estimating
the performances of PV systems under PSCs.
2 PV SYSTEM TECHNOLOGY
AND EXPERIMENTAL SETUP
Lower conversion efficiency of solar PV system
from sun light intensity into electrical energy forces
to add more PV module systems in series and parallel
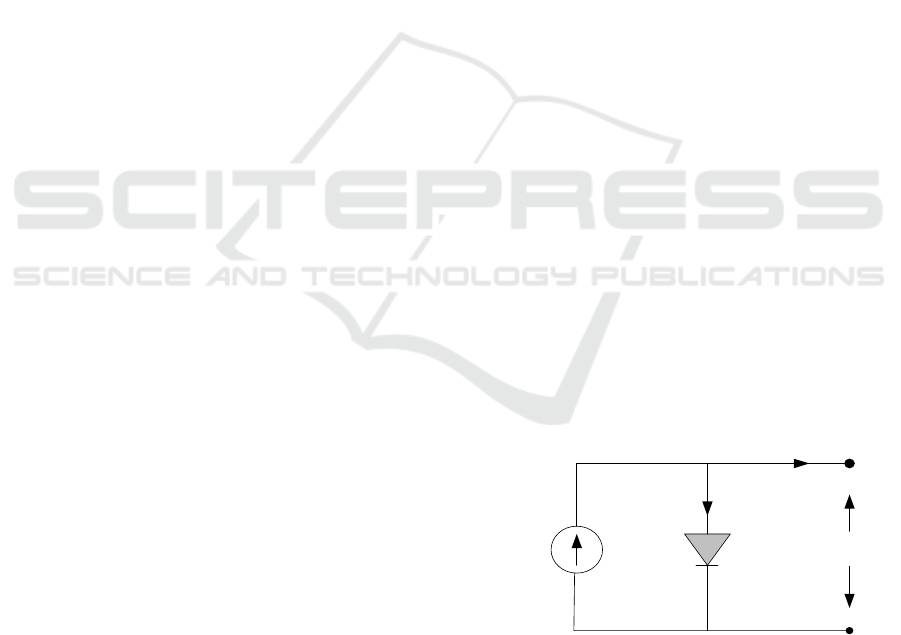
for providing power assistance to load.The technical
balancing circuit of PV module as given in Fig. 1 as,
_
D
I
ph
I
I
cell
V
tota
l
Diode
Figure 1: Illustrative diagram of PV system
The deliberated current of solar cell (
cell
I
) is given
in Eq. (1) and (2) as,
cell ph D
III
(1)
ICACSE 2021 - International Conference on Advanced Computing and Software Engineering
268
exp 1
C
C
qV
AkT
cell ph o
III
(2)
Where,
p
h
I
: cell photocurrent (A),
D
I
: diode
current (A),
o
I
: Reverse saturation current (A),
q
:
charge of electron (Coulomb),
C
V
: cell voltage (V),
A
: ideality factor,
k
: Boltzmann’s constant (J/K),
C
T
: cell temperature (
o
C).
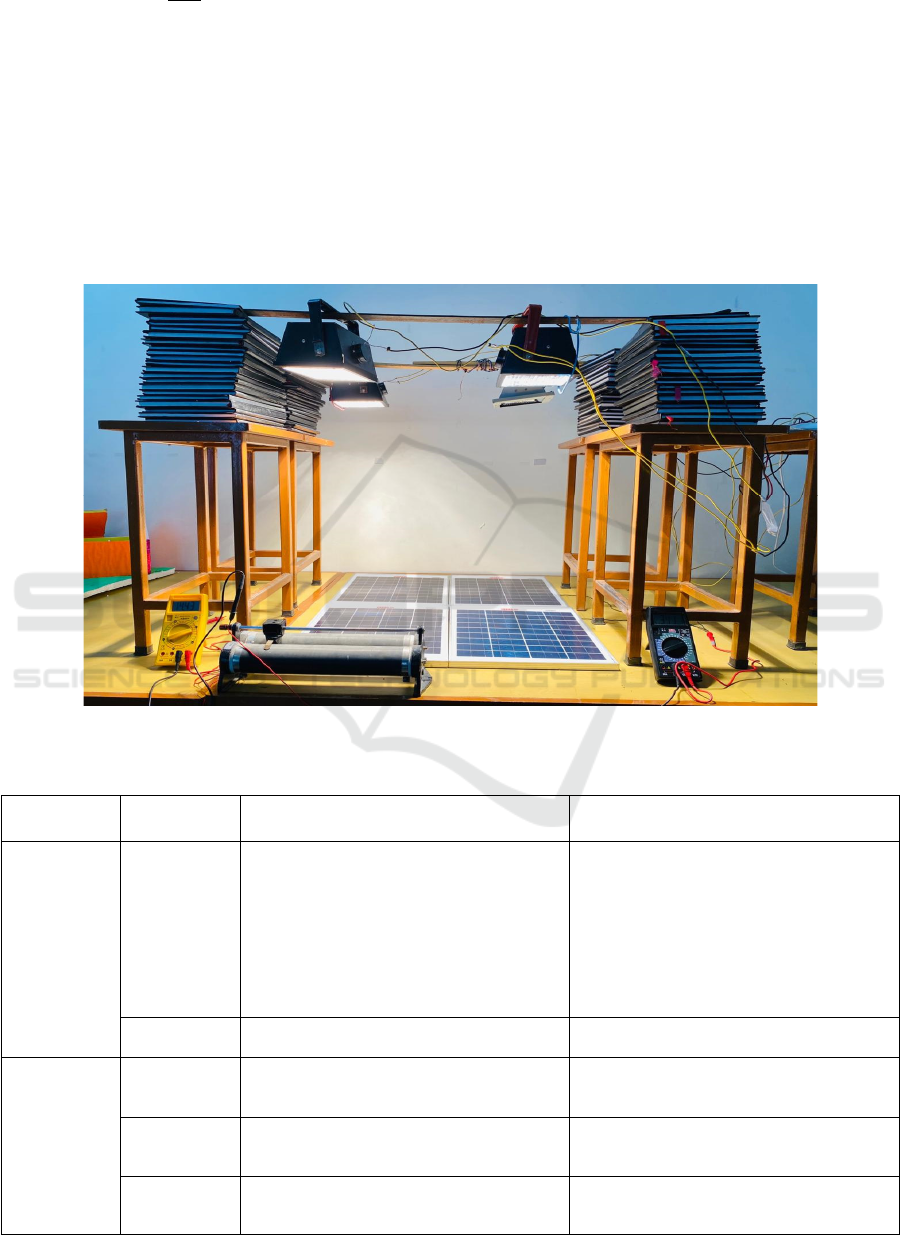
The installed experimental setup is mainly
divided into two section i.e. solar PV array and
performance measurement system. In first section PV
array comprised with 2×2 PV modules integrated in
SP and TCT connections. Second section headed
with performance measurement system. Two
multimeters are used with resistive load to measure
the real time voltage and current for analysis the
performance. Performance index of installed system
is done to show the impact on voltage and current by
observation of I-V and P-V curves. The specification
along with utility of all the auxiliary parts to
comprise the experimental set up are given in table-1
with the experimental setup, shown in Fig. 2 as,
Figure 2: Experimental system for study
Table 1: Provision and role of supportive parts of Laboratory setup
Segment Parts Provision Role
Solar PV
array(2x2)
PV array
system
Power: 20 W
O. C. voltage: 21.997 V
S. C. current: 1.2586 A
Impp: 1.12A, Vmpp: 18V
PV module no.: 4 (2x2 array)
Cell technology: Poly-Si
Dimension (mm): 356×490×25
Manf.: USHA SHRIRAM Technologies
(Model NO: US 20/12V)
2x2 size PV array is used to design SP, TCT
configurations for performance investigation
is carried out shadow test cases.
Artificial
solar lamp
Total number of lamps- 4(2x2)
Light intensity 50- 650W/m2
Solar lamp for light intensity to perform study
Performance
measurement
system
Multi-meter
used as
ammeter
Number of ammeter: 1
Measurement range: 0.01 to 10A DC
Mastech Technology
Measurement of voltage
ofSP,TCTconfigurations under different test
cases.
Multi-meter
used as
voltmeter
No. of voltmeter: 1
Measurement range: 0.1 to 250V DC
Mastech Technology
Measurement of current of SP, TCT
configurations under different test cases.
Decade resistive
load
Number of resistive load:2
Range: 0.1 to 250 ohm
Variable load (decade resistive box) is used to
characterize the solar PV system from 0 Ω to
maximum required load accordingly.
Shade Dispersion using TCT Configuration of PV Array System under Non-uniform Irradiation: Experimental Study
269
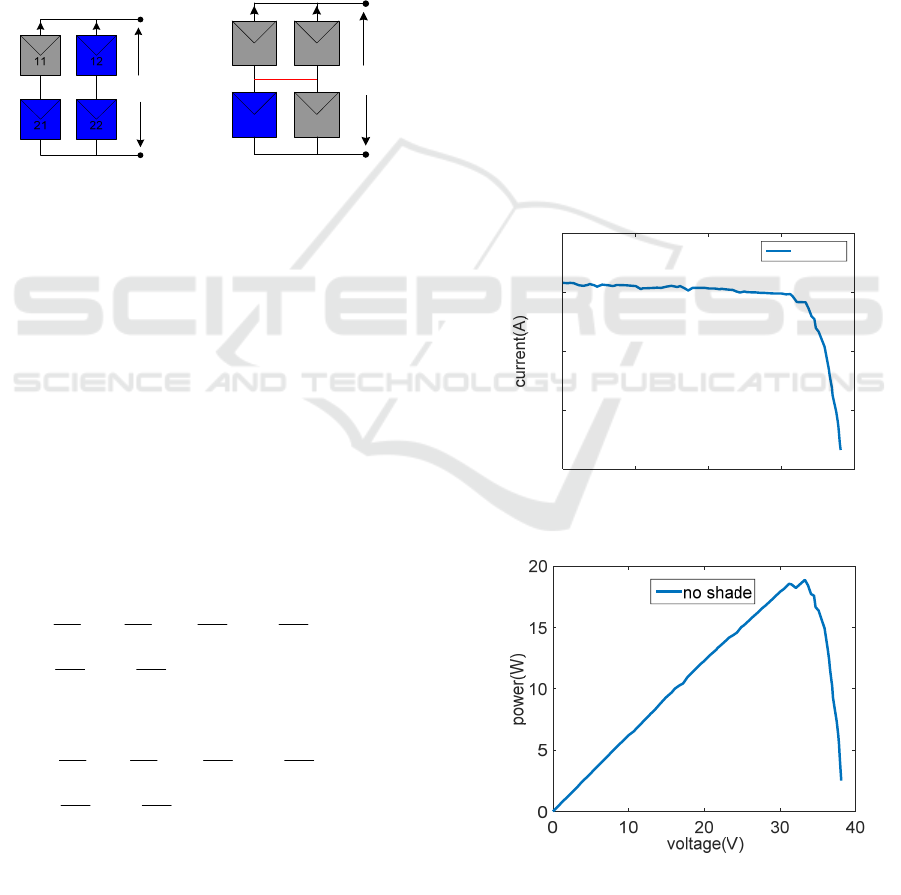
3 PV ARRAY CONFIGURATIONS
AND SHADING ANALYSIS
The technical arrangement of PV modules are shown
primarily in SP to achieve maximum current and
voltage values. But due to climatic challenges TCT
configuration is introduced for performance
investigation under shading cases.
The TCT is modify version of SP configuration
after addition of cross-tied between two parallel
connected strings. The schematic sketch of both
configurations i.e. SP and TCT are shown in Fig. 3
as,
1
I
2
I
1
V
2
V
array
V
12
VV
11
21
12
22
1
I
2
I
1
V
2
V
array
V
12
VV
(a) SP (b) TCT
Figure 3: Schematic diagram of PV array configuration
with shading patterns
Two shadow test cases are taken for performance
analysis such as (i) 3 PV modules- 12, 21, 22 are
shaded (ii) Single PV module-21 shaded. The present
study briefly reflects the impact of these considered
shadow conditions.
In shading case- 1, as the three PV modules at
locations 12,21 and 22 receive the low irradiation as
75W/m
2
and treated as shaded but one PV module at
location 11 receives normal sun irradiation as 266
W/m
2
and treated as non- shaded.
The 2x2 size of SP configuration based PV
system generated current for shadow cases-(a) and
(b) is obtained as,
(a) Current generated for shadow case-(a)
R1 m m m m m
STC STC
R2 m m m
S S 266
I I I I I 0.341I
1000 1000
266 266
I I I 0.532 I
1000 1000
75
SS
(3)
(b) Current generated for shadow case-(b)
R1 m m m m m
STC STC
R2 m m m
SS75
III II0.15I
1000 1000
266 266
I I I 0.532 I
1000 10
75
00
SS
(4)
The theoretical values of the voltage and power of
the PV array such as SP and TCT adjustment can be
similarly tested under similar shading test cases 3 (a)
- (b).
4 RESULTS AND DISCUSSION
The combination of the two configurations as
mentioned above in the PV array is configured. In
this unusual situation, the features of the V and P-V
curve are drawn in the tests. Results are summarized
as:
P-V and I-V curve of SP and TCT PV under
under uniform conditions.
Impact on SP and TCT configuration due to
shading pattern-1
Impact on SP and TCT configuration due to
shading pattern-2
4.1 P-V and I-V Characteristics of SP
and TCT Array at No Shade
The complete PV and IV feature of the SP and TCT
fixed PV under the uniform distribution of light
intensity of 266 W / m2 is from Fig. 4 (a) - (b). It is
evident that the IV and P-V curve is smooth (no
GMPP and LMPP).,
(a) I-V curve
(b) P-curve
Figure 4: Performance characteristics of SP and TCT
configurations under ideal conditions
volta
g
e
(
V
)
0 1020304
0
0
0.2
0.4
0.6
0.
8
no shade
ICACSE 2021 - International Conference on Advanced Computing and Software Engineering
270
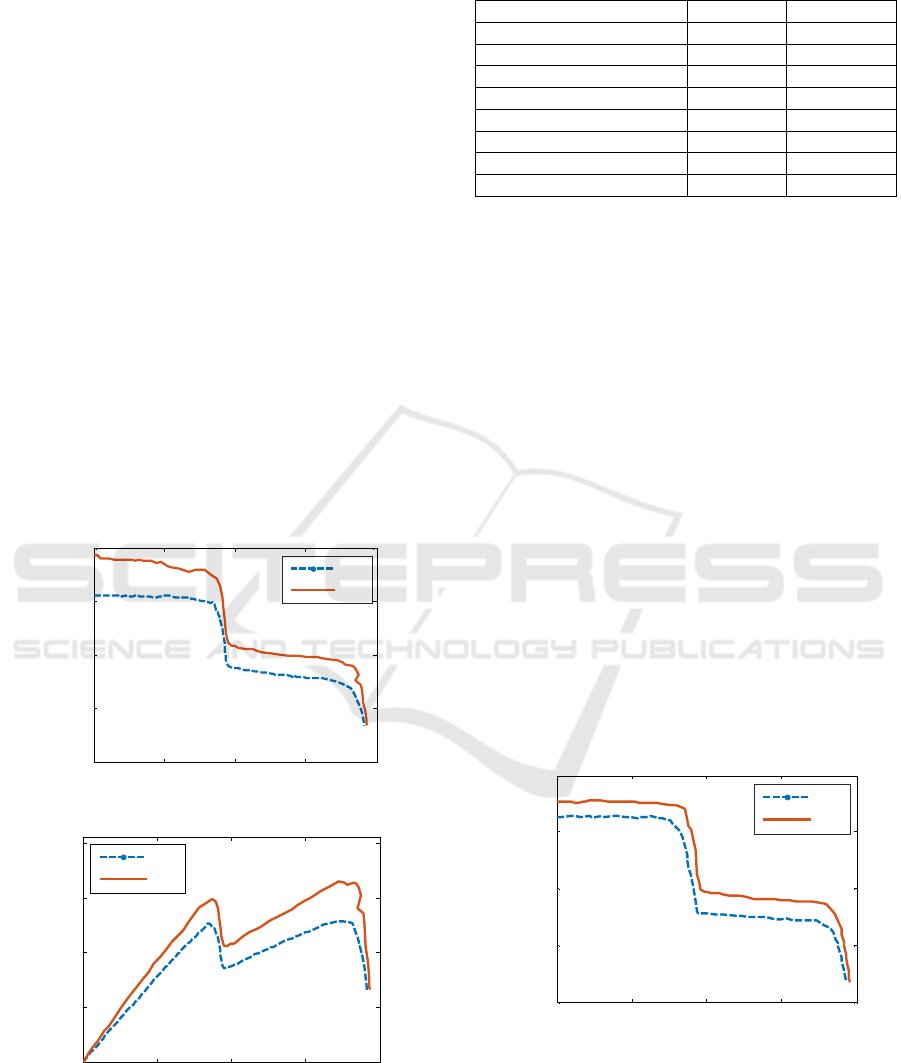
4.2 Effect of Shadow Pattern-1
The condition of PSC’s is, when in PV array one or
more than one panel is under the shadow due to
which it cannot receive the full solar irradiation.
PSCs may be due to the cloudy weather and may be
due to the shadow of tree and buildings over the
panel, PSCs decrease the output efficiency of the
panel and shows dark zone and hike in the graphical
figure of the I-V and P-V curve.
Under this analysis, three panels are shaded and
one panel remains under full solar irradiation. The
shaded panel receives 75W/m
2
and the non-shaded
panel receives 266W/m
2
which create disturbance in
the operating performance of the panels which can
be easily observed in the graphical curve of Fig.6.
Under this case of shading, the V
oc
for SP is 38.3V
and 38.7V for TCT configuration. The I
sc
is 0.31A
and 0.38A for SP and TCT respectively, under this
case the V
m
are 35.2V and 34.6V for SP and TCT
whereas the power at GMPP for SP is 5.13 W and
7.57 W for TCT. The obtained FF for SP is 0.80 and
for TCT it is 0.42, misleading power is 0.10 for SP
and 0.02 for TCT and the PL is 12.14 and 11.31 for
SP and TCT respectively
(a) I-V curve
(b) P-V curve
Figure 5: Performance characteristics of SP and TCT
configurationsunder shading test case- 1
Table 2: Performance parameters of SP and TCT
configurations under shade pattern-1
Parameters SP TCT
O. C. Voltage (V) 38.3 38.7
S.C current (A) 0.31 0.38
Max volta
g
e
(
V
)
35.2 34.6
Max current
(
A
)
0.14 0.18
Power at GMPP
(
W
)
5.13 7.57
Misleading Powe
r
(W) 0.10 0.02
Power loss (W) 12.14 11.31
Fill Facto
r
0.80 0.42
4.3 Effect of Shadow Pattern-2
In this study, three panels remain to normal
irradiation and one panel is shaded, hence the output
of the 2×2 array shows peaks in the graph which
indicate that non- shaded part ofmodulesabsorbe 266
W/m
2
irradiation whereas the shaded panel receives
the 75 W/m
2
as given in Fig. 6. The generated power
decreases and power loss increases due to the shaded
panles.The open-circuit voltage(V
oc
) for SP is found
38.6V and for TCT 39.1V. Moreover, the short
circuit current(I
sc
) is observed as 0.65A and 0.70A
for SP and TCT configurations respectively. The
maximum voltage(V
m
) generated under this case is
found 36.5V for SP and 36V for TCT configurations.
The maximum current(I
m
) for SP observed is 0.27A
and for TCT is 0.34A. The power at GMPP is found
9.89W and 12.46W for SP and TCT configurations.
Improved FF is observed 0.39 for SP and 0.44 for
TCT configurations. In case of misleading power, it
is 0.29W for SP and 0.8W for TCT configurations.
The power loss (PL) is 7.38W for SP and 6.42W for
TCT.
(a) I-V curve
0 10 20 30 40
0
0.1
0.2
0.3
0.4
Voltage (V)
Current (A)
SP
TCT
0 10 20 30 40
0
2
4
6
8
Voltage (W)
Power (W)
SP
TCT
0 10 20 30 40
0
0.2
0.4
0.6
0.8
Voltage (V)
Current (A)
SP
TCT
Shade Dispersion using TCT Configuration of PV Array System under Non-uniform Irradiation: Experimental Study
271
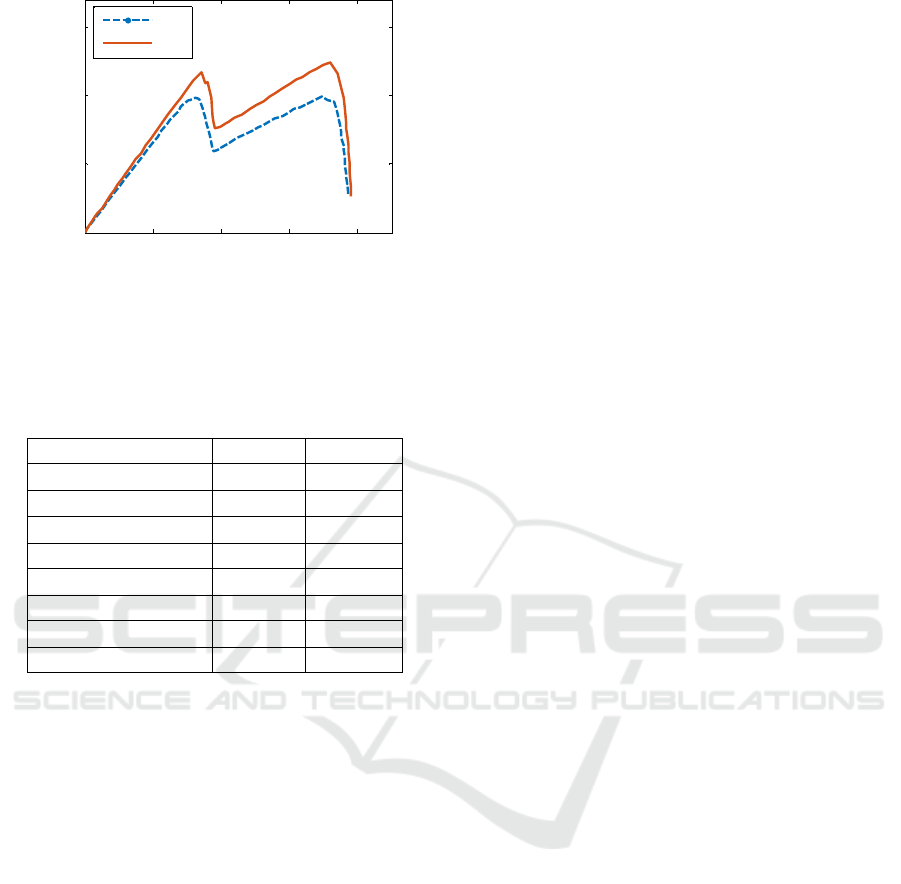
(b) P-V curve
Figure 6: Performance characteristic of SP and TCT
configuration undershading test case-2
Table 3: Performance parameters of SP and TCT
configurations under shade pattern-2
Parameters SP TCT
O. C. voltage (V) 38.6 39.1
S.C current (A) 0.65 0.70
Max voltage (V) 36.5 36
Max current (A) 0.27 0.34
Power at GMPP(W) 9.89 12.46
Misleading Power(W) 0.29 0.8
Power loss 7.38 6.42
Fill Factor(W) 0.39 0.44
5 CONCLUSIONS
Under this experimental study, a comprehensive
assessment of the PSC impact was presented on the
PV modules compiled by SP and TCT. Extended
experiments were completed using transparent part-
dimensional shading patterns, one shading-1 single-
panel case with a transparent and shaded case-2
three-dimensional panels and one panel are not black.
The results obtained indicate that the blurring in part
greatly affects the display of PV modules under
experimental studies.
With the above mentioned partial shading
condition, TCT designed PV module supposedly
has ideal execution over the SP arrangement.
The decreases in power are seen in SP and TCT
configured PV modules but TCT has better
execution when contrasted with SP setup.
The decreases in power for SP and TCT arranged
PV module are accounted for to be 7.38Wand
6.42W (shading pattern-1); 12.14W and 11.31W
(shading method-II) respectively.
The determined FF factor for SP and TCT
configurations under shading pattern-1 are found
to be as 0.39 and 0.44 respectively. Overall, TCT
has best performance.
On the basis of above discussion, it is found that
TCT arrangement is better than SP arrangement
of panels under above discussed shading effects-
1 and 2.
REFERENCES
Bai, J., Cao, Y., Hao, Y., Zhang, Z., Liu, S., and Cao, F.
(2015). Feature discharge of PV systems under partial
shading conditions or different conditions. Solar
Energy, 112, 41-54.
Bana S., and Signature, R. P. (2017). An exploration study
of the power output of various photovoltaic
adjustments under the same conditions and temporary
blurring. Power, 127, 438-453.
Koray, K. S. (2014). FPGA is based on the new MPPT
process for the PV system for members working in
shady conditions. Power, 68, 399-410.
Lamri, B., Abderrezak, A., Razem, H., and Kahoul, N.
(2018). Shading and Diode Fault Effects on PV Array
Performance. Trans. Electr. Electron. Mater., 19(2),
75-83.
Malathy, S. and Ramaprabha, R. (2015). Complete analysis
of the role of the size of the same members and
configuration of the power output of photovoltaic
systems under shady conditions. Renewable Energy
and Sustainability. 49, 672-679.
Rani, B. I., Ilango, G. S., and Nagamani, C. (2013).
Enhanced power generation from the same PV
components under certain shading conditions by the
distribution of shade using the suspension of Su Do Ku.
IEEE Transactions on Sustainable Energy. 4(3), 594-
601.
Samkannu, S. M., Namani, R., and Subramaniam, S. K.
(2016). Power enhancement of PV partially applied by
shadow dispersion using a magic square suspension. J.
Renew. Support. Power, 8(6).
Satpathy, P. R., Sharma, R., and Jena, S. (2017). Shade
connector distribution scheme for slightly shaded
modules on a solar PV network. Power, 139, 350-365.
Vijayalekshmy, S., Bindu, G. R., and Iyer, S. R. (2015a).
Performance of Blur Photovoltaic Photo Editing
Program under Moving Shadow Conditions using
shadow dispersion. J. Inst. Eng. Ser. B, 1-7.
Vijayalekshmy, S., Bindu, G. R., and Iyer, S. R. (2015b).
Systematic analysis of various photovoltaic
components under shadow dispersion by Su-Do-Ku
planning during cloud transit. India J. Sci. Technol., 8
(35), 1-7.
Vijayalekshmy, S., Iyer, S. R., and Beevi, B. (2014).
Comparative performance analysis of the Series-
Connected and Parallel-Connected Photovoltaic Array
Under Shading Partial Series. J. Inst. Eng. India Ser. B,
96 (3), 217-226.
0 10 20 30 40
0
5
10
15
Voltage (V)
Power (W)
SP
TCT
ICACSE 2021 - International Conference on Advanced Computing and Software Engineering
272
