
Performance of Grid Connected Hybrid System with Maximum
Power Optimization Algorithms
Vinaya Rana
1
, Yogesh K. Chauhan
2
and M. A. Ansari
1
1
Electrical Engineering Department, Gautam Buddha University, Greater Noida-201312, India
2
Electrical Engineering Department, Kamla Nehru Institute of Technology, Sultanpur-228118, India
Keywords: Renewable Energy, Photovoltaic System, Wind Energy Conversion System, P&O, ANN, Grid Integration,
Hybrid Energy System.
Abstract: Energy is an essential part of our lives and is used in various fields such as agricultural land, transportation,
domestic and industrial applications. Further, the renewable energy (RE) sources are becoming more popular
now a days due to limited fossil fuel and more eco-friendly. Two RE sources i.e. Solar PV and Wind energy
conversion system are considered in this paper to fulfill the energy demand. The conversion efficiency of PV
and wind power systems is very low due to different weather conditions. Therefore, maximum power
extraction schemes are implemented to extract maximum power during different weather conditions. Two
different maximum power schemes i.e. P&O for solar PV system and ANN for Wind energy have been
accomplished to find maximum power from these resources. Each component of system is modeled in
MTLAB/Simulink and hybrid system is developed by integrating individual model. A 15 kW PV and 15 kW
WECS is designed for grid integration. Extensive results are taken and different operating conditions, which
validate the developed hybrid model.
1 INTRODUCTION
Non-conventional energy sources are now more
popular due to limited fossil fuels and more
environmentally friendly. The RE sources produce
energy from natural sources that replace themselves
again in a short span of time (Edenhofer et al., 2011).
These sources incorporate solar, wind, small hydro,
biogas, tidal energy, geothermal etc. The RE sources
are freely available, pollution free, inexhaustibility
are the main advantages and can be used for
electricity generation as well as other applications
such as air and water heating (Yazdani-Chamzini et
al., 2013; Rana, Ansari and Chauhan, 2020). The RE
sources are unpredictable in nature such as solar PV
provides energy during sunlight, and the wind energy
is also unpredictable which depends on the flow of
air, so the RE sources are not active every time. The
performance of the RE sources are affected by several
environmental conditions. The total energy generated
from renewable energy sources (RES) is 91153.81
MW i.e. 24.28% of the total installed energy as on 31
December 2020 (CEA, 2020).
Solar energy is the most emerging RE source
because of its various advantage such as pollution
free, low maintenance, long lifespan, low cost etc., so
this source is very reliable and congenial to use.
Semiconductor materials are used to convert sunlight
into electricity for solar PV cells (Rana, Chauhan and
Ansari, 2016; Breyer et al., 2018). The efficiency of
solar cells is very low, because of environmental
conditions such as shading, clouding, dust
accumulation effects etc. For maximum efficiency
and power, different maximum power extraction
algorithms methods are used. Perturb and observe
(P&O) algorithm is used to find the maximum energy
during variable irradiance.
Wind power is the oldest RE source for the use of
grinding grains and steer ship. Now a days, wind
energy is used to produce electricity generation with
various generator technology. As the wind speed
changes, the output power also changes accordingly
(Chinmaya and Singh, 2018; Saini, Ansari and Rana,
2019). For maximum power, wind turbine parameters
such as blade pitch and tip speed ration are changed.
Wind energy technology has experienced significant
growth and progress over the past few decades.
Today, wind energy is found as an increasing RE
source. Wind energy can be used for various purposes
260
Rana, V., Chauhan, Y. and Ansari, M.
Performance of Grid Connected Hybrid System with Maximum Power Optimization Algorithms.
DOI: 10.5220/0010567700003161
In Proceedings of the 3rd International Conference on Advanced Computing and Software Engineering (ICACSE 2021), pages 260-266
ISBN: 978-989-758-544-9
Copyright
c
2022 by SCITEPRESS – Science and Technology Publications, Lda. All rights reserved
such as transportation in river and sea, grinding of
grain and electricity generation (Breyer et al., 2017).
For a hybrid power system, two or more power
sources are connected together. The hybrid power
system is highly efficient and more reliable than the
conventional energy sources (Kumar et al., 2018).
The hybrid power system is suitable for remote areas
due to various benefits such as constant power flow,
more durable etc. Hybrid power system is more
popular due to the continuous power flow between
load and source. The gird integration system is more
popular now a days due to various advantages such as
24 hours electricity, high reliability and increased
reserve plant capacity, but it is very challenging task
for the researcher to integrate the RE source with grid
due to the intermittent power of RE based sources
(Rehmani et al., 2018). The integration can be
possible in two different ways i.e. transmission level
integration for large power and distribution level
integration for small power generation.
In this paper, the performance of hybrid energy
sources (PV and Wind) are analyzed with the help of
maximum power extraction schemes i.e. P&O for
solar PV system and ANN for WECS. With the help
of a voltage source inverter, the generated energy of
the hybrid power system is fed to the grid.
This paper is mainly distributed in five sections. In
section I, introduction of RES is covered. In second
section, System description is described. In section-
three, the modeling of the proposed hybrid system is
discussed. In Section IV, the results of the hybrid (PV
and WECS) system are discussed. The conclusion of
the hybrid energy system is discussed at the end of
this paper.
2 SYSTEM DETAILS
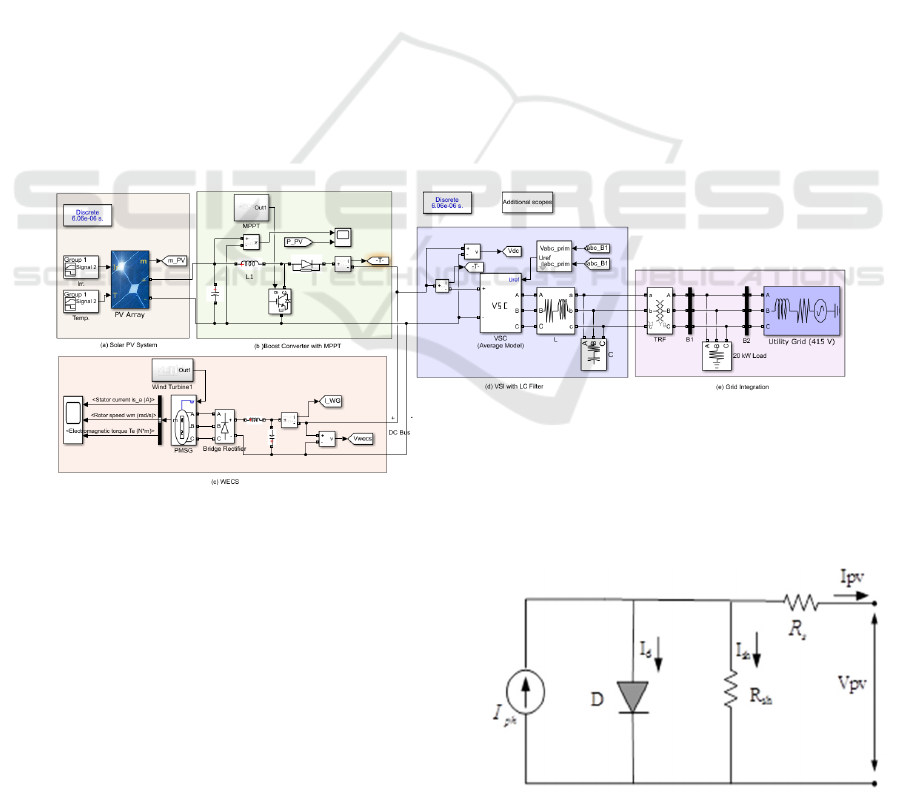
The Simulink diagram of grid connected solar PV and
WECS is shown in Fig. 1. A common 200 V DC bus
is made to connect the hybrid RE system. In the case
of PV system, a dc voltage is generated through PV
panel and then increased through boost converter. In
case of WECS, three phase voltage is converted into
DC voltage through a bridge rectifier to make a
common dc bus as shown in Fig. 1. The dc voltage is
converted into ac voltage (three phase) with the help
of VSI and the connected to the Grid through
transformer.
Figure 1: Simulink Diagram of Grid Connected PV and WECS
3 SYSTEM MODELLING
3.1 Modeling of Solar PV System
The series and parallel combination of the PV cells is
used to make the PV system to produce specified
output power (El-Khattam and Salama, 2004; Rana,
Ansari and Chauhan, 2019). The circuit diagram of
PV cell is described in Fig. 2.
Figure 2: Equivalent circuit of a PV cell
Performance of Grid Connected Hybrid System with Maximum Power Optimization Algorithms
261
The voltage and current of the photovoltaic system
are shown in (1-3),
𝐼
𝐼
𝐼
𝐼
(1)
𝐼
𝐼
𝐼
𝑒𝑥𝑝
1
(2)
𝑉
𝑅
𝐼
(3)
TheV
oc
and I
sc
of the PV cell are described in (4) and
(5) as,
𝑉
𝑙𝑛
4
𝐼
𝐼
𝐼
𝑒𝑥𝑝
1
5
Where,T
c
is PV cell temp. (K), qcharge of electrons
(1.602x10⁻¹⁹ C),I
d
is diode current (A),I
ph
is photo
current (A), I
sc
is short circuit current, I
o
is diode
reverse saturation current (A), k is Boltzman constant
(1.38
10-23 J/K),V
oc
is open circuit voltage (V)
andAis ideality factor (1.1).
The fill factor and efficiency of panel is shown in (6)
and (7) as,
𝐹𝑖𝑙𝑙𝑓𝑎𝑐𝑡𝑜𝑟
∗
∗
6
𝐸𝑓𝑓𝑖𝑐𝑖𝑒𝑛𝑐𝑦
∗
∗
7
Where, P
in
ispower input to the PVpanel i.e. P
in
=
solar cell area*Irr.
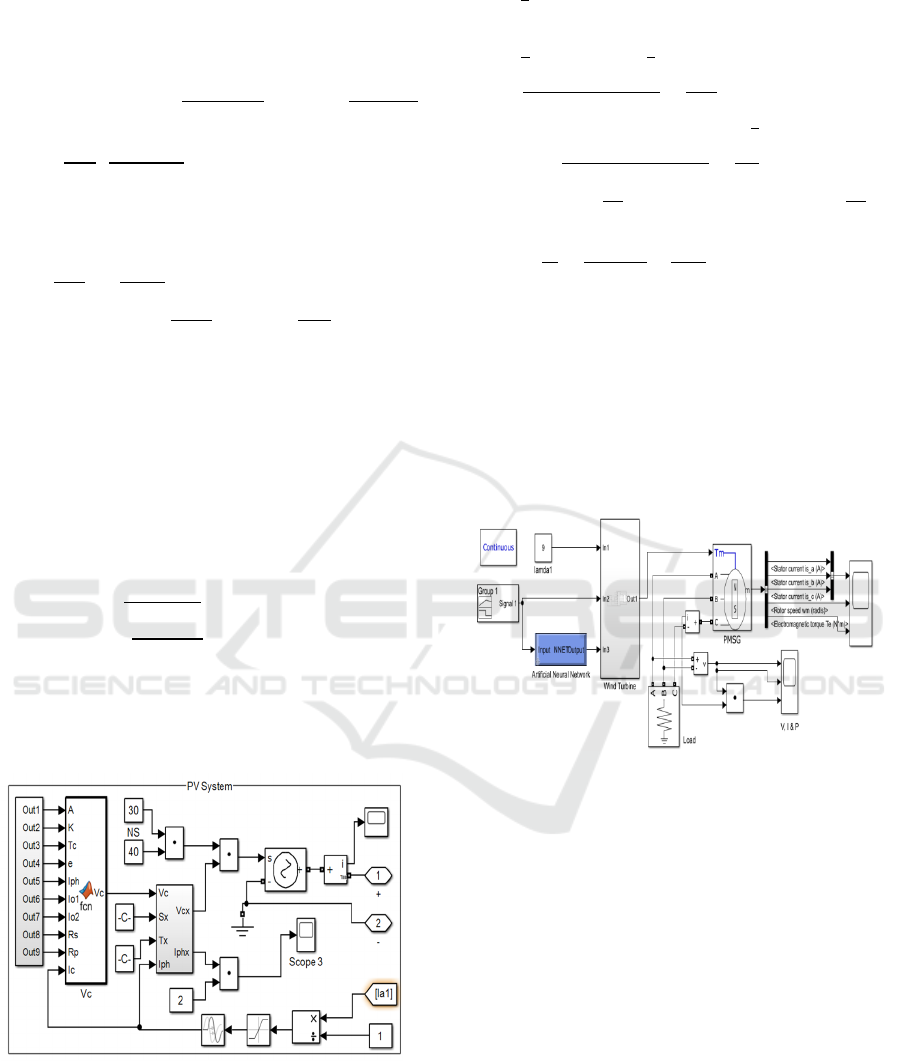
In Fig.3, modeling of the solar PV system based on
the above equation is described.
Figure 3: PV Cell Modeling Details
3.2 Modeling of WECS
The mathematical modeling of a WT (Mahdi et al.,
2010; Ben Ali, Schulte and Mami, 2017) is described
in (8) to (14) as:
P
air mass per unit time
∗ Wind velocity
8
P
ρAv
∗v
ρAv
9
C
10
P
C
λ,β
∗P
C
λ,β
∗
ρAv
11
TSR
λ
.
12
C
λ,β
M
M
.βM
β
M
e
13
Where,
.
.
14
Where: P
w
is the output power (W), A is the area of
rotor (m
2
), ρ is the air density (1.224 Kg/m
3
at 15
oC
and normal pressure), v is wind velocity (m/s), ω is
the rotor speed, λ is the tip speed ratio, R is radius of
rotor, β is the blade pitch angle and M
1
to M
6
are the
coefficients and the values of these coefficients are
constant. The Simulink model of WECS based on
ANN is shown in Fig. 4 as below:
Figure 4: ANN based Simulation Model of WECS
An ANN control scheme is used to control tip speed
ratio and pitch angle of wind turbine. The error
between reference torque and actual torque is
minimized very fast by using ANN based control
algorithm. The training of ANN is based on the wind
speed variation. The difference between calculated
output and the desired output is minimized through
the delta learning rule(Asghar and Liu, 2018). The
different steps are used to train the ANN algorithm as:
Step I: First initialize the weight.
Step II: Optimize the hidden layer
Step III: Compute the output.
Step IV: Calculate the error.
Step V: Wight updated and calculate the output by
using (15).
Step VI: Go to step II and iterate this calculation till
the error between output and desired output is
minimum.
ICACSE 2021 - International Conference on Advanced Computing and Software Engineering
262
The mathematical modeling of ANN system is shown
in (15).
𝑂
∑
𝑤
𝑥
𝜃
𝑎𝑛𝑑𝑂
∑
𝑤
𝑂
𝜃
15
Where,𝜃
and 𝜃
are the bias value ofhidden layer
and output layer, Wpq, and Wq(r+1) are the hidden
layers weights, 𝑥
and 𝑂
are input and output of the
hidden layer.
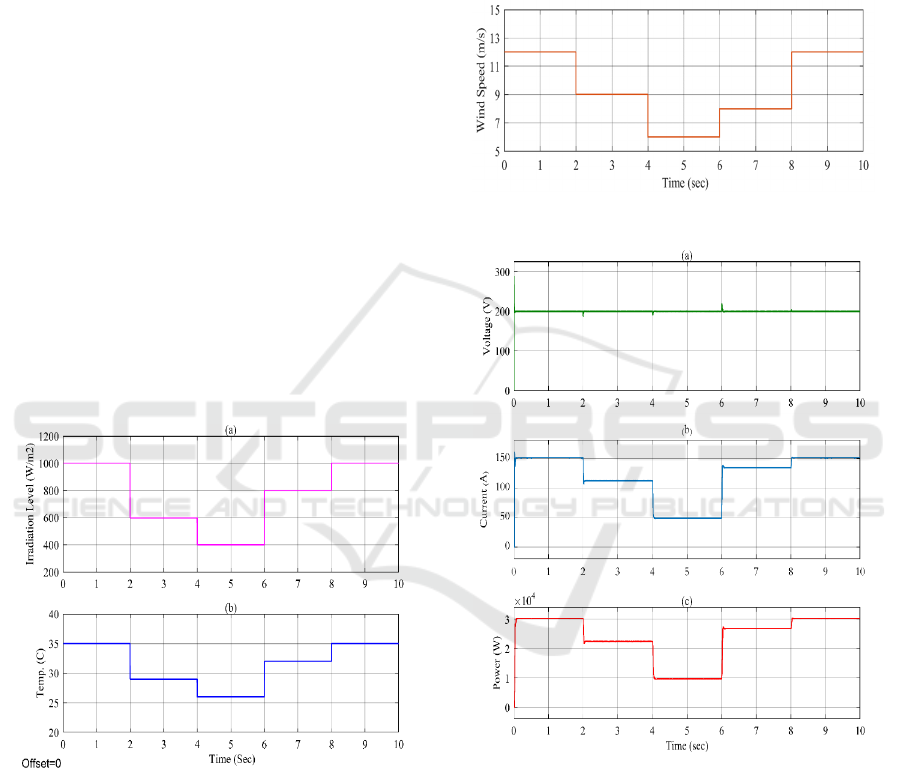
4 RESULTS AND DISCUSSION
As the temperature of the panel increases, the PV
panel output decreases and vice-versa. In case-1 (0-2
sec), the irradiation level and temperature are 1000
W/m
2
and 35
o
C respectively. Case-2 (2-4 sec), both
the irradiation level and temp both are reduced and
reached to 600 W/m
2
and 29
o
C.The irradiation level
and temperature in case-3 (4-6 sec), decreases again
upto 400 W/m2 and 26
o
C respectively. In case-4 (6-8
sec), the irradiation level and temp increases to 800
W/m
2
and 32
o
C. In case-5 (8-10 sec), the irradiation
level and temp of the panel is 1000 W/m
2
and 35
o
C
respectively. The variation of irradiation level and
temperature of the PV panel is shown in Fig. 5.
Figure 5: Irradiation Level and Temperature Variation over
PV Panel
A 15 kW WECS is considered for hybrid energy
system. Different wind speeds are considered for
analysis because the wind speed is variable in nature.
Five different cases are considered for variable wind
speed i.e. case-1 (0-2 sec) - wind speed is 12m/s; case-
2 (2-4 sec) - wind speed is 9 m/s; case-3 (4-6 sec) -
wind speed is 6 m/s; case-4 (6-8 sec) - wind speed is
8 m/s and wind speed is 12m/s in case-5 (8-10 sec) is
shown in Fig. 6.
The voltage, current and power of the grid
connected hybrid system at the inverter terminal are
shown in Fig. 7. The inverter voltage is 200 V which
is constant. The inverter voltage is controlled by a
DC.As the wind speed and irradiation level changes,
the output current of the inverter also changes.The
power output of hybrid system also varies
accordingly.
Figure 6: Variation of Wind Speed for WECS
Figure 7: V, I & P of Grid Connected Hybrid (PV and
WECS) System
In case-1 (0-2 sec), when the solar irradiation and
wind speed is 1000 W/m
2
and 12 m/s respectively,
then V, I and P are 200V, 151.20 A and 30.24 kW
respectively. In case-2 (2-4 sec), V, I and P are 200
V, 112.50 A and 22.50 kW respectively, when then
irradiation level and wind speed decreases. The
output voltage, current and power at the inverter
terminals are 200 V, 48.6 A and 9.71 kW respectively
in case-3 (4-6 sec). When the wind speed and
irradiation levelincreases in case-4 (6-8 sec), the
Performance of Grid Connected Hybrid System with Maximum Power Optimization Algorithms
263
voltage, current and power across the inverter
terminals are 200 V, 134.2 A and 26.84 kW
respectively. In case-5 (8-10 sec), When the wind
speed and irradiation level again reach to 12 m/s and
1000 W/m
2
, then V, I and P at the inverter terminals
are 200 V, 151.2 A and 30.24 kW respectively.
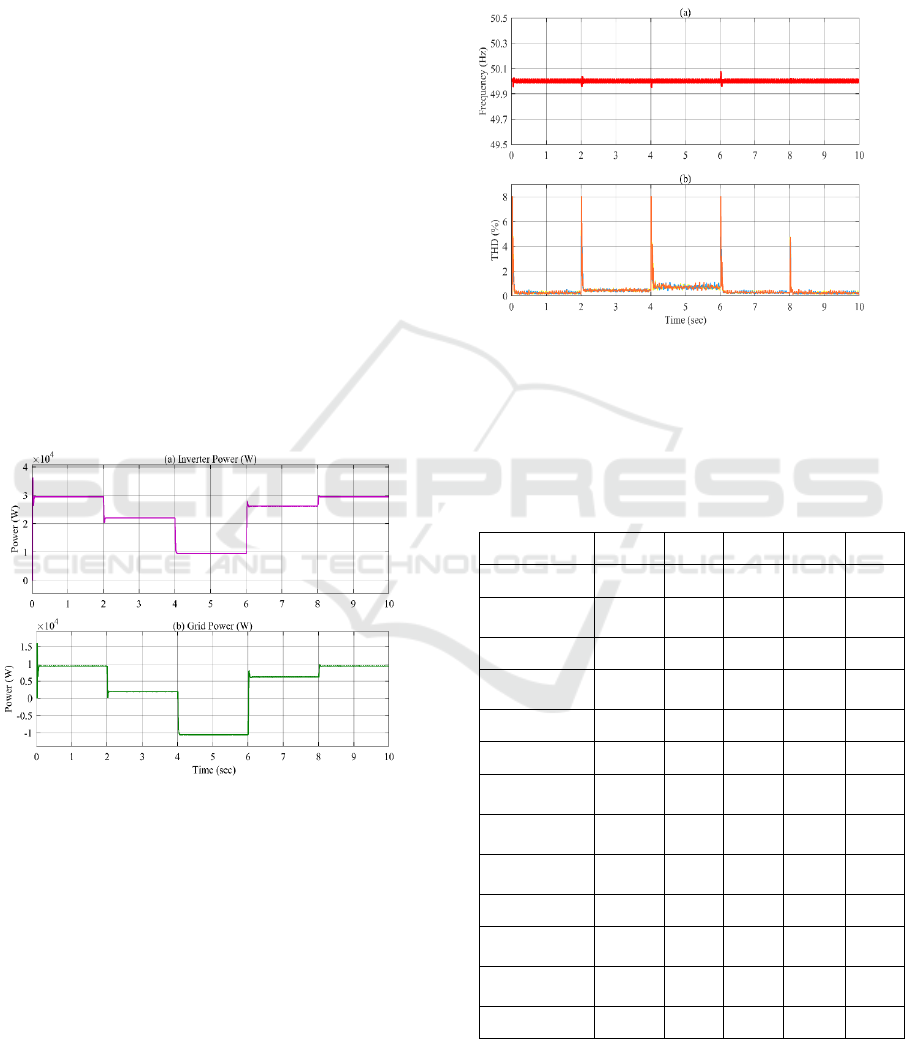
The power flow between inverter and grid are
shown in Fig. 8. For hybrid energy system, 20-kW
fixed load is considered. In case-1, the power at the
inverter bus is 29.40 kW out of which 20 kW power
is consumed by the load and the remaining 9.40 kW
power is transferred to grid. The inverter bus power
is 21.94 kW in case-2, when both irradiation level and
speed are decreased. A 20-kW power is consumed by
the load and remaining 1.94 kW power is transferred
to grid. In case-3, the total power at the inverter is
9.48 kW. To fulfil the load demand, 10.52 kW power
is taken from the grid. When the irradiation level and
wind speed increase, the inverter power becomes
26.20 kW out of which 20 kW is supplied to the load
and remaining 6.20 kW is fed to the grid in case-4. In
case-5, the total power transferred to the inverter bus
is 29.40 kW. Out of which 20 kW power is supplied
to the load and remaining 9.40 kW power is fed to the
grid.
Figure 8: Inverter bus and Grid bus Power
The frequency variation of grid connected energy
system is between 50.04 to 49.96 Hz which is very
much useful for grid integration as per IEEE
standards (IEEE P 1159.1). The frequency and THD
variation with respect to irradiation level and wind
speed for grid connected hybrid energy system are
shown in Fig. 9. The THD of the hybrid system is also
with in the permissible limit as per IEEE standards
(IEEE 519) for integration. The THD is 0.4% in case-
1. In case-2, the THD of the grid connected hybrid
system is 0.6%, when the speed and irradiation both
are decreases. The THD is 0.9% in case-3, when
wind speed and the irradiation level both are
increased. The THD is 0.5 and 0.4 in case-4 and case-
5 respectively. The frequency and THD of the
proposed RE based hybrid system change due to
modulation index changes to make the constant
output voltage of VSI.
Figure 9: Frequency and THD of Grid Connected Hybrid
Energy System
The comparative investigation hybrid energy system
for grid integration is summarized in Table 1.
Table 1: Comparative Analysis of Grid Connected hybrid
PV and WECS
Cases 1 2 3 4 5
Time (Sec) 0-2 2-4 4-6 6-8 8-10
Irradiation
(W/m
2
)
1000 600 400 800 1000
Temp. (
o
C) 35 29 26 32 35
Wind
Speed(m/s)
12 9 6 8 12
Voltage (V) 200 200 200 200 200
Current (A) 151.20 112.50 48.6 134.20 151.20
Power-PV
(kW)
15.50 9.52 6.40 12.67 15.51
Power-WECS
(kW)
14.80 12.96 3.37 14.24 14.80
Generated
Power (kW)
29.40 21.94 9.48 26.20 29.40
Load (kW) 20 20 20 20 20
Power to Grid
(kW)
+9.40 +1.94 -10.52 +6.15 +9.40
Frequency
(Hz.)
50 50 50 50 50
THD (%) 0.4 0.6 0.9 0.5 0.4
The different cases are considered to analyses the
hybrid system with variable irradiation level and wind
speeds.
ICACSE 2021 - International Conference on Advanced Computing and Software Engineering
264

5 CONCLUSION
In this paper, A 30-kW hybrid renewable energy
sources have been designed and implemented in
Matlab/Simulink. ANN and P&O based maximum
power extraction schemes have been implemented to
extractmaximum power during variable
environmental conditions.In RE based hybrid system,
the PV and WECS both are connected together with
grid integration. A30-kW power is generated by the
hybrid energy system and 20-kW load is considered
to analyse the behavior of the generation system. The
total power generated from the hybrid system is 30
kW when the system is operating at irradiation of
1000 W/m2 and 12 m/s wind speed. The hybrid
system generates 9.48 kW when the irradiation is 400
W/m2 and wind speed is 6 m/s. The frequency of
hybrid energy system is same as the grid frequency
i.e. 50 Hz with 0.9 % THD.The advantage of the
proposed system is that the storage system is not
required and the maintenance cost of the proposed
hybrid system is very low, as it does not require any
storage system.
REFERENCES
Asghar, A. B. and Liu, X. (2018). Adaptive neuro-fuzzy
algorithm to estimate effective wind speed and optimal
rotor speed for variable-speed wind turbine.
Neurocomputing, 272, 495–504.
Ben A. R., Schulte, H. and Mami, A. (2017). Modeling and
simulation of a small wind turbine system based on
PMSG generator. Evolving and Adaptive Intelligent
Systems (EAIS).
Breyer, C. et al. (2017). On the role of solar photovoltaics
in global energy transition scenarios. Progress in
Photovoltaics: Research and Applic., 25(8), 727–745.
Breyer, C. et al. (2018). Solar photovoltaics demand for the
global energy transition in the power sector. Progress in
Photovoltaics: Research and Applic., 26(8), 505–523.
CEA Report (2020). Government of India Ministry of
Power Executive Summary on Power Sector.
Chinmaya, K. A. A., and Singh, G. K. (2018). Performance
evaluation of multiphase induction generator in stand-
alone and grid-connected wind energy conversion
system. IET Renewable Power Generation. Institution
of Engineering and Technology, 12(7), 823–831.
Edenhofer, O. et al. (2011). Renewable Energy Sources and
Climate Change Mitigation, Renewable Energy
Sources and Climate Change Mitigation. Cambridge:
Cambridge University Press.
El-Khattam, W. and Salama, M. M. A. (2004) Distributed
generation technologies, definitions and benefits.
Electric Power Systems Research. Elsevier, 71(2), 119–
128.
Kumar, K. et al. (2018). An Efficient Technique for Power
Management in Hybrid Solar PV and Fuel Cell System.
Smart Science. Taylor and Francis Ltd., 6(3), 1–11.
Mahdi, A. J. et al. (2010). A Comparative Study on
Variable-Speed Operations of a Wind Generation
System using Vector Control. Renewable Energy and
Power Quality Journal, 1(08), 605–610.
Rana, V., Ansari, M. A. and Chauhan, Y. K. (2020).
Investigation of partial shading effect on PV array
configuration. International Journal of Digital Signals
and Smart Systems. Inderscience Publishers, 4(1/2/3),
184.
Rana, V., Ansari, M. A., and Chauhan, Y. K. (2019). The
Mathematical Modeling and Experimental Analysis of
Solar PV with Cooling Systems. Indian Journal of
Industrial and Applied Mathematics. Diva Enterprises
Private Limited, 10(2), 152.
Rana, V., Chauhan, Y. K. and Ansari, M. A. (2016). A
multilevel inverter fed induction motor driven water
pumping system based on solar photovoltaic. in India
International Conference on Power Electronics, IICPE.
IEEE Computer Society, 1–6.
Rehmani, M. H. et al. (2018). Integrating Renewable
Energy Resources into the Smart Grid: Recent
Developments in Information and Communication
Technologies. IEEE Transactions on Industrial
Informatics. IEEE Computer Society, 14(7), 2814–
2825.
Saini, B., Ansari, M. A. and Rana, V. (2019). Design of
Micro-grid Using Hybrid Energy Source for Remote
Location Application. in 2019 2nd International
Conference on Power Energy Environment and
Intelligent Control, PEEIC, 2019, 556–560.
Yazdani-Chamzini, A. et al. (2013). Selecting The Optimal
Renewable Energy Using Multi Criteria Decision
Making. Journal of Business Economics and
Management, 14(5), 957–978.
APENDIX
Table-2: System Details of 15 kW Grid connected PV panel
Components Specifications
PV array output 15 kW
P
m
250 W
V
oc
37.32 V
I
sc
8.66 Amp.
V
mp
30.71 V
I
mp
8.15 Am
p
.
R
sh
224.18 Ω
R
s
0.237 Ω
No of series connected
p
anel
(
Ns
)
5
No of parallel connected
p
anel (Np)
13
Grid Voltage and
Frequenc
y
415 50 Hz
Performance of Grid Connected Hybrid System with Maximum Power Optimization Algorithms
265

Table-3: Parameters of Wind turbine and PMSG
WT Operating
Parameters
Specifications
No. of blades Three
Radius of Blades 4.5 Mete
r
Gear ratio of turbine 40
β
Variable Pitch
ρ
1.2 k
g
/m
3
V
w
10-18 m/s
λ
9
C
p
0.45
M1, M2, M3, M4, M5,
M6
0.5176, 116, .4, 5,
21, .0068
PMSG Operating
Parameters
Specifications
Rs 0.4250 Ω
Ld, L
q
0.0086, 0.0086 H
Jg 0.00146 Kg.m
2
FF 0.0003036 N.m.s.
Poles 2
T -17 N
m
Rated volta
g
e & current 1140 V, 7.15 A
ICACSE 2021 - International Conference on Advanced Computing and Software Engineering
266
