
A State of Charge and Parameter Estimation of Li-Ion Polymer
Battery: Current State
Dhananjai Singh
1
, Yogesh K. Chauhan
1
, Vimlesh Verma
2
1
Electrical Engineering Department, Kamla Nehru Institute of Technology, Sultanpur, U.P., India
2
Electrical Engineering DepartmentNational Institute of Technology, Patna, Bihar, India
Keywords: Battery, Battery model, Electrolyte, Kalman Filter, Li-Ion Polymer battery, Observer technique, Parameter
identification, State of Charge (SoC), SoC estimation, Validating cycle
Abstract: This paper presents an extensive study on issues related to the development of a recently researched Li-Ion
Polymer (LiPO) battery. The vast area of research on LiPOsuch as state of charge (SoC) estimation,
electrolyte, an equivalent circuit which includes electrical & thermal modelling, parameter identificationand
validation cycles have extensively reviewed and discussed. Moreover, the parameter identification methods
of the battery are also elaborated in detail. A novel attempt is made to prepare and compare the various SoC
estimation techniques, stating its advantages and disadvantages. The error in the SoC estimation technique
is greatly dependent on the battery model considered. Various electrical models are discussed that can
replicate the battery’s electrical performance. The complexity of the model increases as the number of
performance parametersare included in the model. The estimation is incomplete if the technique is not
validated and hence various validation cycles are discussed to validate the effectiveness of SoC estimation.
1 INTRODUCTION
Nowadays battery plays a very crucial role in several
engineering applications due to numerous energy
and environment concerns. The research on various
aspects of battery picked up during the nineties after
compulsion of environmental issues. Lithium based
rechargeable batteries are very suitable power
sources for several evolving applications.In Li-ion
battery, Lithium-ion intercalated compound or either
graphite or disordered form of carbon is used as
electrodes. The battery reaction is as follows:
Li
+
+C
6
+ e
-
C
6
Li : negative electrode reaction
LiMO
2
MO
2
+ Li
+
+ e
-
: positive electrode reaction
Compared to its counterpart nickel metal hydride
and nickel-cadmium batteries, Lithium batteries
have high energy and power density,high voltage in
a unit cell and high specific energy with long cycle
life. Cutting edge competition between the two
battery technology has led enormous development of
Li-ion battery as compared to NiMH
2
batteries and
is was well predicted that the two batteries had an
almost equal number of sales during 2004 which
was initially dominated by NiMH
2
battery
(Blomgren, 2000). The secret of success lies within
the progress of electrolytes which was very
paramount after initial liquid electrolyte, progressed
to solid electrolyte and thento polymer electrolyte.
Table 1 shows the comparative analysis between
solid, liquid and hybrid electrolyte. Sanyo, a
manufacturer of Li-ion battery, showed that there
was a 50% increase in the energy content of a Li-ion
battery from 1994 to 1999. The challenge to the
liquid electrolyte of Li-ion rechargeable batteries, as
mentioned in Table 1, was eradicated by the use of
the gel-based polymer. But they faced compatibility
issue with lithium metal anode and had problems
with leak proof packaging (Gozdz et al., 1995). The
need to have thin batteries with flexible
manufacturing and battery surface design forced to
develop Li-Ion Polymer (LiPO) batteries that
completely had solid electrolyte. The use of polymer
PEO (Polyethene oxide) was common due tothe low
conductivity of 10
-6
to 10
-7
S/cm due to crystallinity
(Venkatasetty and Jeong, 2002). To achieve high
conductivity lithium imide salts were developed.
Numerous co-polymers have been created that can
deal with the problem of crystallinity. The stability
of these salts results ina maximum voltage of 4.5V.
Salts such as CF
3
SO
2
NLiSO
2
C
2
F
5
and
CF
3
SO
2
NLiSO
2
C
4
F
9
showed higher conductivity
and optimized the blending condition with polymer
Singh, D., Chauhan, Y. and Verma, V.
A State of Charge and Parameter Estimation of Li-Ion Polymer Battery: Current State.
DOI: 10.5220/0010567600003161
In Proceedings of the 3rd International Conference on Advanced Computing and Software Engineering (ICACSE 2021), pages 243-259
ISBN: 978-989-758-544-9
Copyright
c
2022 by SCITEPRESS – Science and Technology Publications, Lda. All rights reserved
243

electrolyte. To increase the conductivity of polymer,
nano filters such as BaTiO
3
is added in the
electrolyte, which also reduces the corrosion and
growth of dendrites in electrode due to less reactive
nature towards alkali metal.LiPO batteries though
provided a solution but Solid Polymer Electrolyte
(SPE) lacks the ionic conductivity due to low
segmental mobility of polymer chain. Various
development has been made in the types of polymer.
Electrolytes such as 1-MLiPF
6
-EC/PC has been
developed with conductivity more than 10
-3
S/m and
strength upto 90-100°C. A polymer such as
BaTiO
3
less reactive to alkali metal and Formation of
dendrites is less. Few environmental friendly
polymers have been developed. This paper is an
attempt to discuss various issues related to LiPO
batteries such as SoC estimation, electrolyte, an
equivalent circuit which includes electrical &
thermal modelling, parameter identification and
validation cycles. The contribution has been made to
identify the advantages and disadvantages of various
SoC estimation techniques. All the estimation
techniques available for LiPO battery are briefly
discussed. Further efforts were made towards the
selection of battery model and techniques to identify
the battery parameter.
Table 1: Comparison of various electrolytes in Li-based
batteries
Electrolyte Advantage Disadvantage
Liquid - High
conductivity
- Developed
technology
- Leakage of electrolyte
- costly separator
- oxidation of electrolyte
- no flexibility in design
- Inefficient space
utilization
Solid - No leakage
of electrolyte
- simple
polymer
processing
methods
-Flexibility in
design
- Low conductivity
- Poor mechanical
properties
Hybrid - High
conductivity
- no leakage
of electrolyte
- easy
polymer
p
rocessin
g
-Electrochemical stability
Furthermore, the validation of SoC via various
standard cycles have been identified. The state ofthe
literature on the LiPO battery is shown in figure 1.
Figure 1: Number ofresearch paper under consideration
for a particular topic.
2 LITERATURE REVIEW
2.1 Soc Estimation
With the development and wide application of Li
based batteries, the estimation of battery’s SoC is
utmost important and hence the estimation of SoC
has been extensively researched and different
methods have been proposed. Battery system being
highly non-linear it is very much important to have
an accurate estimation of SoC as it can avoid the
condition of overcharge or over-discharge thus
increasing the life of the battery.
Various methods of SoC estimation proposed can
be broadly classified into the direct method, Book
Keeping method, artificial neural network and model
based method with a filter algorithm, as shown in
figure 2. The direct method to estimate SoC remains
by monitoring voltage and electrochemical
impedance. Though the method is simple and easy to
implement. This method is difficult to implement in
real-time as the driving cycle is very uncertain
(Sathyanathan and Sugumaran, 2018). This requires
to evaluate the charge retained by the battery before
calculation. Moreover, it has a large measuring time
Xiong et al., (2013), hence its practical application is
very complex (Dowgialloal, 1976). Open circuit
voltage estimation being another method for SoC
estimation, but the time required by the battery to
reach equilibrium is large and hence cannot be used
for real-time application (Meng et al., 2016 and Lee
et al., 2018).
Book Keeping method is based on battery current
integration also called as Ampere-hour counting or
Coulomb counting method Johnson, (2002) is so
versatile that it is still the basis of SoC estimation in
Battery Management System (BMS) provided the
accuracy in measuring the current and initial SoC of
battery is maintained (Xiong et al., 2013; Lee et al.,
0
5
10
15
20
25
ICACSE 2021 - International Conference on Advanced Computing and Software Engineering
244

2018; Xu et al., 2014 and Chen et al., 2016). This
method is simple and easy to implement (Xu et al.,
2014). Since this method is an open-loop system, so
neither of errors in the system can be detected nor
fixed thus accumulating errors (Xu et al., 2014).
Further, SoC estimation does not take into account
battery age, health, temperature (Sathyanathan and
Sugumaran, 2018 and Hansen et al., 2005). Artificial
neural networks and fuzzy logic system were
developed for SoC estimation but it required high
and very complex computational so it cannot be
applied on the online system (Lee et al., 2018; Xu et
al., 2014 and Chen et al., 2016). The various model
based method with filter algorithms such as Support
Vector Machine (SVM) method, Sliding Mode
Observer, Kalman filter was developed to estimate
SoC.Every method has its own pros and cons.
Support Vector machine requires low memory but
accurate training data and proper kernel function are
required (Lee et al., 2018 and Hansen et al.,
2005).Kalman Filter is a powerful tool as SoC
estimation does not depend on initial SoC value and
it can detect and model cell ageing Hansen et al.,
(2005) but to accomplish this advantage an accurate
battery model and appropriate knowledge of system
noise are required (Sathyanathan and Sugumaran,
2018; Xiong et al., 2013; Xu et al., 2014; Xiong et
al., 2005 and Junet et al., 2014). Sliding Mode
Observer leads in simple control and robust
performance under uncertain environments (Xu et al.,
2014 and Junet et al., 2014) but the chattering
phenomenon cannot be ignored (Xu et al., 2014).
Some advancements in these basic techniques, such
as Robust Sliding mode observer, Extended Kalman
filter, Adaptive unscented Kalman filter were
employed to escape from those drawbacks, to have
fast convergence, error below 3%, less computational
burden and many more. A detailed comparison of
various techniques has been described in table 2.
Figure 2: Classification of SoC estimation techniques
2.2 Battery Model
To estimate the exact performance of battery such as
SoC and State of Health (SoH), it is important to
have an accurate battery model. Further, this will
help to improve the charging and discharging pattern
of the battery (He et al., 2011). Modelling of the
battery for any application can be achieved via
electrochemical model, statistical model,
probabilistic model, neural network model,
equivalent circuit model and analytical battery
models. A detailed comparison of these models has
been shown in table 3. Numerous electrical
equivalent circuit models were developed to
simulate the battery performance. Further,
development has been made to model and
compensate for the temperature error (Moshirvaziri
et al., 2015) and fault diagnosing (CemKaypmaz et
al., 2011).
Table 2: Comparison of various SoC estimation techniques.
S.No.
SoC Estimation
Techni
q
ues
Advantage Disadvantage
1
Direct Method Simple and easy to implement -Uncertainty in driving cycle leads to difficulty in
measurement of SoC and parameter characterization
in real time(Sathyanathan and Sugumaran, 2018)
-Before new calculation, BMS requiresto determine
the charge remaining in battery(Xiong et al., 2013)
- Large measuring time. (Xiong et al., 2013)
Open circuit voltage
estimation
Simple and easy to implement -Time required by battery to reach equilibrium is
large and hence cannot be used for real time
a
pp
lication (Men
g
et al., 2016) (Lee et al., 2018).
2
Ampere-hour
counting or
Coulomb counting
-Simple and easy to
implement (Xu et al., 2014)
-Consider both current
-Accuracy of estimation depends on accurateness in
measurements of the current and initial SoC of
battery (Xiong et al., 2013; Lee et al., 2018; Xu et
SoC
Estimation
Direct
Method
Open
Circuit
voltage
Estimation
Book
Keeping
Method
Ampere-
hour
counting
Artificial
Neural
Network
Model
based
method
with filter
algorithm
SVM
Observer
techniques
SMO
RSMO
Proportional
Integertal
Observer
Kalman
Filter
Kalman
Filter
EKF
UKF
AKF
AUKF
AEKF
A State of Charge and Parameter Estimation of Li-Ion Polymer Battery: Current State
245

or current
integrationmethod
measurement and integration
- Basis of SoC estimation in
BMS
al., 2014 and Chen et al., 2016)
-The coulomb counter cannot detect and fix the
starting error
-SoC estimation does not take into account battery
ageing(Meng et al., 2016 and Hansen et al., 2005)
- Since the system is open loop, it is prone to
accumulation erro
r
(Xu et al., 2014).
3
Artificial Neural
Networks or Fuzzy
Logic
A powerful tool for non-linear
system (Xu et al., 2014)
-Learning process requires high computational and
is very complex and cannot be applied on online
system (Lee et al., 2018; Xu et al., 2014 and Chen
et al., 2016)
-High burden on BMS (Chen et al., 2016)
-Lar
g
e memor
y
is re
q
uire
d
.
Model based method with a filter algorithm
4
Luenberger
observer
-The result depends highly on the accuracy of the
model (Xu et al., 2014)
- Computational complexity is high enough for
online a
pp
lication (Xu et al., 2014)
Sliding mode
observer (SMO)
-Easy control and robust
performance in uncertain
environments (Xu et al., 2014
and Junet et al., 2014).
-Good convergence (Junet et
al., 2014).
-Compensate for the effect of
nonlinearit
y
and uncertaint
y
-The chattering phenomenon causes an error (Xu et
al., 2014 and He et al., 2011)
-Inappropriate switching gain can cause slow
estimation of SoC.(He et al., 2011)
Robust Sliding
mode observer
(RSMO)
-Strong robustness for time-
varying and non-linear battery
system (Chen et al., 2016)
- Fast convergences and
accurate results when
compared to SMO
- The chattering phenomenon causes an error.
Proportional
Inte
g
ral observe
r
-More robust performance
under uncertain environments
-The chattering phenomenon causes an error (Xu et
al., 2014 and He et al., 2011)
Kalman filter - SoC estimation does not
depend on initial SoC value
- It can detect and model cell
ageing (Hansen et al., 2005)
- It is an optimization method
of the Luenberger observer
(Xu et al., 2014)
- The result depends highly on the accuracy of the
model.
- Inappropriate knowledge of noise in the system
will lead to remarkable error and divergence
(Sathyanathan and Sugumaran, 2018); Xiong et
al., 2013; Xu et al., 2014; Xiong et al., 2005 and
Junet et al., 2014)
- Computational complexity is high enough for
online application (Xu et al., 2014)
- It linearizes the non-linear system (Meng et al.,
2016 and Chen et al., 2016)
Extended Kalman
Filter (EKF)
- SoC estimation does not
depend on the initial SoC
value (Lee et al., 2018).
- Detect and model cell ageing
and other lifetime effects on
battery, the accuracy of ±5%
can be achieved (Hansen et
al., 2005).
- Linearizes the non-linear
system (Meng et al., 2016;
Chen et al., 2016 and Wu al.,
2018)
- SoC depends on a particular type of system.
- High computational complexity, computational
time and implementation cost (Hansen et al., 2005).
- Since higher order terms are ignored, linearization
error is expected (Meng et al., 2016 and Chen et
al., 2016).
- Accuracy is reached for first order only (Wu al.,
2018)
Unscented Kalman
Filter (UKF)
- More accurate and easier to
implement when compared to
EKF (Meng et al., 2016)
- Noise still remains a major issue.
- The high computational burden (Meng et al.,
2016).
ICACSE 2021 - International Conference on Advanced Computing and Software Engineering
246

-Unscented transformation to
approximate the probability
density function (Chen et al.,
2016).
Adaptive unscented
Kalman filter
(
AUKF
)
-Adaptively adjusts process
noise covariance (Meng et al.,
2016)
- Result depends highly on the accuracy of model.
-High computational burden (Meng et al., 2016).
Adaptive Extended
Kalman filter
(AEKF)
- System adaptively updating
the process
and measurement noise
covariance.
- High computational burden
Support Vector
Machine (SVM)
-Memory requirement is less.
- Successful for the highly
non-linear system.
-After training, SVM does not
require to call intensive math
function, as in case of EKF
-An optimized SVM can offer
an accuracy comparable to
EKF at the cost of simple
coulomb counter (Hansen et
al., 2005)
Accurate training data and proper kernel function
are required. (Lee et al., 2018)
Table 3: Comparison of various battery models.
Battery model type Advantages Disadvantages
Electrochemical model -Fully describe the characteristics of battery
(He et al., 2011 and Ceylan et al., 2014)
- Most accurate and can be used as a
reference for comparison with other models
-Very complicated and difficult to
configure. (He et al., 2011; Ceylan et
al., 2014)
- Difficulty in simulating the dynamic
performance (He et al., 2011)
- Long computation time (Ceylan et
al., 2014)
Statistical models -Extract data from samples of data. (Ceylan
et al., 2014 and Krintz et al., 2004)
-Compact and fast (Ceylan et al., 2014 and
Krintz et al., 2004
)
-Not as accurate as physical models
(Ceylan et al., 2014 and Krintz et al.,
2004)
Probabilistic model -Extract data from sample data. (Ceylan et
al., 2014 and Rao et al., 2005)
- Better results as compared to Statistical
models
- Complex method
- Require advanced simulation
techniques (Ceylan et al., 2014 and
Rao et al., 2005
)
Neural network model High accuracy under certain conditions (He
et al., 2011)
- Accuracy and calculation burden of
the model was influenced by the
choices and quantity of input
variables of theneural network. (He et
al., 2011)
- Neural network trained by data can
only be used within the original
sco
p
e of that data
(
He et al., 2011
)
Equivalent circuit model - High dynamic simulation with high
accuracy (He et al., 2011)
- Temperature dependent model of the
b
attery is available
- Not as accurate as Electrochemical
model.
Analytical Battery Models - Electrochemical and statistical methods are
combined (Ceylan et al., 2014)
- High accuracy, robust, compact and fast
(Ceylan et al., 2014 and Jongerden et al.,
2009)
A State of Charge and Parameter Estimation of Li-Ion Polymer Battery: Current State
247

OCV(pu)
SoCinpercent
.2
.8
.6
.4
1
20
80
6040 100
2.3 Parameter Identification
Once the battery model is known then it is required
to identify the parameters of the model so as to
incorporate the dynamic performance of the battery.
Many such techniques that identify and optimize the
battery parameters are Recursive Least Square
(RLS), Genetic Algorithm, Generalized Pattern
Search (GPS) Hooke Jeeves optimizationalgorithm,
extended Kalman filter, least square support vector
machines. Temperature and ageing parameters of the
battery were also modelled by many authors to
investigate the battery depth of discharge, efficiency
and much other performance parameters (Dogger et
al., 2011). The importance of temperature in the
battery was felt and authors in Lee et al., (2012)
installed temperature sensor in battery and authors in
Pruteanu et al., (2012) proposed a method to predict
the thermal behaviour of LiPO battery.
2.4 Charging of Batteries
A proper charging cycle would increase the life of
the battery. The basic charging pattern is Constant
Current/Constant Voltage (CC/CV) charging which
is not sufficient for fast charging. Authors in (Choe
et al., 2013) have developed a charging algorithm
that determines the magnitude of charging current
and duration of charging current on the basis of SoC
of the battery and the Li concentration at the surface
of the electrode. Authors Kim et al., (2016) proposed
a strategy to reduce the charging losses inLiPO
battery while in Amanor et al., (2018) authors
discussed the strategies to have faster and efficient
battery charging techniques by determining the pulse
width and frequency of the charging pulse.
3 SOC ESTIMATION
TECHNIQUES
SoC estimationof a battery is very much vital for
battery based devices such as Mobile phones,
Laptop, Electric Vehicles (EV) Solar charger and
much more applications.
SoC is defined as the measurement of the charge
contained in the electrode calculated in terms of the
lithium concentration. SoC can also be understood
as an indicator or energy available within the battery
(Watrin et al., 2012). So estimating the SoC is of the
utmost important parameter in a battery. Definition
of SoC is not very easy and consistent as it can be
expressed by other parameters (Dogger et al., 2011;
Charkhgard and Farrokhi, 2010). In general, the SoC
has described the relationship between the current
capacity (q(t)) and rated capacityof the battery as
given in equation 1 (Dogger et al., 2011; Charkhgard
and Farrokhi, 2010).
𝑆𝑜𝐶
𝑡
(1)
Equation 2 gives the expression of SoC in
continuous form and discrete form with Δt as the
sampling interval.
𝑆𝑜𝐶 𝑆𝑜𝐶
.
𝑆𝑜𝐶
𝑆𝑜𝐶
𝜂.𝐼
(2)
Where η is charge or discharge efficiency, I refer to
current flowing through the battery q
n
is the rated
capacity of the battery. SoC
K
is the SoC at the k
th
instant.
In the Direct method, SoC is estimatedfrom the
open circuit voltage (OCV)and SoC curve of the
batteryof a Li-ion Polymer. There is no linear
relationship between SoC and OCV of Li-ion PO
battery (Shown in figure 3) and the relationship is
different for different batteries.
In Open circuit voltage estimation method
employs the fact that internal impedance causes
voltage to drop as the battery discharges. In other
words, one can say that EMF of battery is related to
SoC.This method comes with serious drawback that
as the battery is near to get discharged, the error in
SoC estimation is large (Chang et al., 2013).
In Ampere-hour counting or Coulomb counting
or current integrationmethod, the discharging current
I(t) is integrated to calculate the charge remaining in
the battery and thus estimating the State of Charge
(SOC(t)) of the battery as mentioned in equation 3.
Figure 3.
ICACSE 2021 - International Conference on Advanced Computing and Software Engineering
248

𝑆𝑂𝐶
𝑡
𝑆𝑂𝐶
𝑡1
∆𝑡 ( 3 )
Where SoC (t-1) is previously estimated SOC value.
Accuracy in SoC estimation depends on various
factors such as discharging current pattern, battery
SoH, temperature and life cycle.
Input Layer
(Indicating Battery
Status)
Output Layer
Hidden Layer
Actuall Voltage
Actual Current
Temperature
Estimated SOC
Figure 4: SOC estimation using backpropagation
techniques
In Back propagation neural network method, SoC is
predicted on the basis of recent data of current,
voltage and battery temperature Linda et al., (2009),
a typical block diagram for back propagation
technique is shown in figure 4. The architecture
contained actual voltage, actual current and actual
temperature as inputneurons. Output layer,
containing one layer, is used to estimate the
SoC.Architecture is shown in figure 4. Equation 4
governs the input of neurons inthe hidden layer.
𝑛𝑒𝑡𝑖
∑
𝑥
𝑣
𝑏
(4)
Where neti
j
is referred to input to j
th
hidden layer
neuron; x
i
is referred to input to hidden layer neuron
j; v
ij
is referred to weighted function between i and j
and finallyb
j
is referred to bias function of the
hidden layer neuron j. The governing equation of
output layer neuron is similar to that of equation 4.
The activation function applied to hidden layer
neuron and output layer neuron is the hyperbolic
tangent function and sigmoid function, respectively.
The advantage of this technique is that it has the
ability to self-learn, self-organize and efficient
mapping of non-linear system.
3.1 Support Vector Machine (SVM)
The SVM Hansen et al., (2005) uses a non-linear
estimator that gives robustness to this technique.
SoC estimation starts with the training of SVM. The
training data should be different from the testing
data and it should cover the entire range of operation
of SVM. Next, the optimum SVM parameter is
calculated. Now the processing of the test data to
obtain the SoC is done in the same way as that of
training data. The root mean square error was
approx. 5% with a positive maximum as +16% and a
negative maximum of9%.
An optimum SVM can condense thousands of
training points to a manageable number of support
vectors. Unlike EKF, matrix inversion and complex
math function are not required to be called in SVM.
3.2 Sliding Mode Observer (SMO)
Technique
The key to the success of SMO Junet et al., (2014)
technique is a simple control structure with
unmatchable performanceunder uncertain
environments. The modified Thevenin model of
battery or Dual Polarization model has been used so
as not to compromise with accuracy in estimation of
SoC.
The technique starts with developing piece-wise
relationship between SoC and OCV. Then battery
system that includes various parameters such as R
t1
,
R
t2
, C
t1
and C
t2
, (as mentioned in table 5) is
developed in state space form, as shown in equation
5. The battery system needs two additional terms
namely sliding feedback gain and Luenberger-type
gain. Luenberger gain ensures stability to the
observer. An additional function sgn
eq
(y), defined in
equation 6, is added to the state-space equation to
remove the chattering levels produced by this
technique.
𝑉
𝑉
𝑆𝑜𝐶
1
𝑅
𝐶
00
0
1
𝑅
𝐶
0
000
𝑉
𝑉
𝑆𝑜𝐶
⎣
⎢
⎢
⎢
⎡
1
𝐶
1
𝐶
𝜂
𝐶
⎦
⎥
⎥
⎥
⎤
𝐼 (5)
𝑠𝑛𝑔
𝑒
(6)
The results from the SMO techniques show that
steady state error is asymptotically stable which
make its performance better for an unpredictable
environment.
A State of Charge and Parameter Estimation of Li-Ion Polymer Battery: Current State
249

3.3 Robust Sliding Mode Observer
(RSMO)
RSMO Chen et al., (2016) technique comes with
switching adaptive gain that helps to predict the SoC
in an unpredictable environment. This is achieved by
designing feedback gain matrix and observer input
function in such a way that robustness and
convergence of error aredefinite. The technique
proceeds with modelling the battery system in
discrete form. Error dynamics is calculated by
obtaining the difference between estimated states
and true states. With the adaption of Radial Basis
Function Neural Network in the RSMO, prediction
techniques can gain robust tracking capability of
parameter against system uncertainty. It can further
significantly restrain the chattering magnitudes in
the SoC estimation
3.4 Extended Kalmanfilter (EKF)
The main focus was to develop the temperature
compensated model of LiPO battery via EKF Lee et
al., (2018), to estimation SoC. The temperature
ranges from 37°C to 40°C. Estimation of SoC is
based on reducing the error between the measured
value and estimated value by adjusting the Kalman
gain. Prediction begins with developing the battery
model in a state-space form that includes Gaussian
Process noise and Gaussian measurements noise.
State-space model of Thevenin battery model is
represented in equation 7.
,
10
0
,
,
,
,
,
𝐼
(7)
Once the battery terminal voltage and state of charge
are calculated then the battery internal voltage is
observed using equation 8 as,
𝑉
,
𝑎
𝑇 1
𝑆𝑂𝐶
𝑉
,
𝐼
𝑅
,
𝑇
𝑏
𝑇(8)
Where R
1t,k-1
(T) refers to the battery resistance at a
particular temperature.
The temperature and voltage are measured and the
initial SoC is determined. Temperature compensated
model is identified and the SoC is estimated using
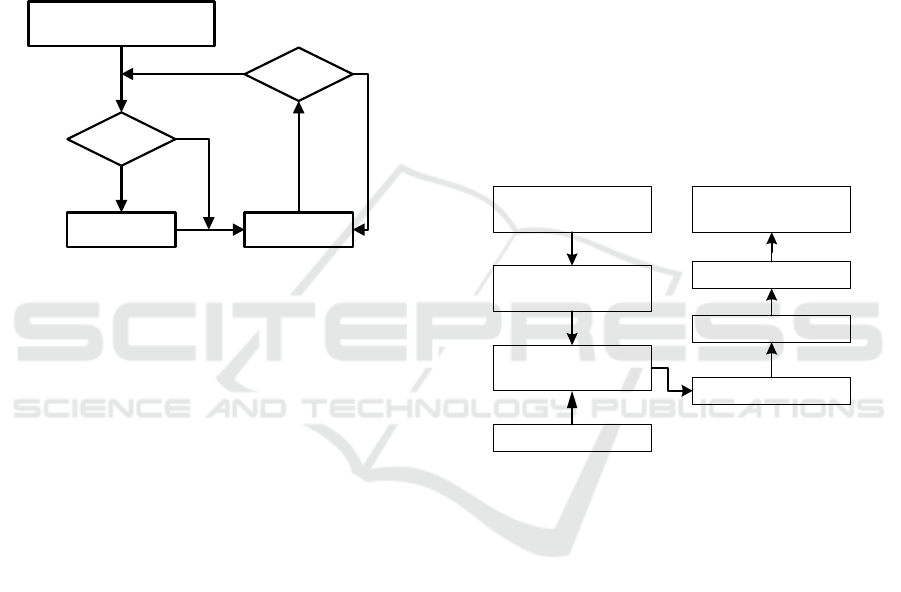
the EKF algorithm as shown in figure 5.
Initialize with measurement
of Temperature and Voltage
Initial SOC is determined
Battery Parameters are
calculated
Experimental
Value
EKF Algorithm
Parameter Updated
SoC and V
t
is
estimated
Figure 5: SoC Estimation block diagram for EKF
technique.
3.5 Unscented Kalman Filter (UKF)
UKF Wu et al., (2018) proceeds with the
discretization of non-linear system dynamics in the
state space equation. SoC is defined on the basis of
equation 2. For SoC estimation in discrete form, the
sampling time of Δt =1 sec is considered. State-
space model of battery is given in equation 9
𝑉
𝑉
,
𝑒
𝐼
.𝑅
1
𝑒
(9)
State variable X
k
, comprises of two variable, namely
SoC
k
, V
t,k
. The observation equation is shown in
equation 10
V
t,k
= V
in
(SOC
k
, T) – I
k
R
1
(SoC
k
,T) – V
t,k
(10)
SoC is estimated by flow chart as given in figure 6.
Figure 6: Flow chart to estimate SoC using UKF.
3.6 Adaptive Unscented Kalman Filter
(AUKF)
AUKF Meng et al., (2016) method gives successful
result in the estimation of SoC because of the fact
that sampling of a non-linear battery system. AKUF
based SoC estimation starts with the basic SoC
Initialize with temperature and SOC
Parameters Look-up
UKF Algorithm updated the time and
measurement
Battery Parameter and SOC Update
OCV, R
1
, R
t1
, C
t1
Vt < Threshold value
SoC
Yes
No
ICACSE 2021 - International Conference on Advanced Computing and Software Engineering
250
equation as shown in equation 2.To incorporate the
system noise, the parameter q
k
has been added in
equation2.The accurate model of the system is
developed via LSSVM where another parameter
r
k
has introduced that account for measurement noise.
Algorithm of AKUF estimation, as shown in
figure 7 starts with an initial value of SoC and then
measurement error and noise in the system is
determined. Then, calculating sigma point and
weighting coefficients. Now, prediction and
correction are done based on set equations. Finally,
adjustment of noise covariance.
M Initial Training Samples of SoC,
Current Voltage
M > N
LSSVM State space
equation
SoC estimation by
AUKF
T < t
Y
N
Figure 7: Flowchart of AUKF algorithm for SoC
estimation.
In order to reduce the computational burden and size
of the data set, the data collection is done by moving
window method. SoC estimation of the battery is
done on the basis of parameters in equivalent circuit
model that is consistently updated on the basis of
age, operating time. Further for computation of SoC,
the initial training sample required for computation
is less.
3.7 Adaptive Extended Kalman Filter
(AEKF)
SoC and peak power capability for a 3.7V/35Ah
LiMn
2
O
4
Li-ion battery is robustly determined by
AEKF(Sathyanathan and Sugumaran, 2018); Xiong
et al., 2005 and Sun et al., 2014). This method is
also used to calculate State of Power (SoP) (Sun et
al., 2014).
SoC is defined and estimated on the basis of
equation 2. The voltage is updated equation is
similar to equation 9 and reproduced here for ready
reference. SoC estimation requires discretization of
the battery system as given in equation 11.
𝑉
𝑉
,
𝑒
𝐼
.𝑅
1𝑒
𝑉
𝑉
,
𝐼
.𝑅
1 𝑒
(11)
Additional terms such as ω
k
representing
unmeasured process noise and υ
k
representing the
measured noise are required to be added in equation
11 (Sun et al., 2014).
Before initialization the AEKF algorithm, it is
required to develop the measurement model and
state transition model that can relate SoC to OCV
The block diagram of AEKF is shown in figure 8.
The algorithm requires the Development of non-
linear model of the battery and then real time current
profile is measured and loaded to the model. This
helps in parameter identification by Recursive least
square. Identified parameters are used to update the
SoC which further helps in updating the OCV.Now
the parameter data and voltage error are transmitted
to AEKF based SoC estimation technique. With the
estimated SoC, OCV is updated and after
computation terminal voltage error converges to set
value. Then SoC reflects the reference voltage thus
estimating correct SoC.
Initialize with random
battery state
Battery parameter State
estimated
Error is calculated and
adapted
Experimental Value
AEKF Gain is updated
SoC estimated
Battery model
SoC and V
t
is accurately
estimated
Figure 8: Block diagram of SoC estimation via AEKF
technique.
3.8 Proportional-integral Observer
SoC is defined similarly to equation 1 and 2. Battery
model could be fully regarded as a linear system if
there is no modelling error or non-linearity are
considered.Non linearity of the system has been
considered as an added to the battery system by
adding a parameter Eυ(t), as shown in equation 13.
𝑥𝐴𝑥𝐵𝑢𝐸υt
𝑦𝐶𝑥𝐷𝑢
(13)
E refers to as non-linearity and υ(t) refers to as
disturbances. There are various parameters that
cause a disturbance in the system such as sensor
noise, temperature and so on. The parameter
dυ(t)/dt≈ 0 since temperature variation is slow, drift
in the current sensor is also slow. So simple case of
dυ(t)/dt ≈ 0 is considered. The Proportional Integral
observer Xu et al., (2014)model is developed
A State of Charge and Parameter Estimation of Li-Ion Polymer Battery: Current State
251

according to the Li-ion battery system as per the
definition. The parametersK
p
, K
i1
and K
i2
of the
observer technique are identified using Linear
Quadratic method.
Finally, to provide a clear view of SoC
estimation, table 4 represents the comparative
analysis of various SoC estimating techniques and
the error associated with it.
Table 4: Comparison of error in various SOC estimation
techniques using a different model and validating cycles.
S.No SOC
Estimation
technique
Error Validating
cycle
Model
considere
d
Remark
1 T-UKF 3 NEDC Thevenin
Model
Temperatur
e
compensati
on
2 RSMO 2.23 UDDS DP
Model
3 SMO 5.81 UDDS DP
Model
4 REKF 1.56 FUDS DP model
5 AEKF 2 - Thevenin
model
6 T-EKF 3 PCC Thevenin
model
7 1.5 FTP72 Thevenin
model
8 EKF 5.31 - Thevenin
model
9 SMO 1.31 - Thevenin
model
10 UKF 3 PCC SOC ≥
20%
11 AUKF 1.2 PCC SOC ≥
20%
12 PI
observe
r
2 UDDS Thevenin
model
13 AEKF 1.5 FUDS Thevenin
model
14 SVM 5.76
15 AEKF 1 UDDS Thevenin
model
16 AEKF 3 FUDS DP model
17 EKF 3 - Neural
Network
model
18 AEKF 1.06 FUDS DP model
4 ELECTROLYTE
Electrolyte plays an important role in the safety of
the battery and hence solid electrolyte is preferred
over liquid electrolyte. But this advantage comes
with the cost of reduced conductivity and many
more issues as mentioned in table 1. Many types of
research are conducted to overcome their
disadvantages.
BaTiO
3
nanocomposite polymer is shaped with
the electrolyte of LiPO battery in order to achieve
better Li-ion concentration at the electrode surface
which was found to be around 3.5 × 10
4
mol/m
3
(Sathyanathan and Sugumaran, 2018).This
has an added advantage of increased conductivity
about 2.4 × 10
-3
S/cm at 343K. The voltage dip from
4.02V to 3.92V in just 5 Sec but remained saturated
at that point.A low cost commercially available
polymer is developed for polymeric binder for
LiM
x
O
y
cathodes, coke or graphite based anode.
Random copolymers of vinylidene fluoride with
hexafluoropropylene can be solvent cast in the
presence of at least 50-60 volume%of liquid
electrolyte solutions, such as 1-M LiPF
6
-EC/PC, to
give strong, homogeneous filmswhich exhibit good
mechanical properties even when temperature raise
to 90°C - 100°C(Gozdz, Tarascon, Schmutz,
Warren, Gebizlioglu and Shokoohi, 1995).Research
has been carried out in lithium salts and copolymer
to have electrochemical stability and conductivity up
to 3×10
-5
S/cm (Venkatasetty and Jeong, 2002). A
low cost environmental friendly polymer electrolyte
membrane (Adding LiClO
4
, to polyvinyl alcohol
(PVA) and polyethene oxide (PEO)) polymer for
LiPO battery has been developed by casting of
polymer solution(Rochliadi et al., 2015). The
optimum ionic conductivity with mechanical
strength of the polymer electrolyte membrane was
observed when PVA and PEO were mixed in the
ratio of 7:3. When the ratio of PVA and PEO
changed to 8: the conductivity increases with the
cost of low mechanical strength. PVA-PEO-LiClO
4
has the potential to qualify as biodegradable
electrolyte membrane for Li-ion battery. The
nanocomposite polymer electrolyte for Li-ion
polymer battery was developed by mixing 50
percent by weight of polyhedral
oligomericsilsesquioxane-functionalized with
polyethene glycol (POSS-PEG) nanoparticle and
polyethylene oxide (PEO)with lithium bisoxalate
borate (LiBOB) which increased the conductivity to
3.98 × 10
-6
S/cm(Reddy et al., 2018).
5 ELECTRICAL MODEL
A well-defined battery model will lead to an
accurate estimation of SoC, SoH, OCV. A detailed
comparison of various modelshas been presented in
table 3.Based on the dynamic characteristics and
working principles of the battery, the electrical
ICACSE 2021 - International Conference on Advanced Computing and Software Engineering
252

equivalentcircuit model such as Rint Model, RC
model, Thevenin equivalent circuit model, PNGV
Model, Dual polarization model, Randels equivalent
circuit was developed by using resistors, capacitors
and voltage sources to form a circuit network (He et
al., 2011). Electrical equivalent model of battery
contains various parameters of battery that are
modelled as resistance, capacitance and ideal voltage
source.
Table 5: Various Parameter of commonly used battery
model.
Common
q(t) Remaining battery capacit
y
q
n
Rated capacity of batter
y
V
t
Terminal volta
g
e of batter
y
V
in
O
p
en circuit volta
g
e
I Load current
Rint Model R
1
Electrolytic resistance
Thevenin
Model
R
t1
Polarization resistance
C
t1
Polarization capacitance
R
1
Electrol
y
tic resistance
PNGV
Model
C
acc
voltage due to accumulation
of load current.
R
t1
Polarization resistance
C
t1
Polarization ca
p
acitance
R
1
Electrol
y
tic resistance
Dual
Polarization
Model
R
t1
Polarization resistance
C
t1
Polarization capacitance
R
1
Electrolytic resistance
R
t2
Electrochemical Polarization
Resistance
C
t2
Electrochemical Polarization
ca
p
acitance
The Rint model comprises of resistance and an ideal
voltage source, both being a function of SoC, SoH
and temperature. Positive and negative load current
denotes for discharging and charging current,
respectively. The open circuit voltageis given by V
t
= V
in
- IR
1
.The equivalent circuit is shown in figure
10. Resistance was evaluated via the following
equation R
SoC
R
k
SoC Einhorn et
al., (2013) where 𝑘
iscoefficient for change in R
1
with SoC.In RC model two capacitors C
c
, C
b
represents the battery state. C
c
represents the
capacitance due to surface effect of battery and has a
small value. The Capacitor C
b
, with large
capacitance, represents the chemical energy stored in
the battery and is responsible for the SoC of battery.
The resistances are R
t
(Terminal resistance), R
e
(end
resistance) and R
c
(Capacitor Resistance) and the
two capacitance C
c
, C
b
describes the electrical
behaviour of battery. The equivalent circuit is shown
in figure 10.
R
1
V
in
V
t
I
Figure 9: Rint model of a battery
In order to include the transient performance of the
battery in Rint model, a parallel RC network is
connected in series, thus giving Thevenin equivalent
circuit model as shown in figure 11. The resistance
R
t1
denotes polarization resistance and capacitance
C
t1
describes the transient response of battery during
charging and discharging. The governing equation of
the model is 𝑉
𝐼𝑅
𝑉
(Sathyanathan and
Sugumaran, 2018; Meng et al., 2016; Lee et al.,
2018; Xu et al., 2014; Chen et al., 2016; Xiong et al.,
2005; He et al., 2011 and Einhorn et al., 2013)
R
t
C
C
R
e
R
C
V
in
V
t
C
b
I
Figure 10: RC model of a battery
C
t1
R
1
V
in
V
t
R
t1
V
t1
I
Figure 11: Thevenin equivalent model of a battery
The parameter of the equivalent circuit model
dependent on SoC and Temperature.In (Ceylan et
al., 2014),the model was used with a new
A State of Charge and Parameter Estimation of Li-Ion Polymer Battery: Current State
253

mathematical function:𝑉
𝑉
𝑅
𝑅
𝐼
𝑅
𝐼𝑒
⁄
whereas in (Sun et al., 2014) open
circuit voltage is given by V
in
= K
o
+ K
1
×SoC+
K
2
/SoC +K
3
×ln SoC +K
4
×ln(1-SoC).
PNGV model takes into account of change in open
circuit voltage in the time accumulation of load
current. This change is incorporated in the Thevenin
model thus giving the PNGV model of battery. The
governing equation of the battery is𝑉
𝑉
𝑉
1
𝐶
𝐼𝑑𝑡 𝐼𝑅
and the equivalent circuit
diagram is shown in figure 12.
C
t1
C
acc
R
1
V
in
R
t1
V
t
V
t1
I
Figure 12: PNGV equivalent model of a battery.
Thevenin model to some extent can easily model
the polarization characteristics of the battery. The
complete polarization is considered in dual
polarization (DP) model. the This model takes into
consideration of polarization that is caused due to
concentration polarization and electrochemical
polarization (Chen et al., 2016; Junet et al., 2014; He
et al., 2011; Choe et al., 2013; Kim et al., 2016 and
Einhorn et al., 2013). The governing equation is
𝑉
𝑉
𝑉
𝐼𝑅
and the equivalent circuit is
shown in figure 13.
V
in
V
t
R
1
V
t1
C
t1
R
t2
C
t2
V
t2
I
Figure 13: Dual polarization model of battery.
6 THERMAL MODEL
The temperature has a serious effect on the battery
and hence it is vital to have thermal modelling. The
battery parameters such as resistance, OCV,
Capacitance are observed as the temperature is
changed from 0
o
C to 40
o
C with the interval of 10
o
C
and then parameters are selected on the basis of
temperature (Wu al., 2018). Conductivity increases
as the temperature was increased from 273K and
reach its maximum value at 343K and then falls off
(Sathyanathan and Sugumaran, 2018).
Change in battery capacity was increased from
0.6116 Ah to 0.6218 Ah as the temperature is
increased from 37
0
C to 40
0
C.With the help of
experimental data and then employing least square
curve fitting method to get the relation OCV(T,SoC)
= a(T) SoC +b(T)(Lee et al., 2018).
Temperature effect on internal resistance and
capacitance is determined by the direct current
internal resistancemethod.
Another relation between the Equivalent series
resistance and temperature provided the ageing
effect is neglected. R = R
0
e
A/T
(Dogger et al., 2011).
7 IDENTIFICATION OF
BATTERY PARAMETER
Once the electrical model of the battery is
developed, the next foremost important thing is to
determine the value of the parameter in the
equivalent circuit. The most basic method is to
experimentally observe the variation in the
parameter with the SoC level at adifferent interval
and then develop the relationship between various
parameters and with SoC or temperature or with age.
The parameter can be identified via conducting
experiments that make battery undergo standard
technique such as pulse current discharge (PCD),
pulse current charge (PCC), Hybrid Power Pulse
Characterization (HPPC), battery test bench with
dedicated software or using estimating techniques
that include least square method with advancements,
support vector machine, extended Kalman
filter.Parameter identification is not limited to the
above methods and can be estimated by combining
the experimental and estimation techniques. Figure
14 presents various battery parameter extraction
techniques.
ICACSE 2021 - International Conference on Advanced Computing and Software Engineering
254

Figure 14: Various method of battery parameter
identification techniques.
A combined version of PCD and PCC test was
conducted to obtain to give the offline battery
parameters that were identified via the least square
method. In real-time or online battery parameter is
identified via forgetting factor recursive least square
(Chen et al., 2016).
One such technique is the HPPC test.The
experiment was conducted with the help of Digatron
EVT500-500 hardware and BTS 500 software at
constant 20
o
C and data from the test were used for
parameter extraction (He et al., 2011). The battery
parameter of improved Thevenin model was
identified with battery test bench that
includesDigatron EVT500-500, with BTS 600
software (He et al., 2011). Various experiments were
conducted on ArbinBT2000 battery test system
hardware and MITS Pro Software within a thermal
chamber with different charge and discharge rates to
determine the parameter (Sathyanathan and
Sugumaran, 2018). Another approach is to collect
data from the experiments andthenemploy Recursive
Least Square (RLS) method with forgetting factor to
determine the electrical parameter of the battery
model (Wu al., 2018).The format given by HPPC to
extract the model parameter, cannot be used by
BMS, so prediction based on particle swarm
optimization can be employed to optimize the
parameters(Sun et al., 2014).
Experiments are conducted and controlled by
LabVIEW in a closed environment and computation
of data is done by MATLAB. The experiments were
conducted from 37
o
C to 40
o
C at an interval of 1
o
C.
The least square method is used to find the battery
modelparameter (Lee et al., 2018).The circuit
parameter has been calculated with the 10A
discharge curve drawn between OCV and SOC. The
circuit impedance is measured at a various frequency
ranging from 0.07 Hz to 7 kHz with temperature
ranging from 5
o
C to 20
o
C, thus helping to extract the
model parameters. The model parameters are
updated itself, based on temperature(Moshirvaziri et
al., 2015).
Battery parameters were mathematically
modelled and were identified with the help of
experimental data, governing equation and a build-in
real-time data acquisition system that was loaded
with the Discharge curve of the battery(Ceylan et al.,
2014).
The least square method is used to estimate the
battery parameter with some advanced technologies
such as recursive least square with optimal
forgetting algorithm used in Xiong et al., (2005)
where battery model parametershave been identified
by multiple linear regression method.
Parameter identification and optimization were
based on cross validation method for least square
support vector machines(Meng et al., 2016).
The battery parametersare identified by the EKF
algorithm(Junet et al., 2014).
Another interesting technique was used
in(Einhorn et al., 2013) where the value of capacitor
C is extracted from the datasheet provided by the
manufacturer and the parameter is linearized. Linear
parameterization requires significantly less time with
a setback of loss of accuracy. The parameter has
been optimized by using GPS Hooke Jeeves
optimizationalgorithm in GenOpt software.
8 VALIDATION CYCLE
Validating cycle simulates the real life condition to
test the battery,thus making it cost
effective.Validating the battery parameter gives the
accurateness in the battery model. Validating would
also increase battery life with optimized battery
performance (Brandt, 1992).A various method such
as Dynamic Stress Test (DST),Federal Urban
Driving Schedule (FUDS),Urban Dynamometer
Driving Schedule (UDDS) or Federal Test
Procedure -72 (FTP-72),New European Driving
Cycle(NEDC), HPPCTest were used for validating
the battery parameters.
DST is performed with the intentions to simulate
the dynamics of battery discharging exclusively for
automotive application. To perform this test a
battery test bench, a temperature controlled chamber
and temperature sensors are required. Test is
performed with the battery fully charged at the
controlled environment and the battery is loaded
Classification
of battery
parameters
Experimental
HPPC
PDC &
PCC
Battery
test
bench
Digatron EVT500-
500, with BTS
600/500 software
Arbin BT2000
with MITS Pro
Software
Estimation
technique
Least square
method
forgetting
factor
recursive
least
recursive
least square
least square
support vector
machines
EKF
A State of Charge and Parameter Estimation of Li-Ion Polymer Battery: Current State
255
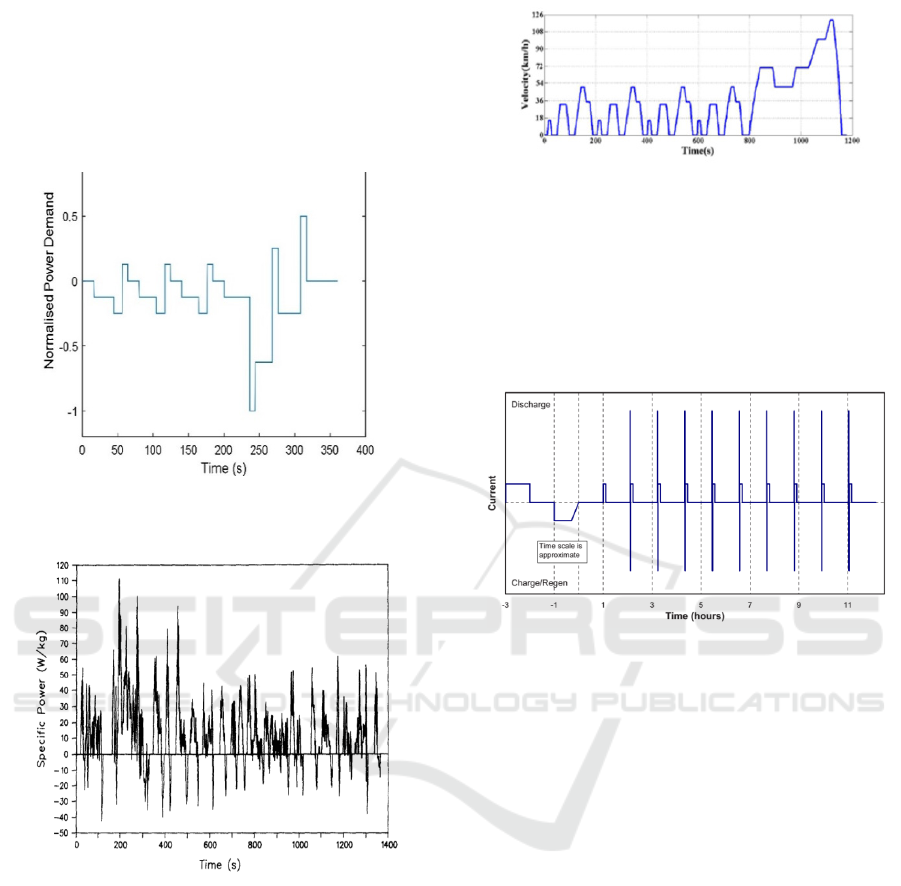
with the set current profile (shown in figure 15) that
include charging and discharging of battery and it
lasts for 360 seconds. Test is continued till the end
of discharge point is reached which is specified by
either by rated battery capacity in ampere-hour or
80% of rated capacity in ampere-hourUnited States
Council For Automotive Research, (2016).
Figure 15: Standard Power profile of DST set by USABC
United States Council For Automotive Research, (2016).
Figure 16: Federal Urban Driving Schedule charging and
discharging profile United States Council For Automotive
Research, (2016).
FDDS test is conducted for 1372 sec with
different power levels shown in figure 16. Such test
requires costly test hardware that includes large
storage.
NEDC, as shown in figure 17, the cycle lasts for
1190 seconds and lasts for 10.93KM. The average
speed is 43.10 Km/hr reaching a maximum speed of
120 Km/hr.
Figure 17: New European Driving Cycletesting profile
(Jeong et al., 2016).
The HPPC test conducted with the aim to
determine the dynamic performance of the device
with 10 sec discharge pulse with 10 sec charging
pulse through regenerative action. This action is
repeated after every 10% discharge with 1-hour rest
period as mentioned in figure 18.
Figure 18: HPPC compete test sequence United States
Council For Automotive Research, (2016).
The standard test cycle discussed above has been
put into the test for different SoC estimation
techniques and the error obtained is mentioned in the
upcoming paragraph.
In Wu al., (2018), to verify the accurateness of
the Thevenin model of battery with temperature
compensation. The test was performed at 5 different
temperatures. The error in battery parameter was
less than 1 percent and the average absolute error
was 0.2551 percent.
The parameter is verified via various current
profile such as PCD, PCC and urban dynamometer
driving schedule. The error in voltage was bounded
within -0.04V to +0.04V(Chen et al., 2016).
Battery parameters were verified via six
succeeding Dynamic Stress Test cycle. It was
observed that Rint model had a maximum error.
Thevenin model and DP model gave error less than
1 percent(He et al., 2011).
EightUDDS tests were used to verify the
parameters(Sathyanathan and Sugumaran, 2018).The
battery model is validated through loading FTP72 or
UDDS current profile in battery model and practical
battery in sealed environment at 20°C. The error was
ICACSE 2021 - International Conference on Advanced Computing and Software Engineering
256

below 0.5 percent. The error would have gone to
lower value if currentmagnitude is made
large(Einhorn et al., 2013).
The model is validated with MATLAB Simulink
environment and experiment with Kokam SLPB
(Superior Lithium Polymer Battery) battery. On
average, the discrepancy in data from modelling is
less than 0.422 percent with the maximum value less
than 3 percent at the end stage of
discharging(Ceylan et al., 2014).
To validate the battery parameter, the calculated
parameter has been compared with experimental
data obtained from Arbin battery test system
BT2000 with MITS Pro software and the average
error was under 0.8806 percent(Junet et al., 2014).
Accuracy of least square support vector
machines based model is done by testing it in a
Simulink model with discharging current profile that
rapidly changes between 0A to 6A. Experiment was
conducted on Li-ion PO battery manufactured by
KOKAM Company. The average absolute error was
less than 2%(Meng et al., 2016).
Simulated results and experimental result showed
3% error in thermal model and 3.5% of SOC error
(Moshirvaziri et al., 2015).
The UDDS profile was loaded to Arbin BT2000
battery system with sealed environment, to verify
and evaluate the effectiveness of battery model
parameters.To verify and evaluate the battery
parameters, an experimental setup that contains
Arbin BT 2000 battery test system which was
maintained at 25°C was tested for Federal urban
driving cycle schedule and Dynamic stress test
current profile. The maximum error was 1%(Sun et
al., 2014).
The battery model is verified by Arbin BT 2000
battery test system. Battery was loaded to Federal
urban driving schedule and the error was confined to
2%(Xiong et al., 2005).
Federal urban driving cycle schedule current
profile was loaded to system to verify the battery
parameters and the error in parameter was under
3%(Xiong et al., 2013).
Evaluation of various battery models (RC model,
Thevenin equivalent circuit model, PNGV Model,
Dual polarization model,) in United States Council
For Automotive Research, (2016) were realized
through various tests such as HPPC, DST and
FUDS. Since different cycle gave a different error
on the available models. So the author concluded
that DP model and Thevenin model gave the least
error in SoC estimation.
9 CONCLUSION AND FURTHER
WORK
In this paper, an attempt has been made to discuss
issues related to the development of Li-Ion polymer
battery namely state of charge (SOC) estimation,
electrolyte used, modelling which includes electrical
& thermal modelling and validation cycles.
Following are the major concluding remarks for
this study:
Among various SOC estimation techniques,
model based method with filter algorithmgave
resultswith the error of less than 3 % with low
burden on battery management system. The common
limitation to these techniques is non linearity of
battery system that is resolved by adopting advanced
methods in Kalman filter such as Robust Sliding
mode observer, unscented Kalman filter, Adaptive
unscented Kalman filter Adaptive extended Kalman
filter.
The success of SOC estimation techniques
depends on the selection of battery’s electrical
model. Among various battery model,dual
polarization model gave better results, followed by
Thevenin equivalent circuit model. But dual
polarization model would create high computation
burden on the system. So, the selection should be in
such a way that it does not increase the computation
burden on the system and still maintain the accuracy
in SOC estimation. Hence, Thevenin equivalent
circuit model is more useful.
Parameters of Battery model need to be
determined so as to imitate the battery performance.
Various experimental/analyticalestimation
techniquescan be used to extract the battery
parameters. Experimental data were collected from
battery test benches such as Digatron EVT500-500
and Arbin BT2000 with dedicated software to
determine the battery parameter.
The estimated parameters need to be validated
in order to have practical applicability. Various
standard test cycles have been developed to verify
the battery model. Error on battery model depends
on the choice of test cycle. All the model discussed
gave the maximum error of 3.0 % and minimum
error of 0.26%.
It has been clear from table 4that error by
estimation technique depends on the considered
model and validating cycle.
The paper focuses on the development of Li-ion
battery with polymer as electrolyte. This gave
flexibility in the design of battery. Polymers
CF
3
SO
2
NLiSO
2
C
2
F
5
and CF
3
SO
2
NLiSO
2
C
4
F
9
gave
A State of Charge and Parameter Estimation of Li-Ion Polymer Battery: Current State
257

high conductivity. Further electrolytes were
developed that resist the formation of dendrites in
battery. Eco-friendly electrolytes were also
developed.
Finally, it will provide a comprehensive text on
Li-ion polymer battery, which will help the
engineers, researchers and technical persons in this
area.
Thefuture directions related to this workare
summarized as.
Very few works of literature were found which
discuss temperature effect on SoC
Few papers discussed reducing the computation
burden onthe battery management system.
Ageing model of the battery needs to be
developed for accurate estimation.
More research is required to develop anaccurate
relationship between battery SoC and battery SoHfor
better estimation.
REFERENCES
or-Boadu, J. M., Guiseppi-Elie, A., and Sánchez-Sinencio,
E. (2018). Search for Optimal Pulse Charging
Parameters for Li-ion Polymer Batteries Using
Taguchi Orthogonal Arrays. IEEE Transactions on
Industrial Electronics, 65(11), 8982 - 8992.
Blomgren, G.E. (2000). Current status of lithium-ion and
lithium polymer secondary batteries. in Fifteenth
Annual Battery Conference on Applications and
Advances, USA, 97-100.
Brandt, D. D. (1992). Driving cycle testing of electric
vehicle batteries and systems. Journal of Power
Sources, 40(1–2), 73-79.
CemKaypmaz, T., and Tuncay, R.N. (2011). An Advanced
Cell Model for Diagnosing Faults in Operation of Li-
ion Polymer Batteries. In proceeding 2011 IEEE
Vehicle Power and Propulsion Conference.
Ceylan, M., Sarıkurt, T., and Balıkçı, A. (2014). A Novel
Lithium-Ion-Polymer Battery Model for
Hybrid/Electric Vehicles. IEEE 23rd International
Symposium on Industrial Electronics (ISIE), Turkey,
366-369.
Chang, W. Y. (2013). The State of Charge Estimating
Methods for Battery: A Review,” International
Scholarly Research Notices, 1-7.
Charkhgard, M., and Farrokhi, M. (2010). State-of-Charge
Estimation for Lithium-Ion Batteries Using Neural
Networks and EKF. IEEE Transactions on Industrial
Electronics, 57(12), 4178-4187.
Chen, X., Shen, W., Dai, M, Cao, Z., Jin., J., and Kapoor,
A. (2016). Robust Adaptive Sliding-Mode Observer
Using RBF Neural Network for Lithium-Ion Battery
State of Charge Estimation in Electric Vehicles. IEEE
Transactions on Vehicular Technology, 65(4), 1936 –
1947.
Choe, S. Y., Li, X., and Xiao, M. (2013). Fast Charging
Method Based on Estimation of Ion Concentrations
using a Reduced Order of Electrochemical Thermal
Model for Lithium-Ion Polymer Battery. in 2013
World Electric Vehicle Symposium and Exhibition
(EVS27), Spain, 1-11.
Dogger, J. D., Roossien, B., and Nieuwenhout, F. D. J.
(2011). Characterization of Li-Ion Batteries for
Intelligent Management of Distributed Grid-
Connected Storage. IEEE Transactions on Energy
Conversion, 26(1), 256-263.
Dowgiallo, E.J. (1976). Method for determining battery
state of charge by measuring A.C. electrical phase
angle change. US Patent 3984762.
Einhorn, M., Conte, F. V., Kral, C., and Fleig, J. (2013).
Comparison, Selection, and Parameterization of
Electrical Battery Models for Automotive
Applications. IEEE Transactions on Power
Electronics, 28(3), 1429 – 1437
Gozdz, A.S., Tarascon, J.M., Schmutz, C.N., Warren,
P.C., Gebizlioglu, O.S. and Shokoohi, F. . (1995).
Polymer considerations in rechargeable lithium-ion
plastic batteries. Proceedings of the Tenth Annual
Battery Conference on Applications and Advances,
USA, 301-306.
Hansen, T., and Wang. C. (2005). Support vector based
battery state of charge estimator. Journal of Power
Sources, 141, 351–358.
He, H., Xiong, R., and Fan, J. (2011). Evaluation of
Lithium-Ion Battery Equivalent Circuit Models for
State of Charge Estimation by an Experimental
Approach. Energies, 4, 582-598.
He, H., Xiong, R., Guo, H., and Li, S. (2012). Comparison
study on the battery models used for the energy
management of batteries in electric vehicles. Energy
Conversion and Management, 64, 113-121.
He, H., Xiong, R., Zhang, X., Sun, F., and Fan, J. X.
(2011). State-of-Charge Estimation of the Lithium-Ion
Battery Using an Adaptive Extended Kalman Filter
Based on an Improved Thevenin Model. IEEE
Transactions on Vehicular Technology, 60(4), 1461 –
1469.
Jeong, N. T., Yang, S. M., Kim, K. S. , Wang, M. S., Kim,
H. S. and Suh, M. W. (2016). Urban driving cycle for
performance evaluation of electric vehicles.
International Journal of Automotive Technology, 17,
145–151.
Johnson, V.H. (2002). Battery performance models in
ADVISOR. Journal Power Sources, 110(2), 321-329,
Jongerden, M. R., and Haverkort, B. R. (2009). Which
battery model to use?” IET Software, 3(6), 445 – 457.
Jun, M., Linhui, Z., and Yurong, L. (2014). State-of-
charge Estimation of Lithium-ion Polymer Battery
Based on Sliding Mode Observer. In Proceedings of
the 33rd Chinese Control Conference, China, 28-30.
Kim, N. Ahn, J. H., Kim, D. H. and Lee, B. K. (2016).
Adaptive Loss Reduction Charging Strategy
Considering Variation of Internal Impedance of
Lithium-Ion Polymer Batteries in Electric Vehicle
Charging Systems. in 2016 IEEE Applied Power
ICACSE 2021 - International Conference on Advanced Computing and Software Engineering
258

Electronics Conference and Exposition (APEC), USA,
1273-1279.
Krintz, C., Wen, Y., and Wolski, R. (2004). Application-
level prediction of battery dissipation,” in Low Power
Electronics and Design. ISLPED'04. Proceedings of
the 2004 International Symposium, 224-229.
Lee, C. Y., Lee, S. J., Lee, Y. M., Tang, M. S., Chen, P.
C., and Chang, Y. M. (2012). In situ Monitoring of
Temperature using Flexible Micro Temperature
Sensors inside Polymer Lithium-ion Battery,” in 2012
7th IEEE International Conference on Nano/Micro
Engineered and Molecular Systems (NEMS), Japan,
698-701.
Lee, K., Dai, M., and Chuang, C. C. (2018). Temperature-
compensated model for lithium-ion polymer batteries
with extended Kalman filter state-of-charge estimation
for an implantable charger. IEEE Transactions on
Industrial Electronics, 65(1,) 589 – 596.
Linda, O., William, E. J., Huff, M. et al. (2009). Intelligent
neural network implementation for SOCI development
of Li/CFx batteries. in Proceedings of the 2
nd
International Symposium on Resilient Control
Systems, USA, 57–62.
Meng, J., Luo, G. and Gao, F. (2016) Lithium Polymer
Battery State-of-Charge Estimation Based on Adaptive
Unscented Kalman Filter and Support Vector
Machine. IEEE Transactions on Power Electronics,
31(3), 2226 – 2238.
Moshirvaziri, A., Liu, J., Arumugam, Y., and Trescases,
O. (2015). Modelling of Temperature Dependent
Impedance in Lithium Ion Polymer Batteries and
Impact Analysis on Electric Vehicles. in IECON, 40th
Annual Conference of the IEEE Industrial Electronics
Society, USA, 3149-3155.
Pruteanu, A., Florean, B. V., Moraru, G. M., and Ciobanu,
R. C. (2012). Development of a thermal simulation
and testing model for a superior lithium-ion-polymer
battery. in 2012 13th International Conference on
Optimization of Electrical and Electronic Equipment
(OPTIM), Romania, 947-952.
Rao, V., Singhal, G., Kumar, A., and Navet, N. (2005).
Battery model for embedded systems," in VLSI
Design, 18th International Conference, 105-110.
Reddy, S. S. S., Ravindra, J. V. R., Reddy, N. H., and
Polu, A. R. (2018). A Novel Nanocomposite Polymer
Electrolyte for Application in Solid State Lithium-Ion
Battery. in 2018 IEEE 18th International Conference
on Nanotechnology (IEEE-NANO), Ireland, 1-4.
Report (2016). Electric Vehicle Battery test manual. by
United States Council For Automotive Research Llc.
Rochliadi, A., Bundjali, B., Arcana, and Dharmi, H. I. M.
(2015). Polymer electrolyte membranes prepared by
blending of poly (vinyl alcohol)-poly (ethylene oxide)
for lithium battery application,” in Proceedings of the
Joint International Conference on Electric Vehicular
Technology and Industrial, Mechanical, Electrical and
Chemical Engineering, 370-373.
Sathyanathan, T., and Sugumaran, C. P. (2018).
Modeling and Analysis of Nano Composite BaTiO
3
Lithium Polymer Battery. IEEE Transactions on
Nanotechnology, 17(1), 161-168.
Sathyanathan, T., and Sugumaran, P. C. (2018). Modeling
and Analysis of Nano Composite BaTiO
3
Lithium
Polymer Battery. IEEE Transactions on
Nanotechnology, 17(1), 161-168.
Sun, F., Xiong, R. and He, H. (2014). Estimation of state-
of-charge and state-of-power capability of lithium-ion
battery considering varying health conditions. Journal
of Power Sources, 259, 166-176.
Venkatasetty, H. V., and Jeong, Y. U. (2002). Recent
Advances in Lithium-Ion and Lithium-Polymer
Batteries. Seventeenth Annual Battery Conference on
Applications and Advances, Proceedings of
Conference USA, 173-178.
Watrin, N. Blunier, B., and Miraoui, A. (2012). Review of
adaptive systems for lithium batteries State-of-Charge
and State-of-Health estimation. In proceeding IEEE
Transportation Electrification Conference and Expo
(ITEC), USA.
Wu, X., Li, X., and Du, J. (2018). State of Charge
Estimation of Lithium-Ion Batteries Over Wide
Temperature Range Using Unscented Kalman Filter.
IEEE Access, 6, 41993 – 42003.
Xiong, R., Sun, F., Gong. X., and Gao, C. (2013). A data-
driven based adaptive state of charge estimator of
lithium-ion polymer battery used in electric vehicles.
Applied Energy, 113, 1421–1433.
Xiong. R., Gong. X., Mi., C. C., and Sun., F. (2013). A
robust state-of-charge estimator for multiple types of
lithium-ion batteries using adaptive extended Kalman
filter. Journal of Power Sources, 243, 805-816.
Xu, J., Mi, C. C., Cao, B., Deng, J., Chen, Z., and Li, S.
(2014), The State of Charge Estimation of Lithium-Ion
Batteries Based on a Proportional-Integral Observer.
IEEE Transactions on Vehicular Technology, 63(4),
1614 – 1621.
A State of Charge and Parameter Estimation of Li-Ion Polymer Battery: Current State
259
