
Traffic Signs Classification using Convolutional Neural Network
(CNN)
Vidisha Verma
1
, Aashna Khan
2
, Shailendra Tiwari
3,*
Thapar Institute of Engineering and Technology, Patiala, India
1,2,3
Computer Science & Engineering Department (CSED), TIET, Patiala-147004, India
Keywords: CNN, Keras, Adam, Traffic Signs, ReLU.
Abstract: A complete ATSR system is proposed in this paper using a Convolutional Neural Network (CNN) based
classifier. After several assessments, a seven-layer architecture has been implemented that was designed to
be fast enough to serve a particular application. The training process was carried out with the Adam’s
Optimization algorithm as an alternate to the Stochastic Gradient Descent (SGD) method. The widely
known “German Traffic Sign Dataset – GTSRB” was partitioned into training, testing and validation
datasets. The development process is delineated in the paper, and it displays the pipeline utilized in the
image processing. The technique put forward was accurate in determining 96.35% of the validation data
with a significantly smaller and faster system compared to similar models.
1 INTRODUCTION
Since the past decade there has been an increase in
computing power which has led to use of computer
vision even in consumer-friendly implementations.
This advancement has made the objective of real-
time road sign identification and classification
achievable.
An automatic traffic sign detection and
recognition system is instrumental in the
development of smart vehicles and smart driving.
Despite the presence of a human operator, it gives
important details that could have been missed due to
human error, thus reducing the number of accidents.
In addition, traffic sign detection and recognition are
also becoming an intriguing subject for automated
maintenance of roads. All roads need to be regularly
monitored for absent or defected signs, since these
situations are a threat to safety. This is normally done
by driving a car on the roads and logging down any
noticeable issues manually. But as is any manual
task, this is lengthy, inefficient and susceptible to
human error and faults. Through computer vision
approach, the job can be mechanized and hence
conducted regularly, which assures safety in driving.
The main motive for designing a system like that is
clear and apparent: to save lives and save costs.
The System consists of two stages. The initial is
the traffic signs detection in video frames or image
with the help of image processing. The latter is
associated with classification of those detected signs,
which deals with execution of artificial neural
networks. The detection algorithm makes use of the
fact that traffic signs have limited colors (blue, red or
white) and specific shapes that can be easily
segmented. The potential regions in segmentation are
extracted to become inputs in the recognition stage.
To a person aware of the progress in computer
vision, the task of detecting and recognizing traffic
signs seems like a simple one. Traffic signs are quite
non-complex objects with distinguishing features.
However, as recent research centers around
commercial applications, the problem focuses on
different constraints. In smart driving or road
regulation set-ups, the issue is not of expertly
detecting and identifying a traffic sign in an image
anymore but detecting it accurately in thousands of
video frames captured by low-quality mass-produced
sensors while minimizing false alarms and
withstanding the extreme and inevitable weather and
lighting conditions.
The system presented is such that it can recognize
the signs in each image processed by the CNN, in
whatever shape; triangular, circular or rectangular.
Through this CNN, classification can be done into 43
discrete traffic signs, which can be easily updated
212
Verma, V., Khan, A. and Tiwari, S.
Traffic Signs Classification using Convolutional Neural Network (CNN).
DOI: 10.5220/0010567100003161
In Proceedings of the 3rd International Conference on Advanced Computing and Software Engineering (ICACSE 2021), pages 212-217
ISBN: 978-989-758-544-9
Copyright
c
2022 by SCITEPRESS – Science and Technology Publications, Lda. All rights reserved

with the addition of new traffic signs in the training
data and using the existing trained network after
remodeling its output layer. The CNN takes the
preprocessed images as inputs, and outputs the
numeric values that represent probability of a
particular class.
2 RELATED WORK
Within the research field of computer vision, various
traffic sign recognition systems have been analyzed.
They are designed for different applications with a
suitable pipeline of algorithms. Various systems
made use of the color representation of symbols to
segment the Region of Interest.
For instance, segmentation was performed by
Shadeed et al. by applying the (positive) U
and(negative) V channels of the YUV system, for red
colors. Hue channel of the HSV system was used
with it in segmentation of red road signs.
In Greenhalgh, (2012) the authors made use of
MSERs at different thresholds in the detection stage
to detect the connected components that maintained
their shape. It used grayscale images for signs with a
white background, however, transformed RGB into a
“normalized red-blue” image for the other signs.
Since traffic signs are usually straight and upright,
HOG algorithm was used to extract the features and
passed to a cascade of SVMs for classification. The
white road signs gave an accuracy of 89.2% and
92.1% for color signs.
SVMs gives better results when the distribution
of images in the classes is uneven and avoids
overfitting Jo, K.H., (2014).
In Lai, Y. (2018), a Convolutional Neural
Network and Support Vector Machines (CNN-SVM)
method was proposed by the authors for carrying out
recognition and classification. The input to the
convolutional neural network is the YCbCr color
space for separating the color channels and
extracting distinct characteristics. Then classification
is done using the SVM. This approach gave a 98.6%
accuracy.
On the contrary, several methods are found that
use only shape information from grayscale images
and entirely ignore color information. In Lorsakul, A.
(2017) the authors converted the RGB images to
grayscale and applied Gaussian filter to smoothen the
image and applied Canny edge detection to enhance
before converting to Binary. It was found that each
image frame took satisfactory processing time to use
in the real application.
A survey of many proposed methods using CNN
was done by the authors in
Hatolkar, Y., (2018)
showing the challenges faced by CNN technique
through time complexity and accuracy. Canny edge
detection was also proposed to solve the problems
and outline the traffic symbols’ edges which can then
be classified using a CNN.
3 TRAINING SET
The training and validation of the CNN is carried out
with the “The German Traffic Sign Recognition
Benchmark” (GTSRB). Fig 1. shows a few examples
of the data set images.
The partition into the Training set, Testing set,
and Validation set has been done. The first partition
(67.12%) consists of 34799 images of size 32 x 32 in
RGB format. The total number of images is 51,839.
The dataset has 43 different classes; however, the
distribution is not even. For instance,
0
th
class which is “20 km/h speed limit sign” has
180 sample images which is the lowest. Moreover,
2
nd
class of “50 km/h speed limit sign” has the
greatest number of samples, that is 2010 sample
images. In total, the training set has an average of
809 samples per class. The second part consists of
12630 pictures which make up 24.4%. The images
are not evenly distributed among the classes here as
well. The third part consists of 4410 images (8.5%),
again not evenly distributed.
4 TRAFFIC SIGNS
RECOGNITION SYSTEM
MODEL
4.1 Traffic Images Preprocessing
This stage is essential to the accuracy and
performance of the model. Thus, prior to the training
or testing of images, these images need to be
preprocessed in a hit and trial way to find the best
order that reduces computation. Following methods
were tried:
Shuffling the training data: This was an important
step done to prevent the model from memorizing the
pattern of images and getting stuck in local minima,
instead of deciding through features.
Normalization of RGB image: This scales each
color RGB pixel from 0-255 range to the 0.1-0.9
range.
Traffic Signs Classification using Convolutional Neural Network (CNN)
213
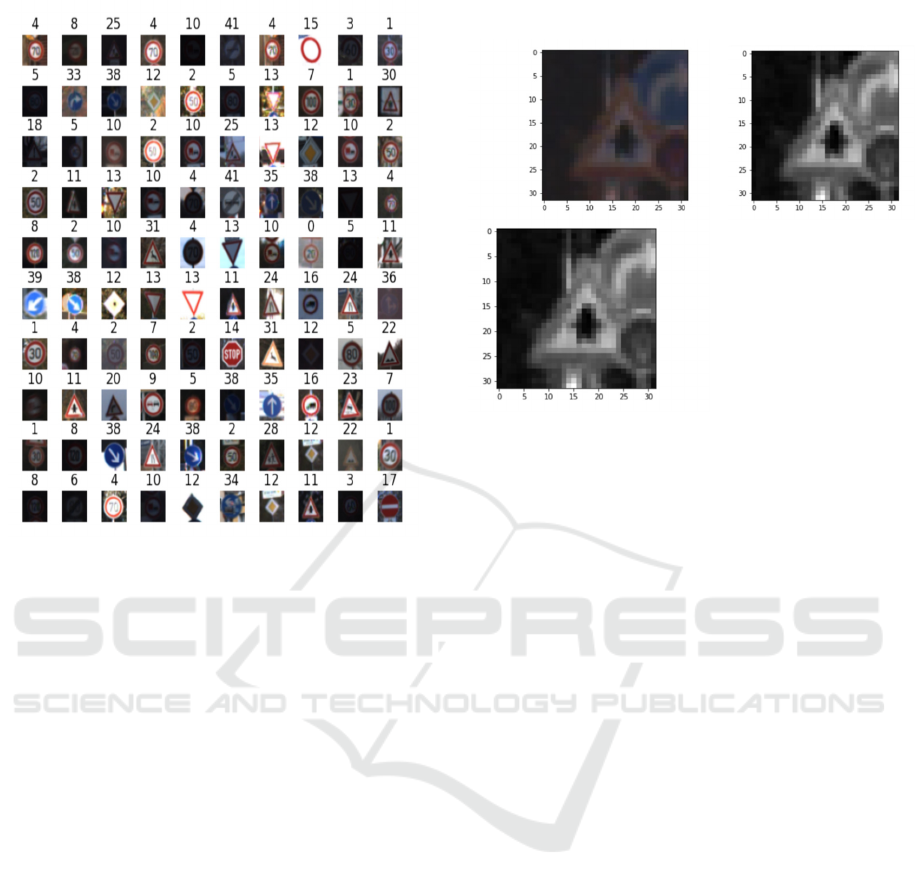
Figure 1: A part of the GTSRB dataset.
Converting images to grayscale: This was done by
subtracting the mean from each pixel and dividing it
by 3. It could also be done using the OpenCV
function “cvtColour”. It reduces computation by
1/3rd as each pixel now has 1 value instead of 3.
Normalization of Grayscale image: Similar method
as above, taking input as grayscale image generated.
Removing the noise: This was tried using
“GaussianBlur” function.
After trying combinations of the above, the best
results were obtained when executing Shuffling of
data, conversion of image to grayscale, normalization
as shown in Fig 2.
4.2 Convolutional Neural Network
The appropriate selection of the non-linearity and
pooling variant design hyper-parameters, directly
impacts the execution of the CNN. The model
proposed essentially consists of four main types of
layers as explained:
The convolutional layer: A kernel or filter of size
3x3 will be convoluted (dot product) with
overlapping submatrices of the digital image (pixel
matrix) to create a feature map. The features detected
depend upon the filter specifications. The kernel size
depended on the stride, padding.
Figure 2: (Top left) Grayscale image. (Top right) Original
Image. (Bottom) Normalized grayscale image.
Nonlinearity: Given that the relationship among the
images and their classes are nonlinear, inserting
nonlinearity is imperative. This is achieved by using
a nonlinear activation that is Rectified Linear Unit
(ReLU). This is commonly applied as it holds the
benefit that CNN learns more quickly than any other
function. It is directly applicable to the convolution
and makes the negative values of every pixel zero
(i.e., max (0, value)).
Pooling Layer: Also called down sampling. It used a
squared filter (such as 2x2 size) to minimize noise
but save the important features. It reduces the
number of computations needed and so large parts of
the next layers can be analyzed without the need of
increasing kernel size. The dimensionality of each
feature map is decreased with Spatial pooling. We
have used Max Spatial Pooling Brownlee, J., (2019).
The completely linked layer: The part of CNN
concerned with the actual decision making and
classification is the fully connected neurons. It
calculates the percentage error and does back
propagation to repeat the last three steps till we find
the weight values with minimum error. This layer
uses the SoftMax activation instead. The input vector
is converted to an equal sized vector wherein the
values have a range of 0 to 1 only and the summation
is always equal to 1. The categorical cross-entropy
function estimates the loss of SoftMax. In general,
the SoftMax function and categorical cross-entropy
are mostly used in computer vision work when there
are more than two classes. The term “Fully
Connected” means that every neuron in the previous
layer is connected to every neuron on the next layer.
ICACSE 2021 - International Conference on Advanced Computing and Software Engineering
214
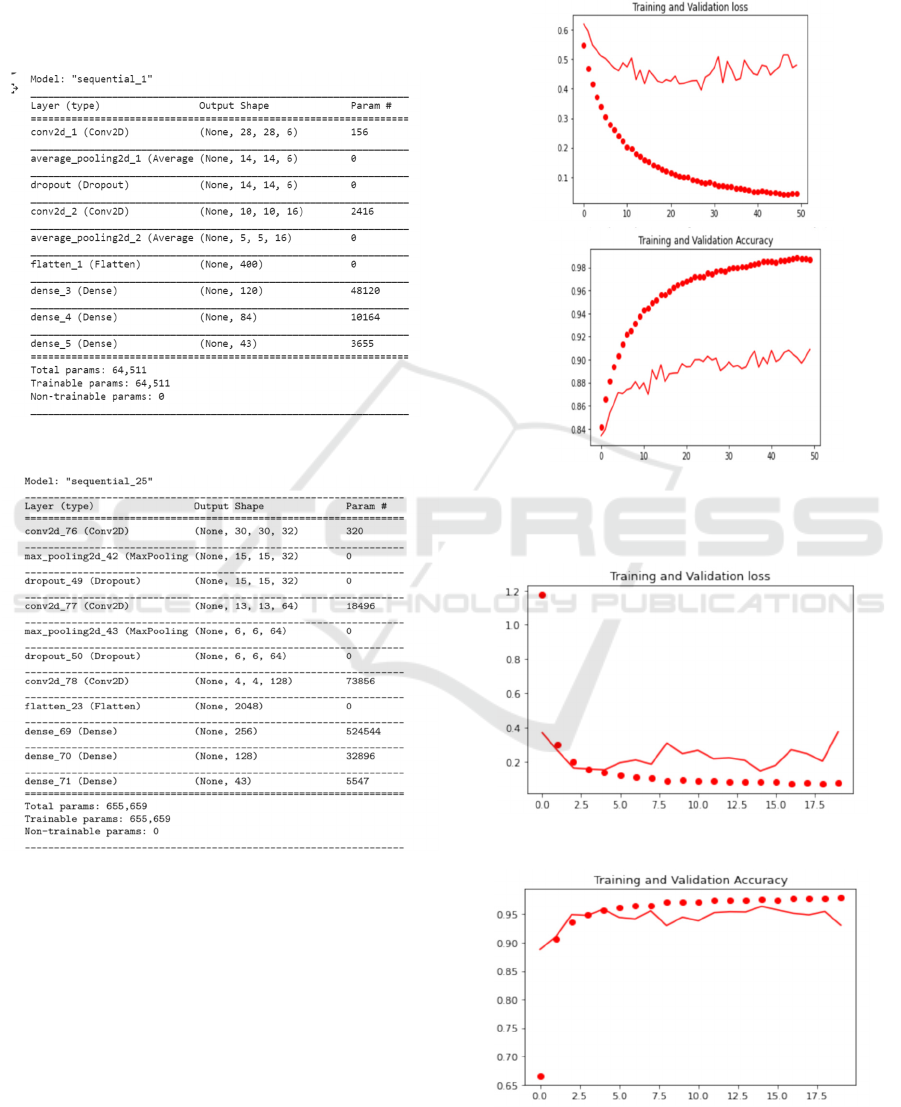
The basic structure of the CNN is shown in Fig 6
and Table 2 shows the different layers and their
parameters. Two drop-out layers of 0.5 are inserted.
This significantly increased the accuracy as it
reduced the codependency among nodes.
Table 1: Initial structure of the CNN before trials.
Table 2: Final structure of the CNN.
4.3 The Learning Algorithm
After setting the hyper-parameters, Adam’s learning
algorithm is used to train the suggested model. It is an
optimization algorithm that is needed because the
CNN weights and biases are initially fixed which
either maximize or minimize a given function. By
learning from the training data, this algorithm updates
its weights in each iteration. It merges the benefits of
other classical stochastic gradient descent (SDG)
learning algorithms. Its benefits include
computational efficiency, less memory requirement
and simple applications. This algorithm calculates
various parameter’s adaptive learning rate by
assessing the gradient’s primary and secondary
moments.
Figure 3: (Top) Initial “Training and Validation Loss”
curve. (Bottom) The initial “Training and Validation
Accuracy” curve.
Figure 4: The final “Training and Validation loss” curve.
Figure 5: The final “Training and Validation Accuracy”
curve.
Traffic Signs Classification using Convolutional Neural Network (CNN)
215
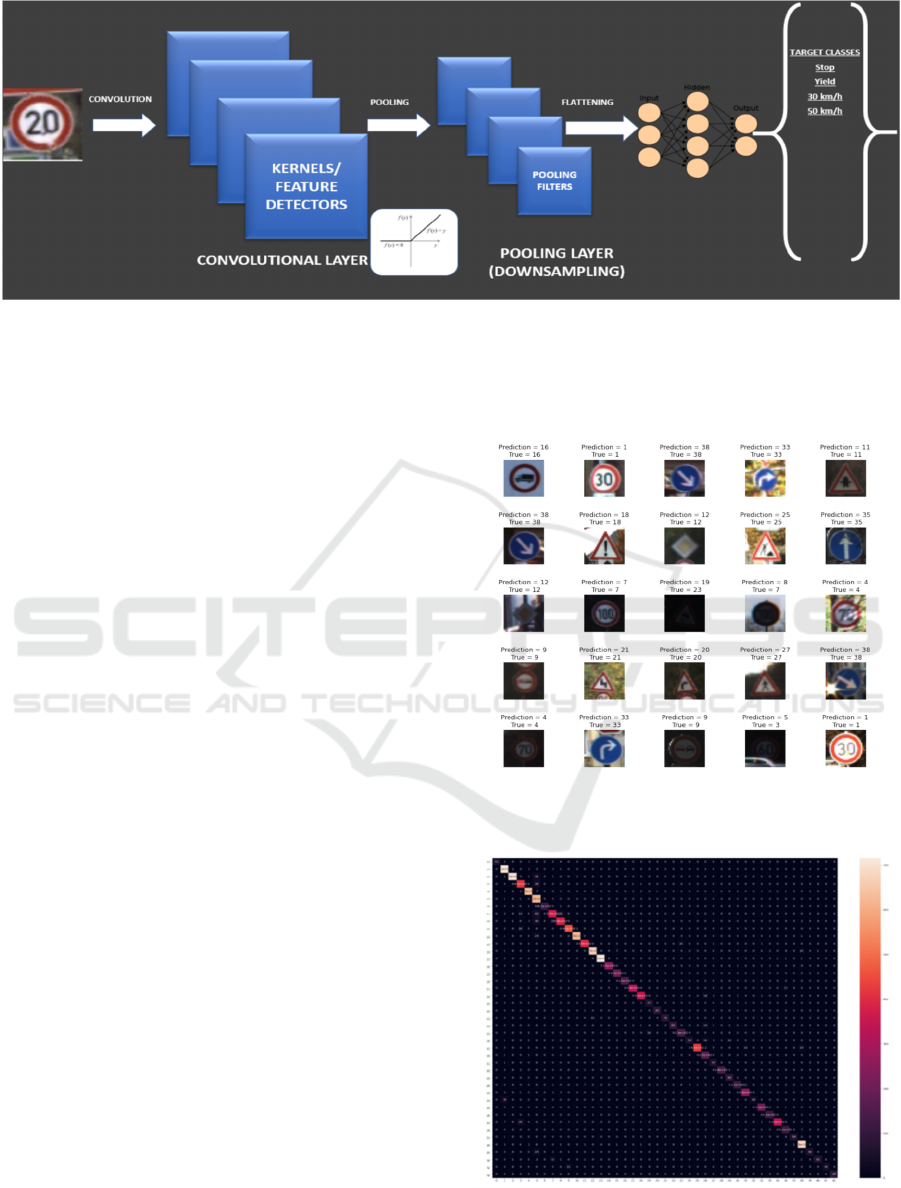
Figure 6: Structure of a basic CNN network with ReLU activation.
5 RESULTS AND DISCUSSIONS
The results achieved with the initial architecture,
shown in Table 1, gave a validation accuracy of not
more than 90% and validation loss was around 0.5
(Fig 3). However, many trials were done by changing
the number of output channels in the convolution
layers, Kernel size was varied from 3 to 6, Max
pooling was selected over Average pooling, the batch
size was reduced from 500 to 32 and the tests and
trials were executed on epochs of size 20,30,50. To
be noted that there is no change in the preprocessing
steps previously described.
Experiments indicate that the number of epochs is
directly proportional to test accuracy; however, it is
the opposite for batch size where it is seen that
growing batch size reduces test accuracy. As seen
from Fig 5 in the Validation and Training accuracy
curve, our best model achieves 96.39% validation
accuracy with a validation loss of 0.1499 from Fig 4.
The confusion matrix is depicted in Fig 8.
The numbers on x-axis portray each traffic sign
class, and the numbers on y-axis portray the outcome
predicted by the classifier. An example of the result
is shown in Fig 7. Analysis and testing of using RGB
images will be carried out as otherwise it misses out
on vital information that can aid the classification
process. Putting the model through robust testing by
applying distortions on freely available data on the
web and mimicking the noise during bad weather or
lighting conditions that are expected.
This model mainly covers the classification step.
With the view to complete the entire functional
ability, it must be linked with a separate model that
concentrates on detection and placements of the road
sign within the original image taken by a vehicle.
Thus, research will be continued of such algorithms
like YOLO, SSD.
Figure 7: The output of the network showing Predicted
class compared to the true class.
Figure 8. Confusion Matrix for 43 classes.
ICACSE 2021 - International Conference on Advanced Computing and Software Engineering
216

6 CONCLUSION
A real time Automated Traffic Classification system
was developed with Convolutional Neural Networks.
The data was preprocessed before inputting to the
network. The ultimate CNN architecture suggested in
this paper comprises of three convolutional layers,
two max pooling layers, two dropout layers and three
dense layers. Cross-validation was carried out with
training data set, validation dataset and testing
dataset. Relation between the model accuracy and the
epoch size, batch size was tested. The importance of
such a system being robust and time efficient was
discussed.
REFERENCES
Greenhalgh, J. and Mirmehdi, M., 2012. Real-time
detection and recognition of road traffic signs. IEEE
Transactions on Intelligent Transportation
Systems, 13(4), pp.1498-1506.
Farag, W., 2018. Recognition of traffic signs by
convolutional neural nets for self-driving
vehicles. International Journal of Knowledge-based
and Intelligent Engineering Systems, 22(3), pp.205-
214.
Gawande, P., 2017. Traffic Sign Detection and
Recognition Using Open CV. International Research
Journal of Engineering and Technology (IRJET), 4.
Shao, F., Wang, X., Meng, F., Rui, T., Wang, D. and Tang,
J., 2018. Real-time traffic sign detection and
recognition method based on simplified Gabor
wavelets and CNNs. Sensors, 18(10), p.3192.
Hatolkar, Y., Agarwal, P. and Patil, S., 2018. A Survey on
Road Traffic Sign Recognition System using
Convolution Neural Network. International Journal of
Current Engineering and Technology, 8(1), pp.104-
108.
Brownlee, J., 2019. A gentle introduction to pooling layers
for convolutional neural networks. Machine Learning
Mastery, 22.
Alghmgham, D.A., Latif, G., Alghazo, J. and Alzubaidi,
L., 2019. Autonomous traffic sign (ATSR) detection
and recognition using deep CNN. Procedia Computer
Science, 163, pp.266-274.
Lorsakul, A. and Suthakorn, J., 2007, November. Traffic
sign recognition for intelligent vehicle/driver assistance
system using neural network on opencv. In The 4th
International Conference on Ubiquitous Robots and
Ambient Intelligence.
Jo, K.H., 2014, February. A comparative study of
classification methods for traffic signs recognition.
In 2014 IEEE International Conference on Industrial
Technology (ICIT) (pp. 614-619). IEEE.
Lai, Y., Wang, N., Yang, Y. and Lin, L., 2018, November.
Traffic Signs Recognition and Classification based on
Deep Feature Learning. In ICPRAM (pp. 622-629).
Traffic Signs Classification using Convolutional Neural Network (CNN)
217
