Classification and Prediction of High and Low Maintainable Class of
Object Oriented Systems at Design Level using Machine Learning
Techniques
Anshita Malviya
1
M.Tech. Scholar, Madan Mohan Malaviya University of Technology, Gorakhpur (UP) India
Keywords: Object Oriented System, Machine Learning Technique, Object Oriented System, Maintenance.
Abstract: In software engineering, maintenance is the one of the most crucial, costly and difficult activity. Numerous
research works are still going on in this area to reduce and measure the maintenance cost. The maintenance
consumes up to 80% of the total software development cost. There is a trend of developing software using
object oriented techniques due to obvious reasons. In this paper, we proposed a classification model to
identify high and low maintainable class at design level of Object Oriented Software development process.
This model is implemented in python using Machine Learning Techniques. Experiment is simulated on
Jupyter Notebook.
1
INTRODUCTION
Software quality is paramount importance for users as
well as for development community. It is difficult to
measure quality in software but its absence makes a great
difference. Designs phase has a crucial impact on
software maintainability. Class is a fundamental unit of
object-oriented systems. Therefore it is a good idea to
design an object-oriented systems keeping in view of
maintainability of a class as a prime concern.
Machine learning, a subset of artificial intelligence, is
so versatile today that we use it several times in a day
without having knowledge of it. We cannot imagine this
world without machine learning as we already got so
many things from it and in future will also get. Learning
is a native behavior of living beings. Living beings gets
new knowledge from the surrounding and modify it by
experiences like happiness and hurdles which comes on
their way. Simulating the learning ability of living beings
into machines is what we all know as machine learning.
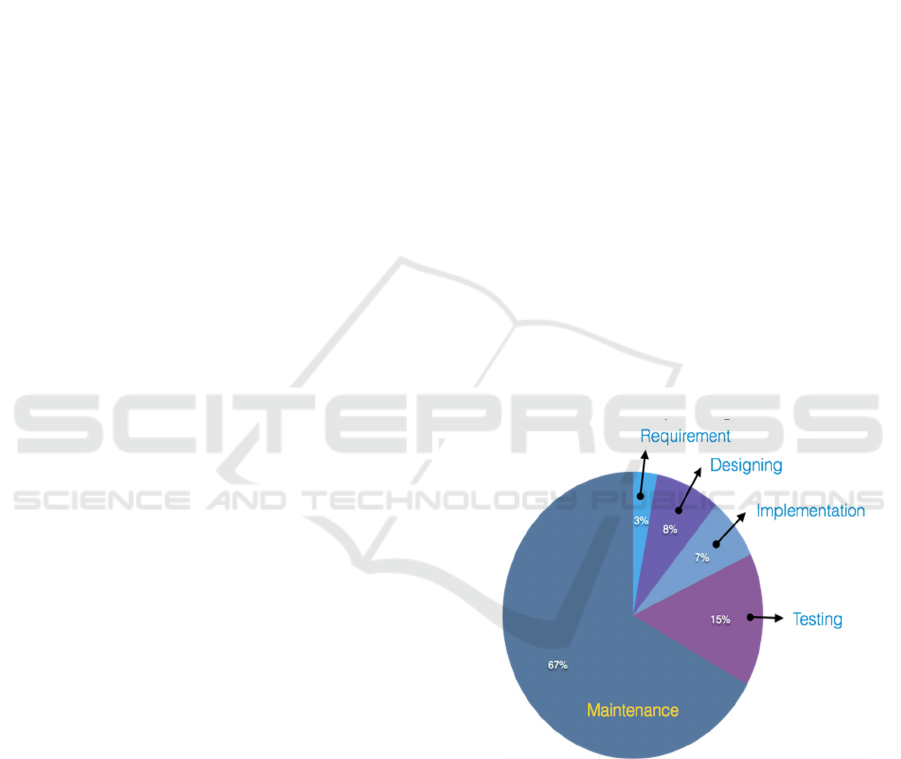
Figure 1 depicts the phase wise cost of software
development process. There are different phases in
software development process which are requirement,
design, coding and testing. Requirement, design, coding,
testing and maintenance phases respectively take 3%,
8%, 7%, 15% and 67% of total development cost.
As we know design phase gives a crucial impact on
software maintenance. Therefore, it is good idea to
design an object oriented system keeping in mind the
view of the maintainability as the prime concern.
Figure 1: Phase wise cost of software process
The object oriented design phase consists of the
hierarchy of the entire classes that are used to build a
software system. Therefore in design phase, we build a
model which tells the software designer that whether a
class is high or low maintainable class. The designer can
modify the high maintainable classes into low
maintainable classes. This way the overall cost of the
software system will be reduced.
Rest of the paper is organized as follows. Section II
introduced the literature survey related to the Software
170
Malviya, A.
Classification and Prediction of High and Low Maintainable Class of Object Oriented Systems at Design Level using Machine Learning Techniques.
DOI: 10.5220/0010564700003161
In Proceedings of the 3rd International Conference on Advanced Computing and Software Engineering (ICACSE 2021), pages 170-176
ISBN: 978-989-758-544-9
Copyright
c
2022 by SCITEPRESS – Science and Technology Publications, Lda. All rights reserved
maintenance. Proposed methodology is presented in
Section III. Proposed work is explained in Section IV.
Section V presented result analysis. Conclusion is given
in section VI. Future work is proposed in section VII.
2 RELATED WORK
In this section, we presented the main works of various
authors related to the prediction of maintenance effort
using different techniques.
Li W. and Henry S. concentrated on various metrics
of object oriented software and the validation of these
metrics with maintenance effort in two business systems.
The author proposed the prediction model involving 10
object oriented metrics. Abdulrahman A. B. B. et al.
proposed a model to predict software maintainability
using Evolutionary Neural Network (NN).
Kaur A., Kaur K., and Malhotra R. Et al. constructed
various models using Artificial Neural Networks, Fuzzy
Inference Systems and Adaptive Neuro-Fuzzy Inference
Systems for prediction and comparison of maintenance
effort.
Marounek Petr measured software maintenance
effort estimation and historical experience using PERT
formula.Ebert C. And Soubra H. studied estimation
technologies which can be applied to maintenance
projects based on the COSMIC (Common Software
Measurement International Consortium. ISO/IEC
19761:2011) method.
Ahn Y. et al. discussed software maintenance size and
the software maintenance effort estimation model
(SMPEEM). The significance of the SMPEEM model is
shown by applying regression analysis on small
maintenance projects.
Lucia A.D. et al presented an effort estimation
models for corrective maintenance projects. They
validated the proposed model to a new corrective
maintenance project within the same organization. They
also made multiple regression model to improve the cost
prediction model which is currently used in large
software organization.
Sheela G. A. S. Et al. proposed maintenance effort
prediction models using numerous statistical techniques
with the help of object-oriented cognitive complexity
metrics.
Malviya A.presented a comparison of some
supervised learning techniques on two data sets. Further,
Author also described machine learning approaches and
classification techniques of Machine Learning.
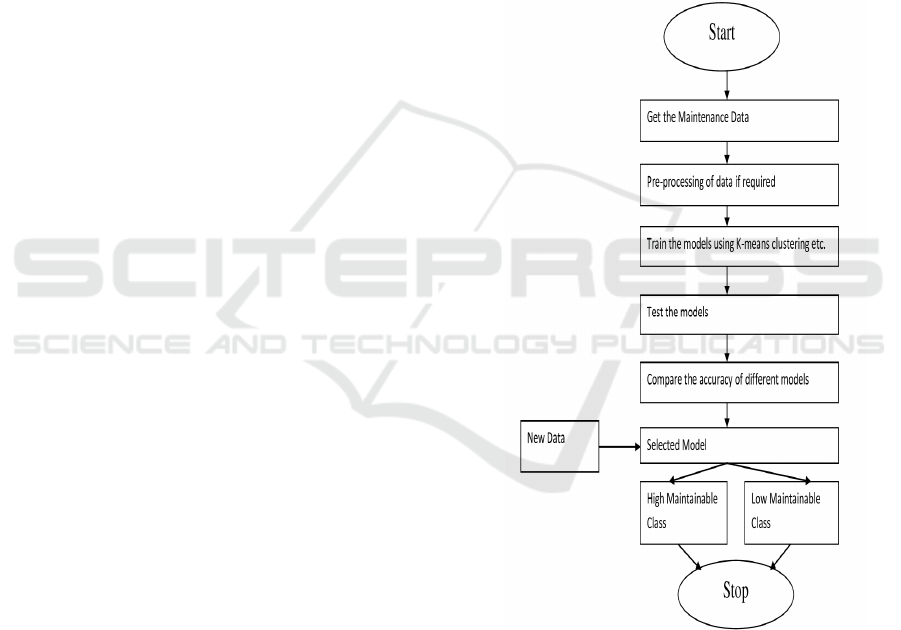
3 PROPOSED METHODOLOGY
Methodology used to make classification model consists
of the following steps given below and also depicted in
Figure 2.
1. Take maintenance Data set in terms of Object
Oriented Metrics
2. Pre-processing of Data set if required
3. Build models with machine learning techniques like
K-means clustering, Hierarchical clustering etc.
4. Compare Accuracy of different models
5. Predict a given class in terms of High and Low
maintainable classes
Figure 2: Methodology to identify high and low
maintainable class
4 PROPOSED WORK
In this section, we developed the classification model
using methodology as mentioned in the previous section
with the help of machine learning techniques. Further,
we explored how to develop classification model step by
step in Machine Learning.
Classification and Prediction of High and Low Maintainable Class of Object Oriented Systems at Design Level using Machine Learning
Techniques
171
4.1 Collect Data
The first step involved in developing the classification
model is collecting data. The goodness of the predictive
model is based on the quality and quantity of the data
collected which turn out to be one of the most important
step in developing a machine learning model.
The maintenance effort data have been taken from
the research paper [3]. The number of lines changed in a
class indicates the maintenance effort given by the
developer. Addition or deletion of a line in a
program/software is used as a measure of line change.
The dataset consist of 8 object oriented metrics, 2
size oriented metrics and 1 change metric which are DIT
(depth in the inheritance tree), NOC (number of
children), MPC (message passing coupling), RFC
(response for class), LCOM (lack of cohesion of
methods), DAC (data abstraction coupling), WMC
(Weighted method complexity), NOM (number of
methods), SIZE1 (number of semicolons per class),
SIZE2 (number of methods plus number of attributes)
and Change (number of lines changed per class in the
maintenance history).
4.2 Prepare and Analyse the Input
Data
After the training data is collected, we move on to The
next step of machine learning is: Data preparation which
is done after collecting the data. Both the datasets used in
this paper are gathered in the form of hardcopy and then
they are stored in the excel form and finally converted to
CSV file format.
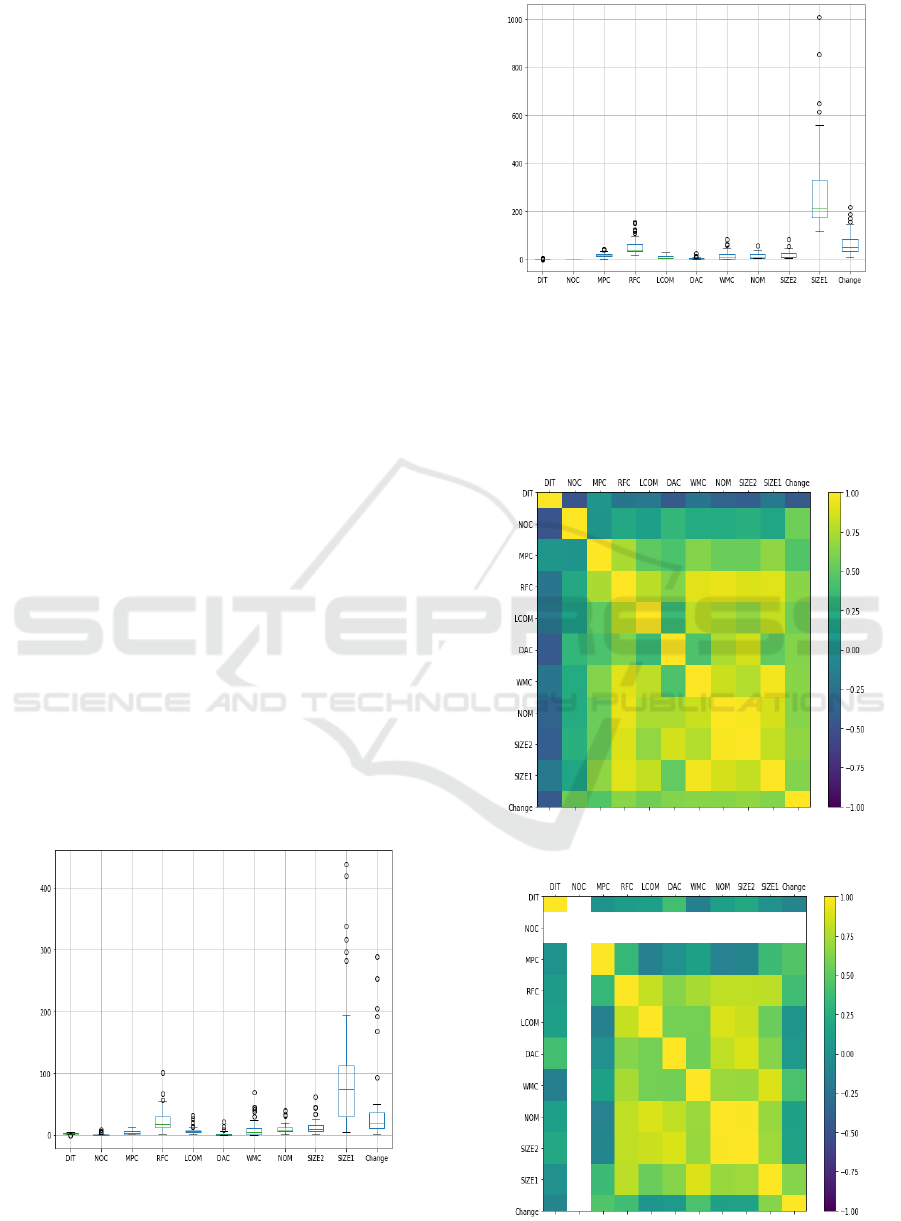
Figure 3 represents the Box and Whisker Plot of
UIMS dataset and Figure 4 represents the Box and
Whisker plot of QUES dataset.
Figure 3: Box and Whisker plot of all attributes of UIMS
dataset
Figure 4: Box and Whisker plot of all attributes of QUES
dataset
Figure 5 and 6 represents the Correlation Matrix
Plot of UIMS dataset and QUES dataset
respectively. Correlation matrix is used to measure
the correlation between each pair of metrics.
Figure 5: Correlation matrix of attributes of UIMS dataset
Figure 6: Correlation matrix of attributes of QUES dataset
ICACSE 2021 - International Conference on Advanced Computing and Software Engineering
172
4.3 Choose Model
Keeping the objective of the paper in mind the K-
means clustering technique is selected. We have
taken two dataset uims dataset and ques dataset. The
metrics taken in both dataset are DIT, NOC, MPC,
RFC, LCOM, DAC, WMC, NOM, SIZE2. The
reason behind taking these metrics is that they are
available at the design level of any Object Oriented
Software thus fulfilling our motive of the paper.
4.4 Train the Model
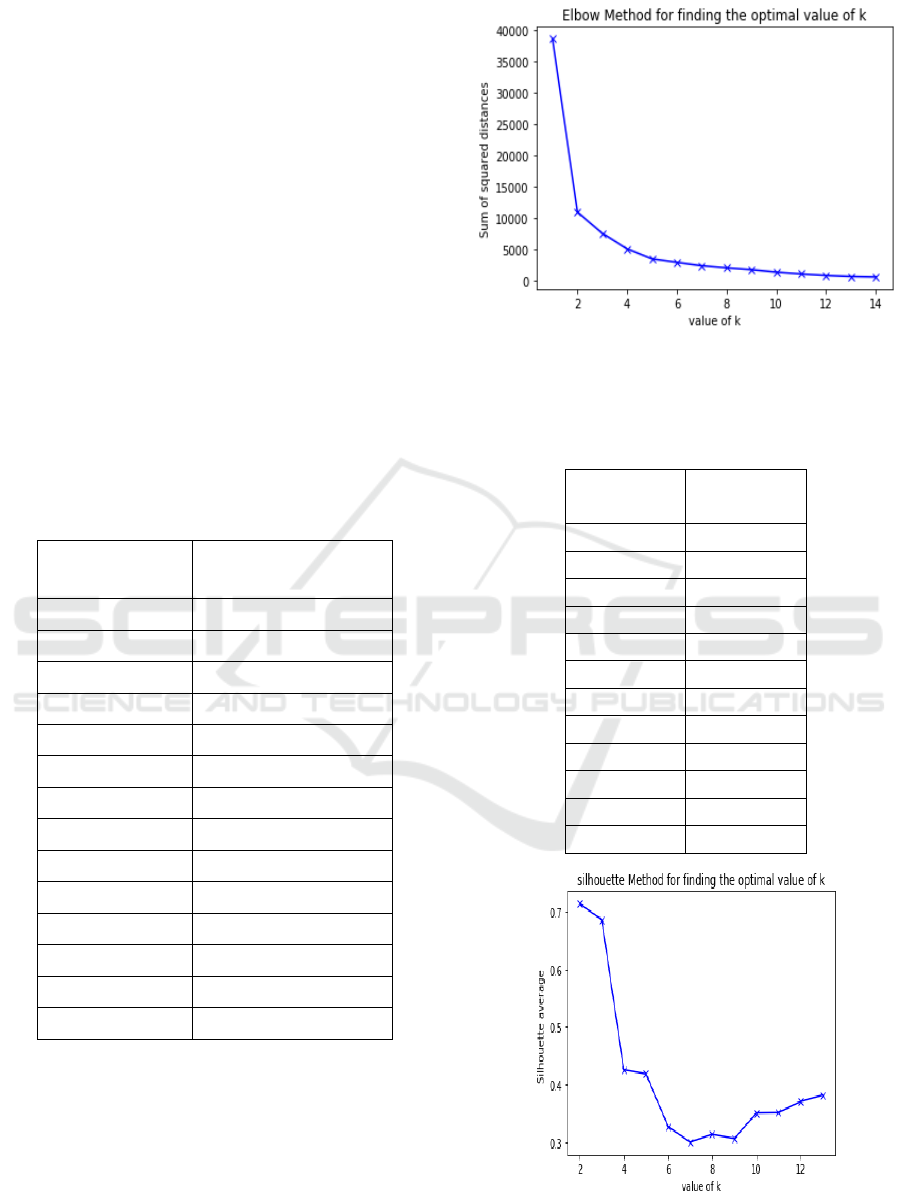
Before training the models we founded the value of
k(number of clusters). For finding the optimal value
of k, two techniques are used namely Elbow method,
Average silhouette method. Table 1 presents sum of
squared distance of clusters of UIMS dataset
whereas Table 2 presents number of clusters versus
Silhouette score of UIMS dataset.
Table 1: Sum of squared distances of clusters of UIMS
dataset
Number of
clusters
Sum of squared
distance(SSD)
1 38600.56
2 10929.28
3 7550.28
4 5069.28
5 3469.48
6 2921.76
7 2376.75
8 1937.80
9 1662.89
10 1316.72
11 1021.57
12 826.53
13 660.73
14 570.58
Figure 7 represents sum of squared distances and
value of k for UIMS dataset. This graph is used to
find out the optimal value of k using Elbow method.
Figure 8 represents silhouette average and value of k
for UIMS dataset. This graph is used to find out the
optimal value of k using Silhouette method.
Figure 7: Graph for finding the optimal of k for UIMS
dataset
Table 2: Number of clusters versus Silhouette score of
UIMS dataset
Number of
clusters
Silhouette
Score
2 0.71
3 0.69
4 0.43
5 0.42
6 0.33
7 0.30
8 0.31
9 0.30
10 0.35
11 0.35
12 0.37
13 0.38
Figure 8: Graph for finding the optimal of k for UIMS
dataset using Silhouette method
Classification and Prediction of High and Low Maintainable Class of Object Oriented Systems at Design Level using Machine Learning
Techniques
173
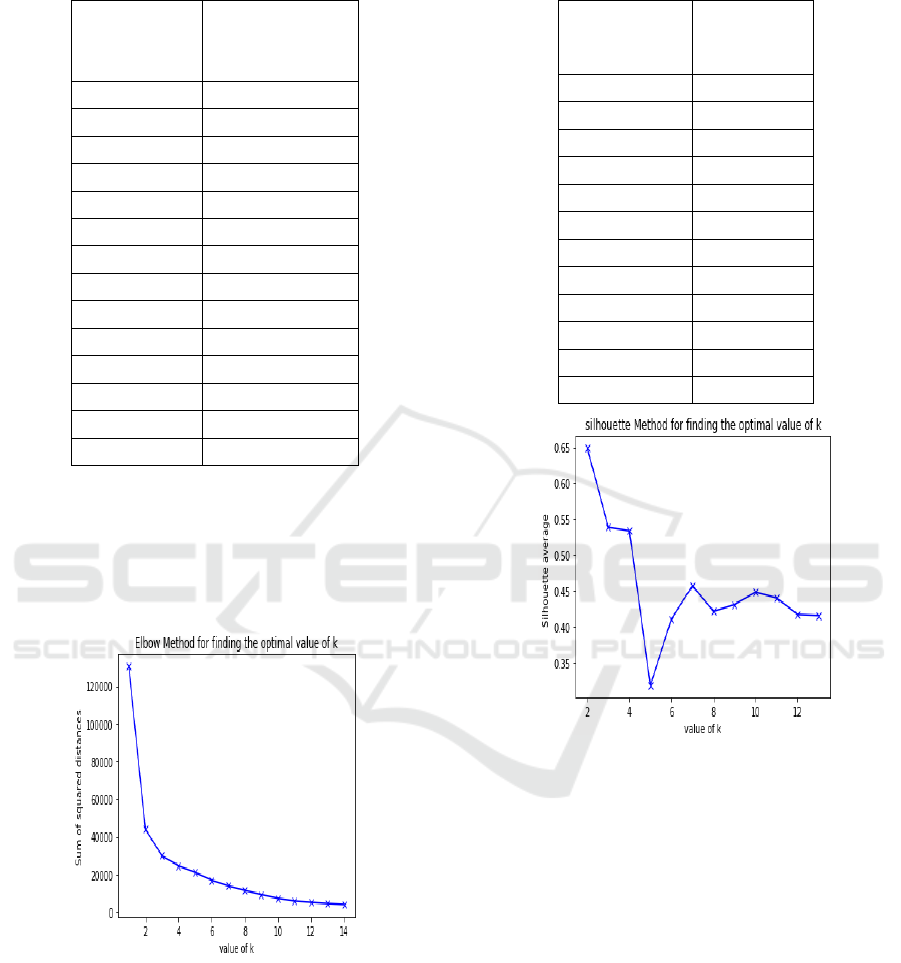
Table 3: Sum of squared distances of clusters of QUES
dataset
Number of
clusters
Sum of
squared
distance(SSD)
1 130444.70
2 43930.00
3 29847.63
4 24536.45
5 20151.6
6 17097.58
7 14553.65
8 11349.45
9 9216.66
10 7461.76
11 5840.61
12 5193.16
13 4434.66
14 4003.12
Figure 9 represents sum of squared distances and
value of k for QUES dataset. This graph is used to
find out the optimal value of k using Elbow method.
Figure 10 represents silhouette average and value of
k for QUES dataset. This graph is used to find out
the optimal value of k using Silhouette method.
Figure 9: Graph for finding the optimal of k for QUES
dataset
Table 4: Number of clusters versus Silhouette score of
QUES dataset
Number of
clusters
Silhouette
score
2 0.65
3 0.54
4 0.53
5 0.32
6 0.41
7 0.46
8 0.42
9 0.43
10 0.45
11 0.44
12 0.42
13 0.42
Figure 10: Graph for finding the optimal of k for QUES
dataset using Silhouette Method
From the above experiment we get to know that
the optimal number of clusters for both dataset using
elbow method is 3 and using silhouette method is 2.
Next we applied the K-means
clustering technique
with number of clusters 2 and 3 for both the datasets.
We divided both datasets into training set and test
set. Training set consist of the 80% of the data and
remaining 20% for the test set. For this we used
X_train, X_test, y_train,
y_test=train_test_split(X, y, test_size=.20).
We used X_train for training the k-means clustering
technique on 2 and 3 clusters for both datasets. The
X_test used to predict the performance of the model.
km=KMeans(n_clusters=2/3,init='k-
means++', n_init=10, max_iter=300,
ICACSE 2021 - International Conference on Advanced Computing and Software Engineering
174
tol=1e-4,precompute_distances='auto',
n_jobs=None, random_state=11, verbose=0,
copy_x=True, algorithm='auto')
km.fit(X_train).
4.5 Evaluate the Model
We evaluated the models using confusion matrix,
classification report and accuracy metrics.
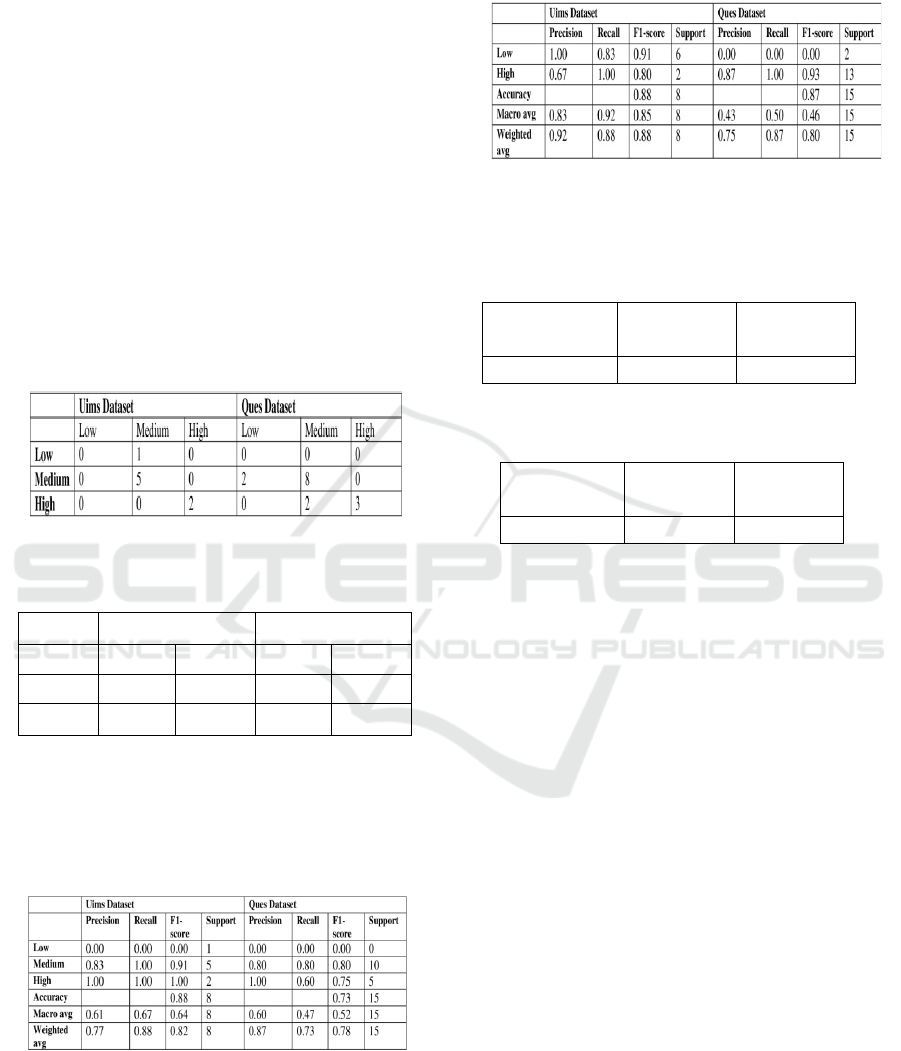
y_pred=km.predict(X_test). Table 5 presents
confusion matrix for 3 clusters of UIMS and QUES
dataset whereas Table 6 represents confusion matrix
for 2 clusters of the both datasets.
Table 5: Confusion matrix for 3 Clusters of UIMS and
QUES
Dataset
Table 6: Confusion matrix for 2 Clusters of UIMS and
QUES dataset
Uims dataset Ques dataset
Low High Low High
Low 5 1 0 2
High 0 2 0 13
Table 7 and Table 8 represent classification
reports for 3 clusters and 2 clusters respectively for
the both datasets.
Table 7: Classification Report for 3 Clusters of UIMS and
QUES dataset
Table 8: Classification Report for 2 Clusters of UIMS and
QUES dataset
Table 9 and Table 10 presents accuracy score for 3
and 2 clusters respectively for the both datasets.
Table 9: Accuracy Score for 3 Clusters of UIMS and
QUES dataset
Uims
dataset
Ques
dataset
Accuracy 0.875 0.73
Table 10: Accuracy Score for 2 Clusters of UIMS and
QUES dataset
Uims
dataset
Ques
dataset
Accuracy 0.875 0.87
5 RESULT ANALYSIS
In this section, we explained the results obtained in
previous section. Following are some observations:
For UIMS dataset for 3 clusters Table 7 reveals
that precision for predicting the high
maintainable classes is maximum and low
maintenance is minimum. Medium and high
maintainable classes have secured recall value
1. The maximum f1-score is for high maintained
class. Table 7 also shows the different
performance values of ques dataset for 3
clusters. Precision values are 1.00, 0.80 and
0.00 for high, medium and low maintainable
classes respectively. But recall and f1-score
values are maximum for medium maintainable
classes.
Table 8 depicts the classification reports for 2
clusters of uims and ques dataset. For uims
dataset, precision and f1-score are maximum for
low maintainable classes and recall value is
minimum for low maintainable class. For ques
dataset precision, recall, f1-score all 3 values are
0.87, 1.0, 0.93 that are maximum. It is seen
from Table 9 and 10 that accuracy is maximum
Classification and Prediction of High and Low Maintainable Class of Object Oriented Systems at Design Level using Machine Learning
Techniques
175

of uims dataset for 3 clusters and for 2 clusters
also.
6 CONCLUSIONS
We developed classification model to identify high
and low maintainable classes at the early stage of
development of Object Oriented Software System.
This model acts as a warning to software designer
about the quality of design of the proposed system.
Further this model is also used to reduce the cost of
maintenance of the proposed system.
FUTURE WORK
1. Principal Component Analysis can be used to
minimize attributes for both clustering model.
2. Classification techniques like decision tree, naïve
base and random forest can be used.
3. Other clustering techniques can be used.
4. Other big data sets are required and needed to
make specific comments in this research
direction.
5. Maintenance effort model can also be made.
REFERENCES
Andreas C. Miller and Sarah Guido, “Introduction to
Machine Learning with Python : A Guide for Data
Scientists”, O’REILLY
Manohar Swamynathan, “Mastering Machine Learning
with Python in Six Steps-A Practical Implementation
Guide to Predictive Data Analysts using Python”,
APRESS
Li W. and Henry S., “Object-Oriented Metrics that Predict
Maintaiability”, Journal Systems Software, 1993;
23:111-122.
Abdulrahman A. B. B., Mohammad A. and Zubair A. B.,
“Hybrid Intelligent Model for Software Maintenance
Prediction”, Proceedings of the World Congress on
Engineering 2013 Vol 1, WCE 2013, July 3-5, 2013,
London, U.K.
Kaur A., Kaur K., and Malhotra R., “Soft Computing
Approaches for Prediction of Software Maintenance
Effort”, International Journal of Computer
Applications, Volume 1, No. 16, 2010.
Marounek Petr, “Simplified approach to effort estimation
in software maintenance”, Journal of Systems
Integration 2012/3.
Ebert C. And Soubra H., “Functional Size Estimation
Technologies for Software Maintenance”, IEEE
Software, November/December 2014.
Ahn Y., Suh J., Kim S., and Kim H., “The Software
maintenance project effort estimation model based on
function points”, Journal of Software Maintenance and
Evolution : Research and Practice, 2003,15:71-85
Lucia A. D., Pompella E., and Stefanucci S. , “Assessing
Effort Prediction Models for Corrective Software
Maintenance : An Empirical Study”, Enterprise
Information Systems VI, 55-56, 2006.
Lucia A. D., Persico A., Pompella E. and Stefanucci S. ,
“Improving Corrective Maintenance Effort Prediction
: An Empirical Study”, Internet
Sheela G. A. S. And Aloysius A., “Maintenance Effort
Prediction Model Using Aspect-Oriented Cognitive
Complexity Metrics”, International Journal of
Advanced Research in Computer Science, Vol. 8, No.
8, September-October 2017.
Kaushik, S., Tiwari, S.: Soft Computing-Fundamentals,
Techniques and Applications, 1st edn. Mcgraw Hill
Education(India) Private Limited, India(2018).
Malviya A., “Machine Learning: An Overview of
Classification Techniques”, Springer book Series
(Algorithm for Intelligent System)- Computing
Algorithms with Applications in Engineering.
ICACSE 2021 - International Conference on Advanced Computing and Software Engineering
176
