
Analysis of DC-DC Sepic Converter with Different MPPT Technique
Ankur Kumar Gupta
1
, Yogesh K. Chauhan
2
, Rupendra Kumar Pachauri
3
, Deepa Sharma
4
, Rachna
Chaudhary
5
, Pankaj Kumar Gupta
5
1
R&D Department, SOCSA IIMT University, Meerut, UP, India
2
Electrical Department, KNIT Sultanpur, UP, India
3
Electrical and Electronics Engineering Department, University of Petroleum and Energy Studies, Dehradun, India
4
Dean Research, IIMT University, Meerut, UP, India
5
Computer science Department, IIMT University, MEERUT, UP, India
rachnacs1088@gmail.com, drpkg03@gmail.com
Keywords: DC- DC Converter, MPPT Converter, Constant Voltage Control, Perturb and Observation.
Abstract: In this research work the performance of the DC-DC converter has been evaluated with two techniques
Constant Voltage control (CVC) and Perturb and Observation (P&O) one by one. The power 456 Software
has been used for comparison purpose. The performance of the converter in case of P&O is found
satisfactory. The stress on the component is low in case of P&O. The circuit is able to run on the 80 percent
duty cycle. The DC-DC efficiency is 90.7 %. The efficiency of input filter is 89.9% has been recorded.
Which is higher than the CVC method. The overall performance is found satisfactory. The full irradiance of
1000 W/m2 has been assumed for this testing.
1 INTRODUCTION
Now a day’s low cost electricity is main requirement
of the industries as well as domestic use. Solar
energy promise for clean and green energy without
any noise. If the right direction has been tracked
then it will provide the maximum power to the load.
For this purpose the appropriate DC-DC converter
has been required with appropriate MPPT algorithm
(Kumar et al., 2015). There are so many converter in
the market which are used for this purpose. However
the proper tuning has been required to drive the
converter on maximum power point. There are so
many other factor which affects the performance of
the performance of the DC-DC converter (Mutoh
and Inoue, 2004). The behaviour of the DC-DC
converter is also affected by the type of the load.
The direct connection of the solar panel with the
battery not is preferable because the battery will get
damage and the other hand, the solar panel is unable
to drive on maximum power.
On the other hand, the different MPPT algorithm
are available which are use the DC-DC converter.
The main algorithms are perturb and observation,
constant voltage control, Incremental conductance,
constant current control. But all the algorithms
hastheir merits and demerits. The Perturb and
Observation is widely used due to its low
complexity. But the P&O algorithm unable to chase
the MPP under sudden change of irradiance (Gupta
et al., 2020; Gupta et al., 2018a; Pachauri and
Chauhan, 2015 ). However the Incremental
Conductance MPP technique provide the solution
for this problem and track the MPP even after the
sudden change in the irradiance (Gupta et al., 2016;
Liu et al., 2008a). On the other hand the Constant
Voltage Control method is the low cost solution to
achieve the MPP (Gupta et al., 2018b). But the
demerit of the CVC method is that it required to
update the open circuit voltage at particular interval
of time by disconnecting the load from the power
supply (Xiao and Dunford, 2004; Liu, 2008b). In
this research work, the performance of DC-DC
converter has been evaluated with the CVC
technique and Perturb Observation method.
However there are so many method to improve the
efficiency of DC-DC converter (Gupta et al., 2019).
Gupta, A., Chauhan, Y., Pachauri, R., Sharma, D., Chaudhary, R. and Gupta, P.
Analysis of DC-DC Sepic Converter with Different MPPT Technique.
DOI: 10.5220/0010562300003161
In Proceedings of the 3rd International Conference on Advanced Computing and Software Engineering (ICACSE 2021), pages 45-53
ISBN: 978-989-758-544-9
Copyright
c
2022 by SCITEPRESS – Science and Technology Publications, Lda. All rights reserved
45
2 ANALYSIS OF THE DC-DC
CONVERTER WITH
DIFFERENT ALGORITHM
For the analysis of the converter the power 456
software has been used. The input of the converter is
represent by the Table. 1. The input of the DC-DC
converter has been provided by the solar panel. The
CVC method and P&O method has been loaded in
the converter one by one.
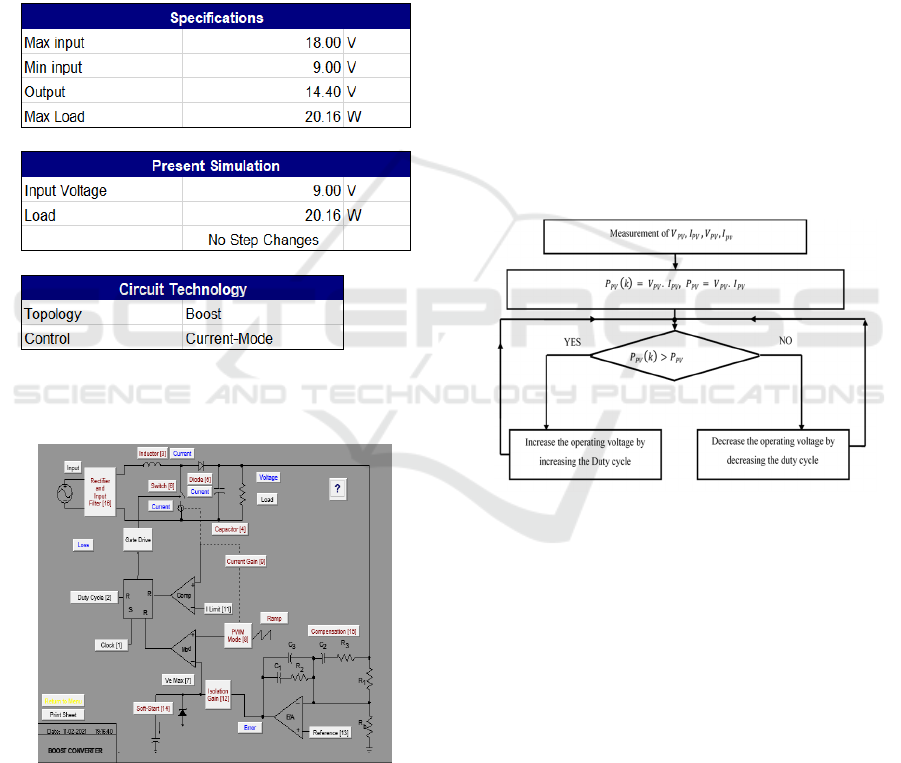
Table 1. Specification of the Input of DC-DC converter
The Table 1 provides the topology used for the
testing purpose. The control mode is the Current
mode which is shown in the Table 1.
Figure 1. Circuit Diagram of DC-DC Converter
The circuit diagram of DC-DC converter is shown in
Figure 1. The different type of control has provided
which has been discussed further. The comparator
has been used for current limit. The current limit
mode is required for battery charging purpose
because at the time of Bulk charging mode, the
battery try to consume the infinite current which
leads to permanent destroy the power supply. So, to
protect the power supply from high current demand,
the circuit operate on current limit mode. In this
mode the duly cycle is maximum. The maximum
current is 1.4 Amp for this operation. The minimum
current of current is 0.4 amp. On this current, the
circuit assume that the battery is full charge and do
not need further charging.
3 RESULTS AND DISCUSSION
The table 2 provide the different loses at the input
side when the DC-DC converter operates with P&O
technique. The equivalent series resistance is .085
Watt with the inductor conduction loss 0.136 Watt.
The power switch conduction loss is recorded as
0.259 Watt. Power Diode conduction loss is 0.739
Watt. The total conduction loss is 1.135 Watt and
the conduction efficiency is 94.66%.
Figure 2. Flow chart of P&O Method
The flow chart of P&O method is shown in figure 2.
First it will measure the Panel Current, Voltage and
compare it with the previous values and adjust the
duty cycle.
ICACSE 2021 - International Conference on Advanced Computing and Software Engineering
46
Table 2. Different type of losses in case of P&O Method
The table 3 provides the losses and efficiency when
the converter runs with P&O method.
Table 3. Converter loss and efficiency in case of P&O
Method
In this case the total conduction loss is 1.13
Watt. The stitching loss is 0.20 Watt. The core loss
is 0.04 watt. The total loss is 2.08 Watt. The DC-DC
efficiency is 90.7 %. The efficiency of input filter is
89.9% has been recorded.
Table 4. Characteristic of Power switch and Power Diode in case of P&O Method
Table.4 provide the details of Power switches and
power diode. The switch drop record 0.0 Volt.
However Switch R 0.080 Ω, Peak switch current
5.051 Amp, power dissipation 0.26 Watt, Peak
voltage stress 15 Volt, Nominal Voltage stress 14
Volt, per switch rms Current 1.80 Amp has been
recorded. On the other hand, the diode drop is
0.51Volt, diode ESR 0.003 Ω Peak diode current
0.000amp, Power dissipation across diode 0.738
Watt, Peak Voltage stress across diode 14.510 Volt,
Nominal Voltage stress 14.40 Volt, has been
recorded.
Table 5. Output component characteristics of component
in case of P&O Method
Table 5. Shows the value of equivalent series
resistance which is only 31.5 mΩ. The RMS current
is 1.66 Amp and the peak voltage is 14.5 Volt. The
dissipation is 0.09W has been recorded in case of
P&O method.
Analysis of DC-DC Sepic Converter with Different MPPT Technique
47
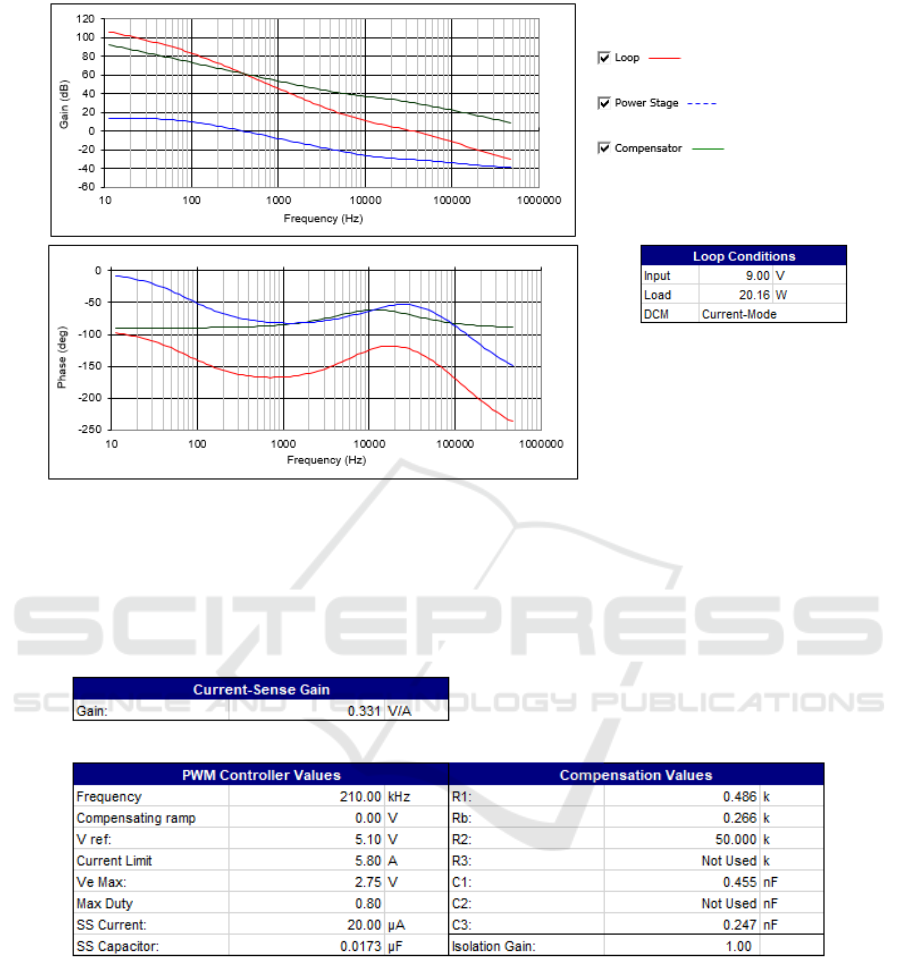
Figure. 3 Gain margin and Phase margin in case of P&O Method
The gain margin and phase margin are shown in
Figure 3. The Loop shows by red colour and the
power stage is shown by blue dotted line and
Compensator is shown by the
Black line. The loop is started by the 108 db. The
compensator starts 94 db and the power stage starts
from 18db. The Phase margin curve are also shown
in figure 2.
Table 6. Characteristic of PWM Controller and compensation values in case of P&O Method
Table 6.represent the condition of PWM
controller and compensation values when the
converter run on P&O. The max duty cycle is 80 %
in this condition.
ICACSE 2021 - International Conference on Advanced Computing and Software Engineering
48
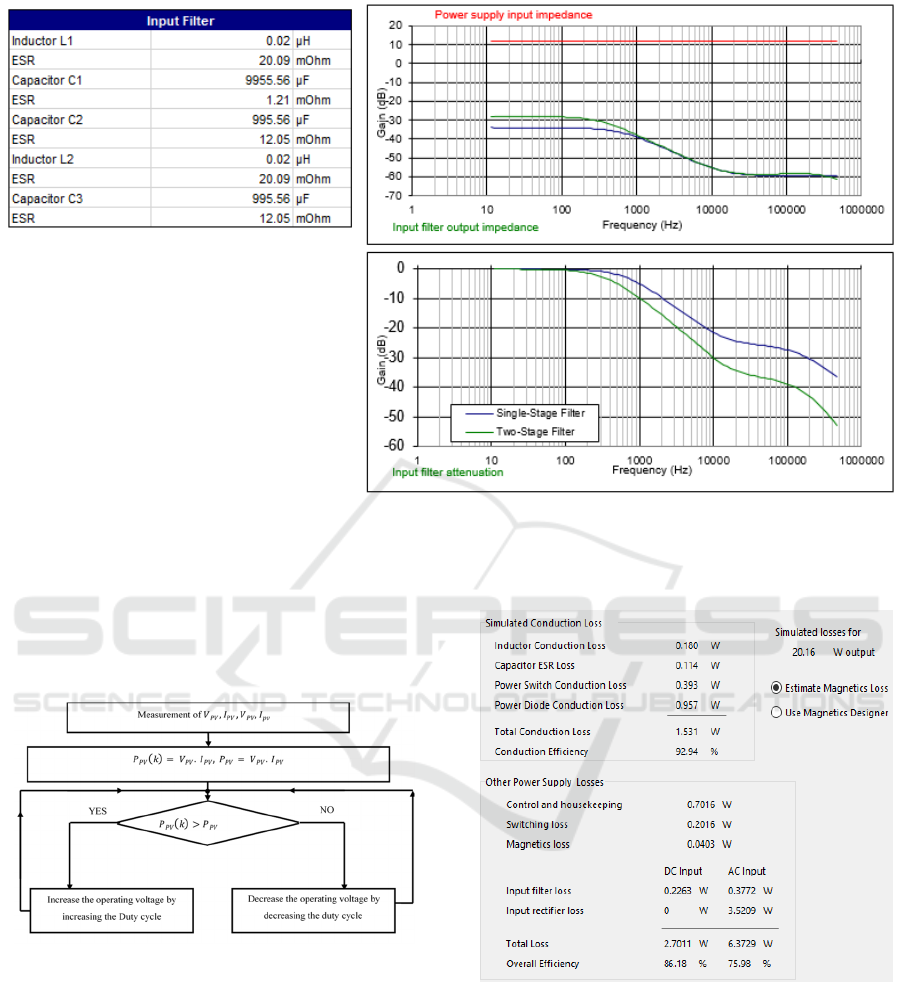
Figure. 4 Input filter characteristics, impedance and attenuation in case of P&O Method
The input filter characteristics, impedance and
attenuation in case of P&O methods are shown in
figure 4. The ESR of inductor L1 is 20.09m Ω, the
ESR of capacitor C1 is 2.21 m Ω. The ESR of C2 is
12.05 Ω. The ESR of L2 20.09 m Ω and the ESR of
capacitor C3 is 12.05 m Ω.
Figure 5 Flow chart of CVC Algorithm
The flow chart of CVC method is shown in
figure 5. The V max is 80 percent of the Voc. The
value of Voc is update at after every 60 minutes. In
after every 60 min the circuit disconnect from the
load to measure the Voc. This is the major
Drawback of this technique.
Table 5. Different type of losses in case of CVC Method
The table 5 provide the different loses at the
input side when the DC-DC converter operates with
CVC technique. The equivalent series resistance is
0.114 Watt with the inductor conduction loss 0.180
Watt. The power switch conduction loss is recorded
as 1.531Watt. Power Diode conduction loss is 0.957
Watt. The total conduction loss is 1.531 Watt and
the conduction efficiency is 92.94%.
Analysis of DC-DC Sepic Converter with Different MPPT Technique
49
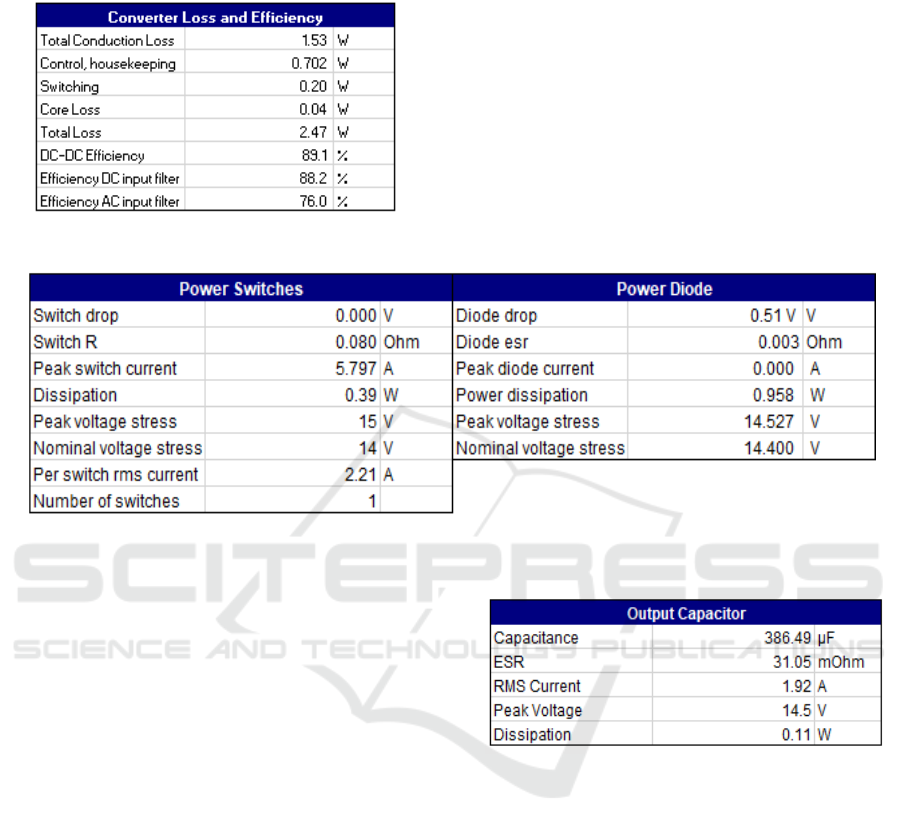
Table 7. Converter loss and efficiency in case of CVC
Method
The Table 7 provides the losses and efficiency when
the converter run with CVC method. In this case the
total conduction loss is 1.53 Watt. The switching
loss is 0.20 Watt. The core loss is 0.04 watt. The
total loss is 2.47 Watt. The DC-DC efficiency is
88.2 %. The efficiency of input filter is 76.0% has
been recorded.
Table 8. Characteristic of Power switch and Power Diode in case of CVC Method
Table. 8 provide the details of power switches
and power diode. The switch drop record 0.0 Volt.
However Switch R 0.080 Ω, Peak switch current
5.797 Amp, power dissipation 0.39 Watt, Peak
voltage stress 15 volt, Nominal Voltage stress 14
Volt, per switch rms Current 2.21 Amp has been
recorded. On the other hand, the diode drop is
0.51Volt, diode ESR 0.003 Ω Peak diode current
0.000 amp, Power dissipation across diode 0.958
Watt, Peak Voltage stress across diode 14.527 Volt,
Nominal Voltage stress 14.40 Volt, has been
recorded.
Table 9. Output component characteristics of component
in case of CVC Method
Table 9.Shows the value of equivalent series
resistance which is only 31.05 m Ω. The RMS
current is 1.92 Amp and the peak voltage is 14.5
Volt. The dissipation is 0.11W has been recorded in
case of CVC method.
ICACSE 2021 - International Conference on Advanced Computing and Software Engineering
50
Figure. 6 Gain margin and Phase margin in case of CVC Method
The gain margin and phase margin are shown in
Figure 6. The Loop shows by red colour and the
power stage is shown by blue dotted line and
Compensator is shown by the Black line. The loop is
started by the 100 db. The compensator starts 87 db
and the power stage starts from 17db. The Phase
margin curve are also shown in figure 4.
Table 10. Characteristic of PWM Controller and compensation values in case of CVC Method
Table 10. Represent the condition of PWM
controller and compensation values when the
converter run on CVC. The max duty cycle is 70 %
in this condition.
Analysis of DC-DC Sepic Converter with Different MPPT Technique
51
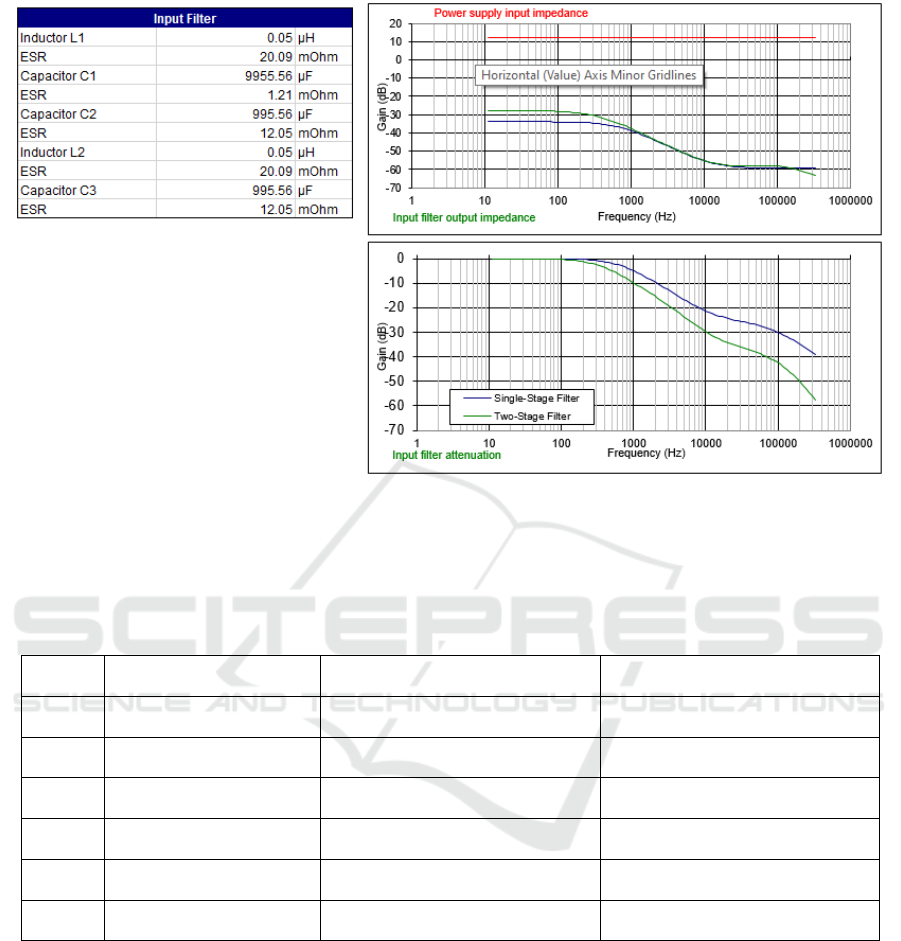
Figure. 7 Input filter characteristics, impedance and attenuation in case of CVC Method
The input filter characteristics, impedance and
attenuation in case of CVC methods are shown in
figure 7. The ESR of inductor L1 is 20.09m Ω, the
ESR of capacitor C1 is 2.21 m Ω. The ESR of C2 is
12.05 Ω. The ESR of L2 20.09 m Ω and the ESR of
capacitor C3 is 12.05 m Ω.
Table.11 Comparison of Different parameter of converter for P&O and CVC technique
S. No PARAMETER P&O CVC
1. Efficiency High LOW
2. Duty cycle 80% 70%
3. Diode stress Low High
4. Switching stress Low High
5. Gain margin GOOD BAD
6. Phase margin GOOD BAD
4 CONCLUSION
The different characteristics of the converter has
been recorded when drive it on the Different MPPT
one by one. The P&O provide the max duty cycle
and higher efficiency in comparison of CVC
method. P&O method offers minimum stress on the
components in comparison of P&O method. The
Overall performance of DC-DC converter is found
good in case of P&O. The gain margin and Phase
margin is also better in case of P&O method.
REFERENCES
Gupta, A., Chauhan, Y.K. and Pachauri, R.K. (2016). A
comparative investigation of maximum power point
tracking methods for solar PV system. Solar
energy, 136, 236-253.
ICACSE 2021 - International Conference on Advanced Computing and Software Engineering
52

Gupta, A.K., Chauhan, Y.K. & Maity, T. (2018a).
Experimental investigations and comparison of
various MPPT techniques for photovoltaic
system. Sādhanā, 43(8), 1-15.
Gupta, A.K., Chauhan, Y.K. and Maity, T. (2018b). A
new gamma scaling maximum power point tracking
method for solar photovoltaic panel Feeding energy
storage system. IETE Journal of Research, 1-21.
Gupta, A.K., Maity, T., Anandakumar, H. and Chauhan,
Y.K. (2020). An electromagnetic strategy to improve
the performance of PV panel under partial
shading. Computers & Electrical Engineering,
106896.
Gupta, V., Sharma, M., Pachauri, R.K. and Babu, K.D.
(2019). Comprehensive review on effect of dust on
solar photovoltaic system and mitigation
techniques. Solar Energy, 191, 596-622.
Kumar, P., Pachauri, R.K. and Chauhan, Y.K. (2015).
Duty ratio control schemes of DC-DC boost converter
integrated with solar PV system. In 2015 International
Conference on Energy Economics and Environment
(ICEEE), 1-6.
Liu, F., Duan, S., Liu, F., Liu, B. and Kang, Y. (2008a). A
variable step size INC MPPT method for PV
systems. IEEE Transactions on industrial
electronics, 55(7), 2622-2628.
Liu, F., Kang, Y., Zhang, Y. and Duan, S. (2008b).
Comparison of P&O and hill climbing MPPT methods
for grid-connected PV converter. In 2008 3rd IEEE
Conference on Industrial Electronics and
Applications, 804-807.
Mutoh, N., and Inoue, T. (2004). A controlling method for
charging photovoltaic generation power obtained by a
MPPT control method to series connected ultraelectric
double layer capacitors. In Conference 2004 IEEE
Industry Applications Conference, 39th IAS Annual
Meeting, 4, 2264-2271.
Pachauri, R.K. and Chauhan, Y.K. (2015). Comparative
Study of MPPT Methods for Solar PV Driven
Induction Motor Load. International Journal of
Computer Applications, 975, 8887.
Xiao, W. and Dunford, W.G., (2004). A modified adaptive
hill climbing MPPT method for photovoltaic power
systems. In 2004 IEEE 35th annual power electronics
specialists conference IEEE Cat. No. 04CH37551), 3,
1957-1963.
Analysis of DC-DC Sepic Converter with Different MPPT Technique
53
