
Trace Recovery: Inferring Fine-grained Trace of Energy Data from
Aggregates
Nazim Uddin Sheikh
1 a
, Zhigang Lu
1 b
, Hassan Jameel Asghar
12 c
and Mohamed Ali Kaafar
1 d
1
Department of Computing, Macquarie University, Sydney, Australia
2
Data61, CSIRO, Sydney, Australia
Keywords:
Inference Attacks, Aggregate Statistics, Differential Privacy, Energy Data Privacy, Smart Meter Privacy.
Abstract:
Smart meter data is collected and shared with different stakeholders involved in a smart grid ecosystem. The
fine-grained energy data is extremely useful for grid operations and maintenance, monitoring and for market
segmentation purposes. However, sharing and releasing fine-grained energy data induces explicit violations
of private information of consumers (Molina-Markham et al., 2010). Service providers do then share and
release aggregated statistics to preserve the privacy of consumers with data aggregation aiming at reducing
the risks of individual consumption traces being revealed. In this paper, we show that an adversary can
reconstruct individual traces of energy data by exploiting consistency (similar consumption patterns over time)
and distinctiveness (one household’s energy consumption pattern is significantly different from that of others)
properties of individual consumption load patterns. We propose an unsupervised attack framework to recover
hourly energy consumption time-series of individual users without any prior knowledge. We pose the problem
of assigning aggregated energy consumption meter readings to individuals as an assignment problem and solve
it by the Hungarian algorithm (Xu et al., 2017; Kuhn, 1955). Using two real-world datasets, our empirical
evaluations show that an adversary is capable of recovering over 70% of households’ energy consumption
patterns with over 90% accuracy.
1 INTRODUCTION
Smart meters, an integral component of metering in-
frastructures in smart grids, have been widely de-
ployed in homes around the world. Smart meter con-
sumption measurements are used for monitoring, op-
erations and management of grids (Knirsch et al.,
2016). Individual household smart meter data is ag-
gregated into a cluster (e.g., from the same neighbour-
hood) and communicated to the energy providers over
a secure channel for the purposes of demand fore-
casting and analytics without compromising the pri-
vacy of individual households (Sankar et al., 2012;
Erkin and Tsudik, 2012). Many mechanisms based
on such secure aggregation have been proposed to
protect the privacy of consumers (Buescher et al.,
2017). Although aggregation itself is cryptographi-
cally protected, the electricity providers have access
a
https://orcid.org/0000-0002-6565-9880
b
https://orcid.org/0000-0001-5102-6217
c
https://orcid.org/0000-0001-6168-6497
d
https://orcid.org/0000-0003-2714-0276
to the decrypted aggregated form of energy consump-
tion over a cluster (group) of households (Buescher
et al., 2017).
Due to the nature of smart meter data, two types of
aggregations can be performed: temporal and/or spa-
tial. Temporal aggregation is one of the most naive
forms of data aggregation and is performed over a
long period of time, for example, monthly or quar-
terly (Dong et al., 2016). The aggregated monthly
or quarterly consumption of individual households is
performed for billing purposes. On the other hand,
in spatial aggregation (Dong et al., 2016) multiple
households’ load patterns are combined together into
a cluster in order to mask individual consumption pat-
terns to prevent information leakage (Farokhi, 2020).
This aggregated form of individual consumption
data can be shared with other stakeholders (e.g., re-
tailers and marketing companies) (Liu et al., 2018) or
can be released publicly to benefit businesses and re-
search, with assumption that aggregated statistics of
individual households’ energy consumption data, do
not infringe the privacy of customers. However, this
assumption on aggregation providing enough privacy
Sheikh, N., Lu, Z., Asghar, H. and Kaafar, M.
Trace Recovery: Inferring Fine-grained Trace of Energy Data from Aggregates.
DOI: 10.5220/0010560302830294
In Proceedings of the 18th International Conference on Security and Cryptography (SECRYPT 2021), pages 283-294
ISBN: 978-989-758-524-1
Copyright
c
2021 by SCITEPRESS – Science and Technology Publications, Lda. All rights reserved
283

requires further exploration. In this paper, we show
an attack where an adversary (e.g., curious service
provider, a third-party stakeholder or an external ma-
licious entity) is capable of recovering fine-grained
energy consumption traces of individual customers
through having access to the aggregated statistics of
energy consumption time-series data. The essential
elements of our attack are based on the attack from
Xu et al. (Xu et al., 2017) on de-aggregating user lo-
cation traces from aggregated mobility traces, and a
similar argument is often used about privacy via ag-
gregation.
In essence, we show that an attacker can infringe
the privacy of individuals by exploiting two key
attributes of their load patterns. First, the load pattern
of a household is consistent, which makes their load
pattern highly predictable. Second, the load pattern
of each household can be uniquely distinguished
from each other with high probability. Combining
the two observations, we could split the aggregated
energy data to different traces of energy consumption
iteratively (by the first observation), then link the
recovered traces to most of the individual households
(by the second observation).
Contributions. In this paper, we aim to quantitatively
investigate the privacy implications of releasing ag-
gregated statistics of smart meter energy consumption
data of individual customers without any prior knowl-
edge. Our contributions are as follows:
• We construct an unsupervised adversarial model
based on aggregated statistics of energy consump-
tion data. The adversarial framework does not re-
quire any background information about the in-
dividuals to reconstruct their fine-grained energy
consumption records from aggregates. The ad-
versary exploits the consistency and distinctive-
ness property in day-to-day energy consumption
load patterns. Then we present the problem as
a mathematical balanced assignment problem and
construct cost matrices (Xu et al., 2017) based
on expected energy consumption change at each
time step. Our quantitative analysis shows that
the households’ consumption patterns are simi-
lar over time and most of them are different from
each other. We compute expected energy con-
sumption changes from one time step to another,
which help to estimate energy consumption in the
next time steps and formulate a cost matrix to
optimise the assignment of households to energy
consumption traces (see Section 4).
• We use two real-world smart meter reading
datasets to empirically evaluate the adversary’s
capability to reconstruct individual users’ fine-
grained energy usage load patterns. We show that
the adversary recovers energy consumption pat-
terns with high accuracy (between 80% and 95%)
averaged over all target households and the en-
tire time period. We observe that 70% of house-
holds’ load patterns can be inferred from aggre-
gated statistics with an accuracy over 90%. Fi-
nally, we show that the adversary recovers 60%
of households’ energy consumption by incurring
a 0.4 kWh or less error from the actual (ground
truth) consumption traces.
A key feature of our attack on aggregated en-
ergy data is that it does not rely on any background
knowledge of any individual household’s consump-
tion. This is unlike other attacks on smart-meter ag-
gregation, for example, (Buescher et al., 2017), as de-
tailed in the next section.
The rest of the paper is organised as follows. In
Section 2 we review the state-of-the-art of privacy re-
lated issues in energy data and possible solutions to
safeguard the privacy of customers. Then we explain
the background of the threat model for recovering en-
ergy consumption traces in Section 3. In Section 4,
we discuss key features of two real-world datasets
that are used to evaluate the performance of the ad-
versary. Further, we analyse the feasibility of pri-
vacy breach using two key concepts: consistency and
distinctiveness. In Section 5, we propose the attack
framework and inference strategies based on our ob-
servations discussed in Section 4. We then demon-
strate the experimental configurations and analyse the
performance of the adversary using two different met-
rics in Section 6. Finally, conclude the paper by dis-
cussing our key findings and future work in Section 7
2 RELATED WORK
In this section, we review some related work pertain-
ing to privacy preserving energy data analytics, issues
in energy data sharing with third-parties, releasing
aggregated data, adversarial models and privacy en-
hancing technologies that are widely used to protect
the privacy of individuals while leveraging aggregated
data analytics.
Privacy Preserving Data Analytics: A massive
amount of energy consumption data from millions
of households and generated on a daily basis is be-
ing collected and shared with third-parties and differ-
ent stakeholders involved in the smart meter ecosys-
tem (Yang et al., 2014). Smart meter data analytics
involve descriptive, predictive (Habtemariam et al.,
2016) and prescriptive analyses, it also includes many
critical applications, such as as load analysis, load
SECRYPT 2021 - 18th International Conference on Security and Cryptography
284

forecasting and load management (Wang et al., 2018).
The main objective of privacy friendly data analytics
is to safeguard the users (households) from private in-
formation leakage while leveraging the utility of the
data (Shateri et al., 2019). Many other schemes have
been proposed to facilitate privacy preserving data
collection, sharing and analytics (Makhdoom et al.,
2020). Sirojan et al. (Sirojan et al., 2019) envisaged
an edge computing based architecture to provide a va-
riety of energy data analytic services such as event de-
tection, down-sampling and load identification, how-
ever, this architecture does not guarantee the privacy
of user specific sensitive data. Cloud based hierar-
chical architectures are conceived as facilitating ac-
cess control mechanisms that help manage to share
and analyse data while keeping sensitive information
hidden (Lee et al., 2017). Shateri et al. (Shateri et al.,
2019) studied the privacy-utility tradeoff in privacy
preserving energy data analytics using an information
theoretic approach. Chen et al. (Chen et al., 2018)
reviewed some learning based methods that leverage
efficient privacy-aware energy data analytics. Wen et
al. (Wen et al., 2013) proposed a privacy preserving
query-based cloud server model for encrypted con-
sumption data.
Non-Intrusive Load Monitoring: A myriad of
study has been conducted on how fine-grained energy
consumption data can reveal an enormous amount
of private information about individual households.
Non-intrusive load monitoring (NILM) has been a
prolific research area in the last decade. NILM has
shown that the individual appliance specific energy
consumption can be separated from the load pattern of
a household using different statistical methods (Her-
rero et al., 2017; Zhang et al., 2019) and deep learning
algorithms (Kelly and Knottenbelt, 2015). Therefore,
information about personal activities can be discov-
ered from their electricity consumption patterns. This
constitutes a severe privacy threat to individual con-
sumers (Reinhardt et al., 2015). Note that, NILM
is successful only if an adversary has access to the
load patterns of individual consumers. All the afore-
mentioned studies rely on individual households’ en-
ergy consumption time-series data to retrieve appli-
ance specific consumption or to derive appliances’
ON/OFF states at different point of time. However,
in this paper, we attempt to recover each individual
household’s fine-grained energy consumption traces
from an aggregate, which is the combination of a clus-
ter (group) of households’ energy consumption time-
series data without relying on any prior knowledge
and/or access to individual’s load patterns.
Privacy of Aggregation Models: Aggregation is
widely used to safeguard the privacy of individ-
ual households by masking the individual specific
consumption (Farokhi, 2020). More generally, two
types of privacy preserving aggregation methods ex-
ist in the literature: many solutions rely on trusted
third-party based services using cryptographic proto-
cols (e.g., homomorphic encryption) (Efthymiou and
Kalogridis, 2010; Abdallah and Shen, 2016; Vahedi
et al., 2017) and decentralised techniques, relying on
blockchain technology (Habtemariam et al., 2016; Xu
et al., 2020). Hong et al. (Hong et al., 2017) pro-
posed a streaming algorithm that safeguards the im-
plications of information leakage from the readings of
a meter on the state of a specific appliance. A study
by an industrial body suggests that aggregation of
two load patterns of two different households is suf-
ficient to protect the privacy of individuals in aggre-
gated data (ENA-Report, 2015). However, this study
was revisited and its findings disputed in (Buescher
et al., 2017), which shows that individuals in an ag-
gregate of size two are distinguishable with high ac-
curacy. Moreover, Buescher et al. (Buescher et al.,
2017) demonstrated the risk of being distinguishable
for different size of aggregates. However, one of the
limitations of this distinguishability attack model is
that the adversary knows the load profiles contained in
the aggregate and past consumption records of all ag-
gregators (Buescher et al., 2017). The key difference
between our attack model and the work in (Buescher
et al., 2017) is that our attack model does not rely on
any prior knowledge about the individual energy con-
sumption records.
Our work has been inspired by (Xu et al., 2017)
that recovers individuals mobility data (trajectories)
by exploiting consistency and distinctiveness features
of mobility patterns of users. Authors posed and ver-
ified that most mobile users follow explicit moving
patterns, with little mobility during night time and
stable (and hence predictable) mobility patterns dur-
ing daytime. In (Xu et al., 2017), Xu et al. con-
sidered that during day time users’ velocities are uni-
form which may not be a realistic assumption. While
our work on Energy data consumption is different, we
additionally took into consideration changes in con-
sumption (analogous to speed or velocity in mobility
data) from one time window to the next over the entire
population.
3 BACKGROUND AND THREAT
MODEL
In this section we define the notation that will be used
throughout the paper, and precisely describe the threat
model behind energy consumption data recovery.
Trace Recovery: Inferring Fine-grained Trace of Energy Data from Aggregates
285

3.1 Notation
The energy reading of household i by a smart meter
at time step t ∈ N is denoted by x
(t)
i
.
1
Energy data
of household i over horizon T (i.e., T time steps) is
represented as a time-series, and denoted by the T -
element vector x
i
, whose t-th element is x
(t)
i
.
The aggregate (sum) consumption of n number of
households over a time period T , defined as a set of
one or more time steps, is given by
x
agg
=
"
n
∑
i=1
x
(1)
i
,
n
∑
i=1
x
(2)
i
, . . . ,
n
∑
i=1
x
(T )
i
#
(1)
The notations used throughout the paper are sum-
marised in Table 1.
Table 1: Notation.
Symbol Description
A Adversary
B Bucket of energy
∆B = e Size of a bucket
ˆ
B Estimated/predicted bucket of energy
C Cost Matrix
c
(t)
i j
Cost of i
th
household at j
th
bucket at time t
∆
(t)
Expectation of energy consumption change at time t
k Total number of buckets
n Total number of households
T Overall time period
X Decision Matrix
x
(t)
i j
Value of i
th
household at j
th
bucket at time t
x Vector of actual energy consumption traces
3.2 Energy Trace Recovery: Threat
Model
We now describe an adversary (A ) who wishes to re-
construct fine-grained energy consumption patterns of
individual households from aggregate statistics. First,
the adversary A accumulates aggregated statistics of
n number of households in a neighbourhood over T
period of time from a publicly released aggregated
dataset or through querying a database via a user in-
terface. The queries to the database may include but
not be limited to the following: (i) What are the max-
imum and minimum consumption in kWh in a neigh-
bourhood at each time step t over the horizon of time
T ?, (ii) How many households consume x kWh of
energy at a specific time of a day?, (iii) How many
households’ consumption is in a given range of en-
ergy (e.g., how many households’ energy consump-
tion is between 0 and 1 kWh at time t) and (iv) How
1
In general, time steps t and t + 1 represent consecutive,
potentially equally-spaced, times. In this paper, they repre-
sent hours.
many households’ electricity usage increases or de-
creases at different hourly of a day and how much?.
There could be many other possible queries which are
beyond the scope of this paper.
The adversary A then analyses the aggregated
statistics to construct an attack strategy that helps re-
construct the energy consumption patterns of individ-
ual households. A key consideration here is that the
adversary might not be able to reconstruct the energy
consumption of each household at very fine granular-
ity levels. This is due to the fact that even though the
energy consumption of a household may show simi-
lar trends over time, these trends are not expected to
be precisely the same due to small fluctuations in en-
ergy consumption. We therefore propose the idea of
energy consumption within buckets. More precisely,
given the answers to the above queries, adversary A
divides the energy consumption at each time step into
different equal sized intervals (semi-closed) which are
defined as buckets throughout the paper. The idea of
bucket describes the granularity of users in each in-
terval of energy consumption at every time step over
the horizon T . For instance, at each hour during the
night-time most households consume between 0.50
kWh and 1 kWh (i.e., (0.5, 1]), so we state that most
of the users’ consumption is taken place from B
1
and
when households are on holidays, they do not con-
sume any electricity, thus we state that during that pe-
riod of time energy consumption took place from B
0
.
Energy Buckets. Formally, we illustrate the con-
cept of bucket as follows. A bucket of energy con-
sumption is denoted by B and value of each bucket
represents a half-open interval (i.e., energy consump-
tion range in kWh), where the interval size, i.e.,
bucket size, is denoted by ∆B = e. We denote buck-
ets by B
0
= [0], B
1
= (0, e], B
2
= (e, 2e], B
3
= (2e, 3e]
and so on, and we try different bucket sizes to test the
attacker’s accuracy. We say a household is in a bucket
B
i
at time t if the household’s energy consumption
falls into the interval of B
i
. Note that when a user
does not consume any electricity at a specific time of
a day this falls under bucket B
0
. We have considered
a bucket with 0 consumption because an adversary
could be interested to know when her target home is
not occupied.
4 DATASET AND FEASIBILITY
OF PRIVACY BREACH
In this section, we first explain the datasets which are
used to evaluate the performance of the adversary A ,
then show the key features behind the load patterns of
households energy consumption.
SECRYPT 2021 - 18th International Conference on Security and Cryptography
286
4.1 Data
We use two real-world datasets that capture the fine-
grained (i.e., “disaggregated”) energy consumption
(time-series) records of households: the UK Power
Networks (London Dataset)
2
and Ausgrid house-
holds dataset
3
. We then aggregate these datasets
to perform analyses and attacks on them. The
actual-“disaggregated”-datasets serve as ground truth
against the estimated consumption data.
These publicly available datasets contain different
numbers of households with a variety of smart-meter
reading frequencies over various periods of time. We
use these datasets primarily because of their different
characteristics, such as different meter-reading reso-
lutions, geographic locations of the households, time
periods and number of households. Note that the ac-
tual datasets contain more households over a greater
period of time. We discarded the rest as they are in-
consistent or incomplete. A brief summary of the
datasets, which were used in our evaluation, is pre-
sented in Table 2.
4.2 Consistency and Distinctiveness
Properties of Energy Consumption
By performing analysis on the raw (find-grained,
dis-aggregated) data for both London and Ausgrid
datasets, we argue that each household follows a
consistent energy consumption pattern and hence the
households can be uniquely distinguished with a high
probability.
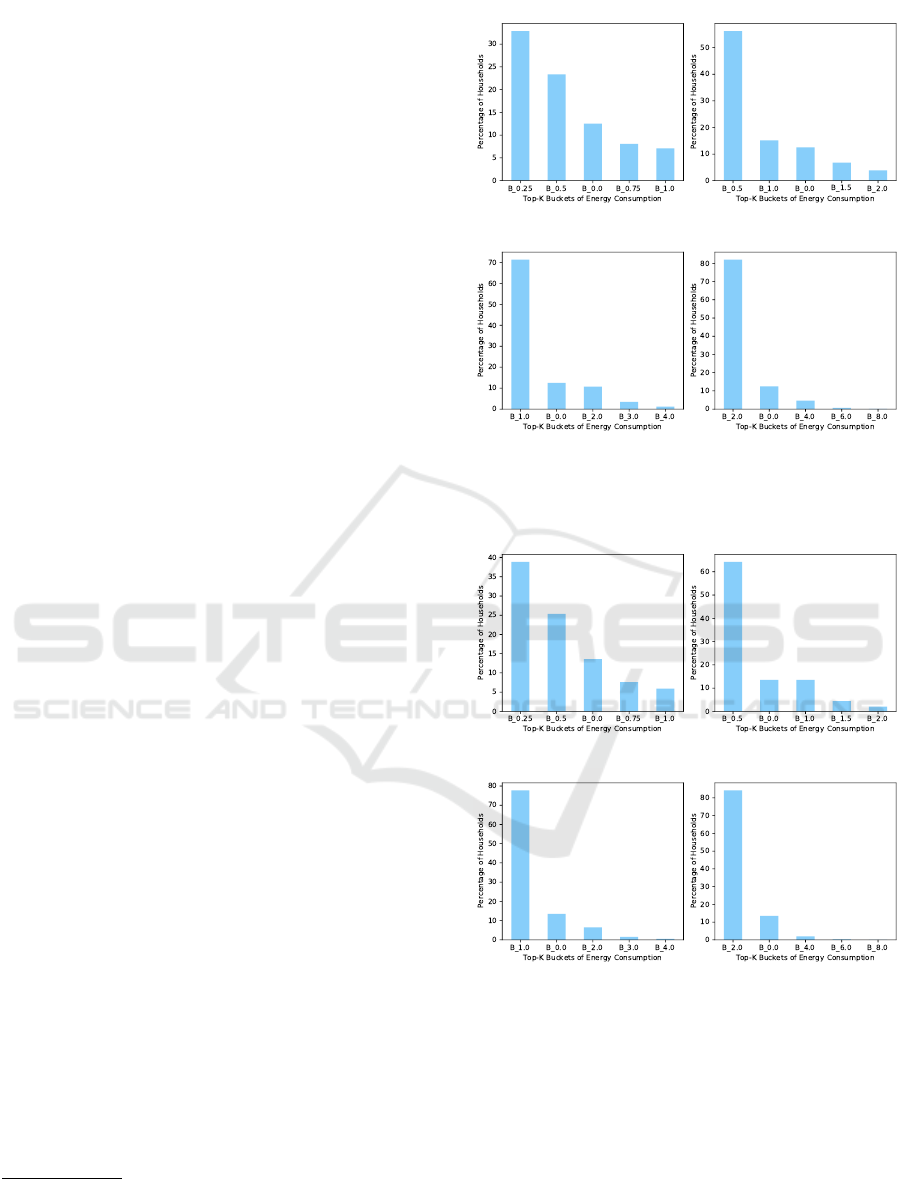
To comprehensively understand the consistency of
energy consumption patterns of all households over
the entire period of time, we study the percentage of
households that consume energy from Top-5 buckets
over four sizes of buckets in {0.25, 0.5, 1.0, 2.0} for
both datasets. Figure 1 shows the results in the Aus-
grid dataset. We observe that the percentage of house-
holds that consume from the top buckets increases
with the increase of bucket size. When the bucket
size is 0.25, around 40% and 25% of households con-
sumer energy from Top-1 and Top-2 buckets, respec-
tively. Furthermore, we observed over 12% of house-
holds’ consumption is from Top-3 bucket. Note that
number of buckets and the hourly/daily/monthly max-
imum value of the buckets are varying over the popu-
lation and the entire time period.
Doubling the bucket size to 0.5 and 1.0, around
60% and 70% of households’ energy consumption
2
https://data.london.gov.uk/dataset/
smartmeter-energy-use-data-in-london-households
3
https://data.gov.au/data/dataset/
smart-grid-smart-city-customer-trial-data
(a) Bucket size=0.25 (b) Bucket size=0.50
(c) Bucket size=1.0 (d) Bucket size=2.0
Figure 1: The percentage of households that consume en-
ergy from top buckets for four different size of buckets over
the period of one year in Ausgrid dataset.
(a) Bucket size=0.25 (b) Bucket size=0.50
(c) Bucket size=1.0 (d) Bucket size=2.0
Figure 2: The percentage of households that consume en-
ergy from top buckets for four different size of buckets over
the period of one year in London dataset.
remains in Top-1 buckets respectively. Increasing
the bucket size to 2.0, over 90% of the households
consume energy from Top-2 buckets. We also ob-
serve similar pattern in consuming energy in London
dataset (see Figure 2).
Observations from both the datasets suggest that
most of the households tend to consume from the
same (top) buckets consistently. Thus, the consump-
Trace Recovery: Inferring Fine-grained Trace of Energy Data from Aggregates
287
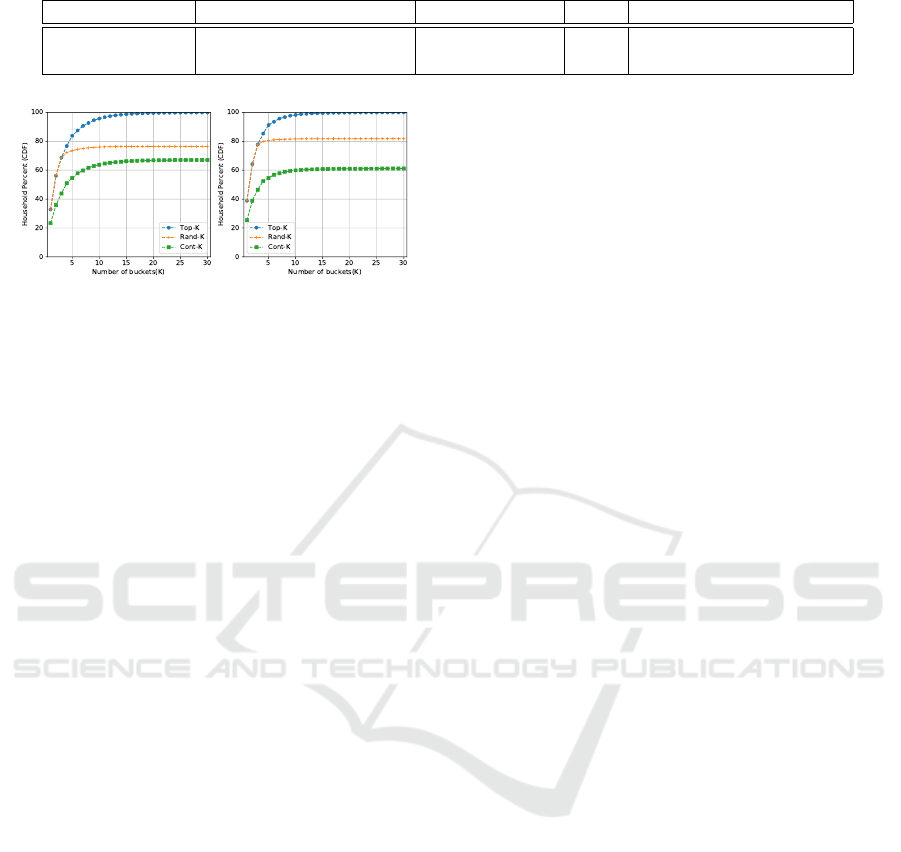
Table 2: Some features of the datasets used in the experiments are summarised.
Dataset Number of Households Location Year Meter Reading Interval
London Dataset 4681 London, UK 2013 30 min
Ausgrid Dataset 6981 NSW, Australia 2013 30 min
(a) Ausgrid Dataset (b) London Dataset
Figure 3: The percentage of households that can be distin-
guished by K buckets of energy consumption for the bucket
size 0.25.
tion patterns are highly consistent. Note that with the
increase of bucket size, the top buckets are accommo-
dating more users as the buckets include more coarse-
grained meter readings within their boundaries.
To evaluate the distinctiveness of households’ en-
ergy consumption patterns, we first generate a vec-
tor containing K energy consumption buckets, then
investigate the percentage of households not sharing
the same given buckets vector. We use three dif-
ferent strategies to obtain the buckets vector, that
is, selecting the Top-K frequently used buckets by
the households (Top-K), randomly selecting K buck-
ets belonging to the households’ energy consump-
tion patterns (Rand-K) and randomly selecting K con-
secutive buckets (Cont-K). Under these three strate-
gies, we show the percentage of (consumption pat-
terns of) households that can be distinguished from
other households by the selected patterns in Figure 3.
In the Ausgrid dataset (Figure 3a), we observe
that within the Top-5 buckets 80% of households have
unique Top-5 energy consumption buckets. Whereas
a smaller number of households (73% and 55%) can
be distinguished from Rand-5 and Cont-5 buckets re-
spectively. Further, considering the Top-15 buckets,
almost all households can be distinguished. How-
ever, only 55% and 70% of households can be dis-
tinguished when we consider Rand-15 and Cont-15
buckets. Similar observations are observed in the
London household dataset (Figure 3b).
The above results quantitatively show that the en-
ergy consumption patterns of households are consis-
tent and distinct. This finding helps us construct an
attack model to reconstruct the consumption patterns
of individual households.
4.3 Capturing Energy Consumption
Speed
Since we know that the energy consumption of house-
holds are consistent and distinct, in this section, we
study the energy consumption speed. Prior to show-
ing the results of consumption speed, we first show
that the energy consumption speed is also stable over
the whole time period.
Figure 4 depicts the average percentage of time
when the households consume from Top-20 buckets
at different hour of a day in the Ausgrid dataset.
The top left figure in Figure 4 reports that the per-
centage of time that the households consume energy
from top buckets during the night-time (i.e., 12:00 am
- 6:00 am). We observe that over 80% and 90% of
the time households consume electricity from Top-3
buckets and Top-5 buckets respectively. We also ob-
serve that almost 100% of the time Ausgrid house-
holds’ consumption patterns revolve within Top-10
energy buckets. The figures show that energy con-
sumption over six consecutive hours (from 12 am - to
5 am) were quite consistent. These observations are
presumably due to the natural sleeping cycles, energy
consumption patterns of households remains consis-
tent during night-time in the Ausgrid dataset.
The top right figure in Figure 4 shows the percent-
age of time that the households consume energy from
top buckets in the morning (i.e., 6am - 12 am). We
observe that over 80% of the time households’ energy
consumption occurred from top-5 buckets. Moreover,
over 95% of the time energy is consumed from Top-
10 buckets from 7 am to 11 am. Interestingly, the con-
sumption patterns during this time interval are quite
uniform. Further, the consumption patterns in the
morning are more diverse than that in the night-time.
The bottom left figure in Figure 4 illustrates the
cumulative percentage of households consumption
duration from each of the frequently used buckets.
Top-5 and Top-10 buckets are used by the households
over 80% of the time for the first consecutive 4 hours,
whereas the rest of the time energy consumption pat-
terns are somewhat more diverse. During this 3-hour
period in the afternoon, however, energy consumption
remains very consistent (i.e., households consume a
constant amount of energy from 12 pm to 3 pm), and
this is similar to the trend from 7 am to 11 am. This
could reflect the fact that usually people tend to go to
SECRYPT 2021 - 18th International Conference on Security and Cryptography
288
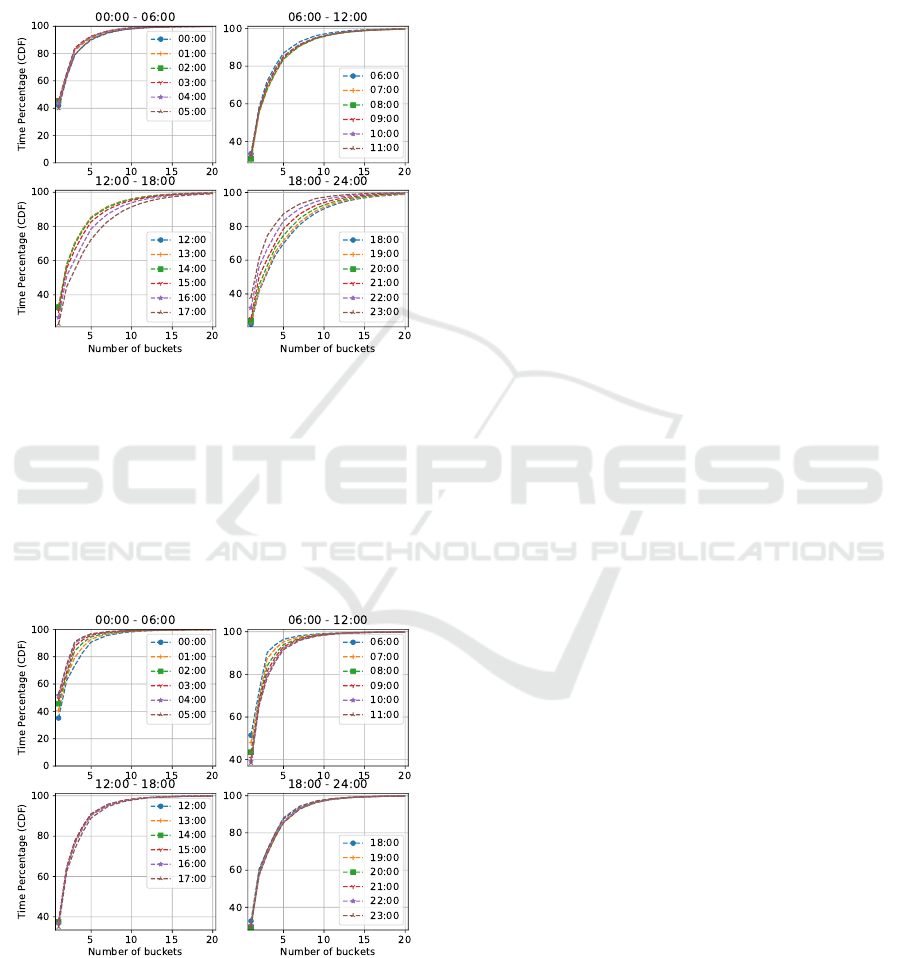
their workplace during the day-time.
The consumption patterns in the evening are much
more diverse though it keeps increasing until mid-
night (see bottom right figure in Figure 4). Then, the
usage time of the top buckets decreases as people tend
to go to bed, which reduces the use of energy.
Figure 4: Percentage of time (on an average) a household
uses top buckets of energy where bucket size is 0.25, over
the entire period of time in Ausgrid dataset.
Similarly, in the London dataset (see Figure 5),
the average percentages of time when the house-
holds consume the top buckets of energy also remains
steady. Households usually consume from Top-5
buckets over a whole natural day. Although the spe-
cific consumption pattern is quite different than that
of in the Ausgrid dataset.
Figure 5: Percentage of time (on an average) a household
uses top buckets of energy where bucket size is 0.25, over
the entire period of time in London dataset.
We now demonstrate how different households’
energy consumption varies from one time step to an-
other. We show the results for 2 consecutive hours
of a day using the London dataset. Figure 6 depicts
what percentage of households fall in which range of
energy consumption variation (increase or decrease)
from one time step to the next. For example, we ob-
serve that at Hour-1, we see around a 10% increase in
the percentage of households that showed an increase
by 0 − 10% of their energy consumption than its pre-
vious time step. Moreover, at Hour-2, we observe that
most of the households’ (around 60%) energy con-
sumption showed an increase by 0 − 10%.
Note that the negative percentage change refers to
decrease in percentage. Based on such an observa-
tion, we calculate the expected energy consumption
speed for each given bucket. The detailed calculation
given in the next section.
To conclude, all of the aforementioned observa-
tions indicate that from the aggregated dataset, we
could take advantage of the consistence, distinctive-
ness and expected energy consumption speed to re-
cover the energy consumption traces of the individual
households.
5 UNSUPERVISED ATTACK
MODEL
In this section, we present our unsupervised attack
model for individual energy consumption recovery
from an aggregated dataset.
5.1 Overview
We consider a realistic scenario (Buescher et al.,
2017) where a data curator releases time-series en-
ergy consumption data aggregated from a set of n
households over a time period T . To recover the
trace of individual energy consumption over the entire
time period, we extract individual energy consump-
tion from the aggregated data time by time. In gen-
eral, once given a bucket size, we can assign the ag-
gregated data to different buckets. The salient point
here is that at a single moment, one bucket contains
only one household. Formally, we can derive the en-
ergy consumption buckets B
(t)
= [B
(t)
1
, B
(t)
2
, . . . , B
(t)
k
] at
time step t with k buckets. Recovering a consumer’s
energy usage load pattern is equivalent to associating
anonymised buckets that are consumed by the same
consumer across different time slots. We now explain
how to identify the energy consumption buckets that
can be linked to the same load pattern of a household.
To address this problem, we propose an unsu-
pervised attack model inspired by the work in (Xu
et al., 2017) that iteratively associates the same house-
Trace Recovery: Inferring Fine-grained Trace of Energy Data from Aggregates
289
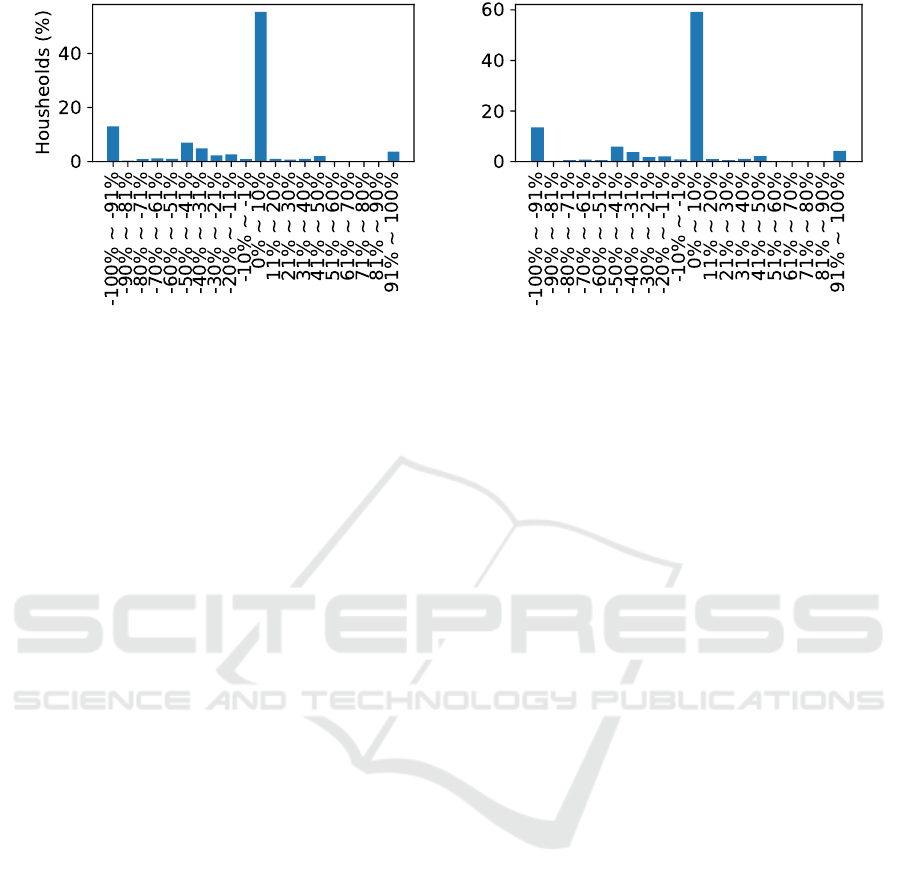
(a) Hour-1 (b) Hour-2
Figure 6: Percentage of households in each threshold (i.e., the energy consumption variation in percentage in the given ranges)
of energy consumption change at consecutive two hours of a day in London dataset.
holds’ load patterns from its following time steps, and
the adversary then recovers the entire load patterns
(by linking consumption buckets). At each point in
time, the adversarial method can be divided into two
steps. First, we estimate the likelihood of the next
energy consumption bucket that belongs to a given
load pattern by exploiting the characteristics of house-
hold energy consumption patterns. Second, we derive
an optimal solution to link households’ energy con-
sumption buckets with the next consumption bucket
which maximises the overall likelihood. We first
discuss how we can estimate an optimal association
between recovered and actual energy consumption
traces through having access to the estimated likeli-
hood.
We define the cost matrix at time t as C
(t)
=
{c
(t)
i, j
}
k×k
, where c
i, j
corresponds to the inverse of
likelihood of connecting a load pattern of household
i to the next consumption bucket B
(t+1)
j
. The load
pattern reconstruction problem is equivalent to solv-
ing an optimal match between the rows and columns,
which minimises the overall cost. Let us suppose the
decision matrix X
(t)
= {x
(t)
i, j
}
k×k
, where, x
(t)
i, j
= 1 de-
notes that the load pattern gets linked with next con-
sumption bucket B
(t+1)
j
and x
(t)
i, j
= 0 otherwise. Now,
we construct the energy consumption recovery prob-
lem as follows.
minimise
k
∑
i=1
k
∑
i=1
c
(t)
i, j
· x
(t)
i, j
(2)
subject to: x
(t)
i, j
= {0, 1} (3)
k
∑
i=1
x
(t)
i, j
= 1 and
k
∑
j=1
x
(t)
i, j
= 1 (4)
Such an optimisation problem could be solved by the
Hungarian algorithm (Xu et al., 2017; Kuhn, 1955).
5.2 Recovering Fine-grained Energy
Consumption Patterns
We propose a scheme inspired by the work in (Xu
et al., 2017) based on our observations discussed in
Section 4 to formulate the cost matrix over the 24
hours of a day. The steps are as follows.
1) We calculate the expected changing for a given
bucket at time t by our observation about the energy
consumption speed. We use ∆
(t)
= {δ
(t)
1
, . . . , δ
(t)
k
} to
indicate the matrix of such expectations for all possi-
ble buckets under given bucket size. Note that, once
given a bucket size, all the energy consumption values
can be assigned to a specific bucket.
According to what we have in Figure 6, we calcu-
late δ
(t)
j
∈ ∆
(t)
for bucket B
(t)
j
as
δ
(t)
j
=
20
∑
i=1
Pr
i
×change
i
, (5)
where change
i
indicates the ith changing step (x axis)
shown in Figure 6, Pr
i
is the corresponding probabil-
ity measured by the percentage of households (y axis)
in Figure 6, 20 is a predefined value for the steps of
energy consumption changing from time t to t + 1.
Then for a given bucket j at time t, we estimate its
value for time t + 1 as
ˆ
B
(t+1)
j
= B
(t)
j
× δ
(t)
j
(6)
2) We consider ∆
(t)
at each time step t as the
thresholds that have been discussed in Section 4.3.
We used the above discussed assumption to con-
struct the cost matrix C
(t)
. Thus, we use the
Euclidean distance between the estimated/predicted
bucket
ˆ
B
(t+1)
u
i
of households i and each unassigned
bucket B
(t+1)
j
at the next time slot to formulate the
SECRYPT 2021 - 18th International Conference on Security and Cryptography
290
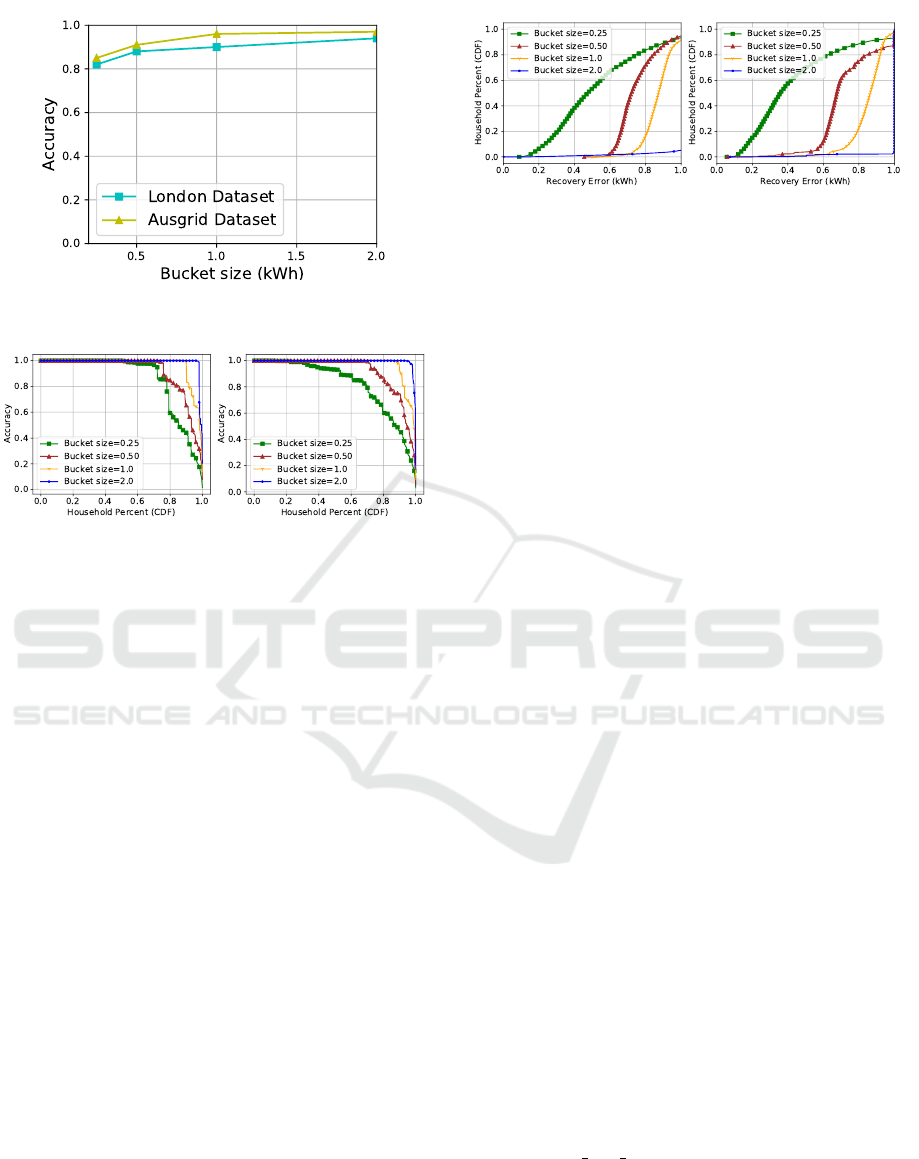
Figure 7: Mean recovery accuracy of energy consumption
buckets for different size of buckets.
(a) Ausgrid Dataset (b) London Dataset
Figure 8: Adversarial performance (accuracy) of the at-
tacker in recovering energy consumption patterns of indi-
vidual households using both datasets.
cost matrix C
(t)
. The cost for each household for con-
suming energy from each bucket is illustrated in the
following equation.
c
(t)
i j
= |
ˆ
B
(t+1)
u
i
− B
(t+1)
j
|. (7)
For example, let the corresponding bucket of Al-
ice’s energy consumption be x at time t. We first cal-
culate the estimated bucket ˆx for time t + 1 based on
current time t. Let the unassigned bucket at time t + 1
be y
1
and y
2
. Then we have to decide whether we
move Alice from bucket x to y
1
or y
2
. We calculate the
cost of such a movement by calculating the distance
between ˆx and y
1
, y
2
respectively. Solving the opti-
misation problem in last section with the cost matrix
would provide us with a decision as to whether Alice
moves to bucket y
1
or y
2
, that is, the energy consump-
tion of Alice at time t + 1.
6 EXPERIMENTAL EVALUATION
In this section, we first introduce the configurations,
together with the metrics used in our experimental
analysis of the attack model, then report the attack
performance against two famous real-world datasets
of individual’s energy consumption data.
(a) Ausgrid Dataset (b) London Dataset
Figure 9: Cumulative errors (recovery error) in estimating
energy consumption trace of individual households using
both datasets.
6.1 Experimental Configurations
First, we aggregate the half hourly reading to hourly
readings for both datasets. We split the datasets ran-
domly into five samples where each sample contains
1000 households over 2 months. One month of data
is chosen from the beginning of the year and another
month of data from the middle of the year because
the households’ energy consumption distribution in
the middle of the year is different from that of at the
beginning and end of the year for both the datasets.
This variation in energy consumption distribution
could be caused by seasonal change (e.g., winter to
summer) over time. We choose four values of l =
[0.25, 0.50, 1.0, 2.0] to check how user percentages
vary from one bucket size to another. We then gen-
erate buckets for each value of l for each sample of
the data. We also calculate the number of households
in each bucket at each time step to observe how con-
sistent the households are in consuming energy from
different size of buckets. Then we compute the per-
centage of households at different ranges of energy
consumption change (as a percentage) (see Figure 6).
We then convert the range of percentage changes into
discrete values (e.g., if the percentage change of en-
ergy consumption remains between 0 to 10%, we map
this range into 0.1, and if the range is between 11-
20%, we map this into 0.2 and so on). We then com-
pute the expected speed of energy consumption that
is, expected energy consumption change over each
hour of the day by multiplying the mapped value with
its corresponding user percentage, as explained ear-
lier in Section 4.3. This ∆ helps us construct the
cost matrices to reconstruct energy consumption pat-
terns in terms of buckets. Then we apply the Hun-
garian algorithm to optimise the assignment problem
using linear sum assignment solver imported from
a python library scipy.optimise. The entire project
is implemented in Python3.
Trace Recovery: Inferring Fine-grained Trace of Energy Data from Aggregates
291

6.2 Metrics
We evaluate the attack performance of the adver-
sary by considering the following two metrics: ac-
curacy in recovering buckets which the households
consuming the energy from and recovery error. First,
we pair the recovered energy consumption patterns
in terms of buckets with the most similar actual
load patterns (i.e., the ground truth buckets) using a
greedy approach. Let the actual load pattern buck-
ets of i
th
household be B
i
= {B
(1)
i
, B
(2)
i
, . . . , B
(T )
i
}
and the j
th
recovered load pattern buckets be
ˆ
B
i
=
{
ˆ
B
(1)
i
,
ˆ
B
(2)
i
, . . . ,
ˆ
B
(T )
i
} over a period of time T . Thus,
the average accuracy is denoted by A is defined as
follows.
A =
1
n
n
∑
i, j
|
ˆ
B
j
∩ B
i
|
|B
i
|
, (8)
where,
ˆ
B
j
∩ B
i
refers to the common energy con-
sumption buckets between the estimated buckets and
the actual buckets, and | ∗ | refers to the total number
of buckets in ∗.
Secondly, we compute the recovery error (RE) by
measuring the distance between the estimated buck-
ets and the actual energy consumption traces (not the
actual buckets) of households as follows.
RE :=
1
T
∑
T
t=1
|x
(t)
1
−
ˆ
B
(t)
1
|
.
.
.
∑
T
t=1
|x
(t)
n
−
ˆ
B
(t)
n
|
, (9)
where,
ˆ
B
(t)
i
is the estimated bucket of a household
i at time t and x
(t)
i
is the actual energy consumption
trace of a household i at time t.
6.3 Adversarial Performance
We empirically quantify the performance of the ad-
versary A in recovering energy consumption buck-
ets. We first present the average recovery accuracy
of reconstruction attack on the two above discussed
datasets.
Figure 7 shows that the average recovery accuracy
(over all target households) averaged over the entire
period of time, varies between 80% and 95% for the
different sized buckets. We observe that the buckets
(i.e., energy consumption patterns) recovery accuracy
in the Ausgrid dataset is a small amount higher than in
the London dataset. The accuracy increases with the
increase of the size of buckets because the top buck-
ets are accommodating more users as the buckets in-
clude more coarse-grained meter readings within their
boundaries.
We now demonstrate the cumulative accuracy (see
Figure 8) of the attacker in recovering the energy con-
sumption patterns of households using both datasets
for four different size of buckets. Figure 8a shows
that over 90% of the households’ consumption pat-
terns can be recovered accurately when the bucket
size is between 1 and 2. Reducing the size of the
bucket to 0.50, we observe the cumulative accuracy
falls, though still achieving more than 95% accuracy
for around 75% of households in reconstructing their
load patterns in terms of buckets. When we set bucket
size to 0.25, we observe that the adversary is still
capable of recovering over 70% of the households’
energy consumption patterns with over 95%accuracy.
Moreover, 80% of the households’ load patterns can
be inferred with at least 80% accuracy. In using the
London smart meter dataset, we observe similar re-
sults for all size of buckets except the 0.25 bucket.
Setting the bucket size to 0.25, we observe that 50%
and 70% of households’ load patterns can be inferred
from aggregated statistics with around 90% and 80%,
respectively, or higher accuracy.
Thus, our experimental evaluations show that the
adversary successfully recovers most of the house-
holds’ energy consumption load patterns (i.e., the
quantity of households that consume from which
buckets). These findings show that the privacy threat
is severe and this attack paves a way for other possi-
bilities of inferring minute private information about
occupancy levels and the activities of target house-
holds.
Finally, we report how far the estimated buckets of
energy consumption patterns deviate from the ground
truth energy consumption traces. Figure 9 shows the
recovery errors in kWh (x-axis) and the y-axis repre-
sents the households’ percentage. We observe that in-
creasing the size of the buckets, increases recovery er-
rors, whereas a smaller bucket size decreases recovery
errors for both smart meter energy datasets. For the
smallest bucket the adversary recovers 60% of house-
holds’ energy consumption by incurring 0.6 kWh or
less error from the actual (ground truth) consumption
traces in the Ausgrid dataset. The adversary A incurs
less errors in the London dataset compared to that of
in Ausgrid dataset. The attacker recovers energy con-
sumption traces of 40% and 80% households and in-
curs only 0.4 kWh and 0.6 kWh or less deviation from
the ground truth traces, respectively.
We conclude from the above discussed empiri-
cal evaluations that our adversarial strategy is effec-
tive in inferring the fine-grained energy consumption
load patterns of individual households from aggre-
SECRYPT 2021 - 18th International Conference on Security and Cryptography
292

gated statistics. Our study deduces that private infor-
mation such as household occupancy level and home
activities can be gleaned from the estimated fine-
gained energy consumption data with high accuracy
and low recovery errors. These findings suggest that
releasing or sharing the aggregated statistics of energy
consumption records of individual households, is not
privacy protective. A malicious entity can infringe
the privacy of individuals by exploiting the consis-
tency and distinctiveness properties of consumption
patterns. Therefore, data owners must quantify the
risks in aggregated statistics before releasing publicly
or sharing with third party stakeholders.
7 DISCUSSION AND
CONCLUDING REMARKS
We have shown that an adversary is capable of recon-
structing individual energy consumption traces from
aggregated statistics with very high accuracy. Thus,
any aggregated energy consumption datasets are not
resilient to such attack. As a consequence, the pri-
vacy of individual households is at risk. However, we
considered only a limited number of queries to assess
the adversary’s inference capabilities, which could be
countered as a weakness in the adversarial model. To
address this weakness we will attempt to construct a
generic attack model in the future work. Further, we
discussed a potential privacy preserving scheme that
can be deployed in a privacy preserving data analyt-
ics framework to mitigate such privacy attacks while
leveraging the aggregated utility of the data. One of
the promising privacy preserving technologies is dif-
ferential privacy (Dwork and Roth, 2014) (DP) that
could be used to mitigate the effect of the proposed
attack on aggregated consumption. DP is an effi-
cient way to protect the privacy of individual users
and can also be used to attenuate the implications of
reconstruction attacks. In future work, we would in-
vestigate how local differential privacy (LDP) (Ka-
siviswanathan et al., 2011) could be deployed when
collecting data from the smart meters. However, it is
still challenging to achieve an optimised trade-off be-
tween privacy and utility. Following this paper, we
would try to employ LDP under a min-max game that
minimises the accuracy loss against protecting from
adversaries having maximum background knowledge
of the households’ energy consumption patterns.
We studied the privacy implications of the aggre-
gated statistics of energy consumption data that is col-
lected from smart meter reading. We empirically eval-
uated an adversary’s performance without having any
external information to recover individual users’ fine-
grained energy consumption on an hourly basis. We
offer an example of how an adversary can formulate
an unsupervised attack method; we pose the problem
as a balanced assignment problem and solve it using
the Hungarian algorithm to find the optimal match
by minimising the cost. Overall, our work presents
a novel methodology to assess privacy risks in ag-
gregated smart meter data. Moreover, our methodol-
ogy can be used to quantify the privacy implications
in other real-world settings such as transaction data,
health data and web search data.
REFERENCES
Abdallah, A. and Shen, X. S. (2016). A lightweight lattice-
based homomorphic privacy-preserving data aggrega-
tion scheme for smart grid. IEEE Transactions on
Smart Grid, 9(1):396–405.
Buescher, N., Boukoros, S., Bauregger, S., and Katzen-
beisser, S. (2017). Two is not enough: Privacy
assessment of aggregation schemes in smart meter-
ing. Proceedings on Privacy Enhancing Technologies,
2017(4):198–214.
Chen, K., He, Z., Wang, S. X., Hu, J., Li, L., and He,
J. (2018). Learning-based data analytics: Moving
towards transparent power grids. CSEE Journal of
Power and Energy Systems, 4(1):67–82.
Dong, X., Zhou, J., and Cao, Z. (2016). Efficient privacy-
preserving temporal and spacial data aggregation for
smart grid communications. Concurrency and Com-
putation: Practice and Experience, 28(4):1145–1160.
Dwork, C. and Roth, A. (2014). The algorithmic founda-
tions of differential privacy. Foundations and Trends
in Theoretical Computer Science, 9(3–4):211–407.
Efthymiou, C. and Kalogridis, G. (2010). Smart grid pri-
vacy via anonymization of smart metering data. In
2010 First IEEE International Conference on Smart
Grid Communications, pages 238–243. IEEE.
ENA-Report (2015). Energy networks association, “smart
meter aggregation assessment final report.
Erkin, Z. and Tsudik, G. (2012). Private computation of
spatial and temporal power consumption with smart
meters. In International Conference on Applied
Cryptography and Network Security, pages 561–577.
Springer.
Farokhi, F. (2020). Review of results on smart-meter pri-
vacy by data manipulation, demand shaping, and load
scheduling. IET Smart Grid.
Habtemariam, B., Miranskyy, A., Miri, A., Samet, S., and
Davison, M. (2016). Privacy preserving predictive
analytics with smart meters. In 2016 IEEE Inter-
national Congress on Big Data (BigData Congress),
pages 190–197. IEEE.
Herrero, J. R., Murciego,
´
A. L., Barriuso, A. L., de La Igle-
sia, D. H., Gonz
´
alez, G. V., Rodr
´
ıguez, J. M. C., and
Carreira, R. (2017). Non intrusive load monitoring
(nilm): A state of the art. In International Conference
Trace Recovery: Inferring Fine-grained Trace of Energy Data from Aggregates
293

on Practical Applications of Agents and Multi-Agent
Systems, pages 125–138. Springer.
Hong, Y., Liu, W. M., and Wang, L. (2017). Privacy
preserving smart meter streaming against information
leakage of appliance status. IEEE transactions on in-
formation forensics and security, 12(9):2227–2241.
Kasiviswanathan, S. P., Lee, H. K., Nissim, K., Raskhod-
nikova, S., and Smith, A. (2011). What can we learn
privately? SIAM Journal on Computing, 40(3):793–
826.
Kelly, J. and Knottenbelt, W. (2015). Neural nilm: Deep
neural networks applied to energy disaggregation. In
Proceedings of the 2nd ACM international conference
on embedded systems for energy-efficient built envi-
ronments, pages 55–64.
Knirsch, F., Eibl, G., and Engel, D. (2016). Error-
resilient masking approaches for privacy preserving
data aggregation. IEEE Transactions on Smart Grid,
9(4):3351–3361.
Kuhn, H. W. (1955). The hungarian method for the as-
signment problem. Naval research logistics quarterly,
2(1-2):83–97.
Lee, Y.-T., Hsiao, W.-H., Lin, Y.-S., and Chou, S.-C. T.
(2017). Privacy-preserving data analytics in cloud-
based smart home with community hierarchy. IEEE
Transactions on Consumer Electronics, 63(2):200–
207.
Liu, Y., Guo, W., Fan, C.-I., Chang, L., and Cheng, C.
(2018). A practical privacy-preserving data aggrega-
tion (3pda) scheme for smart grid. IEEE Transactions
on Industrial Informatics, 15(3):1767–1774.
Makhdoom, I., Zhou, I., Abolhasan, M., Lipman, J., and Ni,
W. (2020). Privysharing: A blockchain-based frame-
work for privacy-preserving and secure data sharing
in smart cities. Computers & Security, 88:101653.
Molina-Markham, A., Shenoy, P., Fu, K., Cecchet, E., and
Irwin, D. (2010). Private memoirs of a smart meter.
In Proceedings of the 2nd ACM workshop on Embed-
ded Sensing Systems for Energy-Efficiency in Build-
ing, pages 61–66. ACM.
Reinhardt, A., Egarter, D., Konstantinou, G., and Christin,
D. (2015). Worried about privacy? let your pv con-
verter cover your electricity consumption fingerprints.
In 2015 IEEE International Conference on Smart
Grid Communications (SmartGridComm), pages 25–
30. IEEE.
Sankar, L., Rajagopalan, S. R., Mohajer, S., and Poor, H. V.
(2012). Smart meter privacy: A theoretical frame-
work. IEEE Transactions on Smart Grid, 4(2):837–
846.
Shateri, M., Messina, F., Piantanida, P., and Labeau, F.
(2019). Deep directed information-based learning for
privacy-preserving smart meter data release. In 2019
IEEE International Conference on Communications,
Control, and Computing Technologies for Smart Grids
(SmartGridComm), pages 1–7. IEEE.
Sirojan, T., Lu, S., Phung, B., and Ambikairajah, E. (2019).
Embedded edge computing for real-time smart me-
ter data analytics. In 2019 International Conference
on Smart Energy Systems and Technologies (SEST),
pages 1–5. IEEE.
Vahedi, E., Bayat, M., Pakravan, M. R., and Aref, M. R.
(2017). A secure ecc-based privacy preserving data
aggregation scheme for smart grids. Computer Net-
works, 129:28–36.
Wang, Y., Chen, Q., Hong, T., and Kang, C. (2018). Review
of smart meter data analytics: Applications, method-
ologies, and challenges. IEEE Transactions on Smart
Grid, 10(3):3125–3148.
Wen, M., Lu, R., Zhang, K., Lei, J., Liang, X., and Shen,
X. (2013). Parq: A privacy-preserving range query
scheme over encrypted metering data for smart grid.
IEEE Transactions on Emerging Topics in Computing,
1(1):178–191.
Xu, C., Zhang, L., Zhu, L., Zhang, C., Du, X., Guizani,
M., and Sharif, K. (2020). Aggregate in my way:
Privacy-preserving data aggregation without trusted
authority in icn. Future Generation Computer Sys-
tems, 111:107–116.
Xu, F., Tu, Z., Li, Y., Zhang, P., Fu, X., and Jin, D. (2017).
Trajectory recovery from ash: User privacy is not pre-
served in aggregated mobility data. In Proceedings
of the 26th International Conference on World Wide
Web, pages 1241–1250.
Yang, L., Chen, X., Zhang, J., and Poor, H. V. (2014). Cost-
effective and privacy-preserving energy management
for smart meters. IEEE Transactions on Smart Grid,
6(1):486–495.
Zhang, J., Chen, X., Ng, W. W., Lai, C. S., and Lai, L. L.
(2019). New appliance detection for nonintrusive load
monitoring. IEEE Transactions on Industrial Infor-
matics, 15(8):4819–4829.
SECRYPT 2021 - 18th International Conference on Security and Cryptography
294
