
A Comparative Analysis of Classic and Deep Learning Models for
Inferring Gender and Age of Twitter Users
Yaguang Liu
1
, Lisa Singh
1
and Zeina Mneimneh
2
1
Department of Computer Science, Georgetown University, 3700 O St., NW, Washington, DC, U.S.A.
2
Survey Research Center, University of Michigan, 426 Thompson Street, Ann Arbor, Michigan, U.S.A.
Keywords:
Demographic Inference, Siamese Network, BERT, Deep Learning.
Abstract:
In order for social scientists to use social media as a source for understanding human behavior and public
opinion, they need to understand the demographic characteristics of the population participating in the conver-
sation. What proportion are female? What proportion are young? While previous literature has investigated
this problem, this work presents a larger scale study that investigates inference techniques for predicting age
and gender using Twitter data. We consider classic text features used in previous work and introduce new
ones. Then we use a range of learning approaches from classic machine learning models to deep learning
ones to understand the role of different language representations for demographic inference. On a data set
created from Wikidata, we compare the value of different feature sets with different algorithms. In general, we
find that classic models using statistical features and unigrams perform well. Neural networks also perform
well, particularly models using sentence embeddings, e.g. a Siamese network configuration with attention to
tweets and user biographies. The differences are marginal for age, but more significant for gender. In other
words, it is reasonable to use simpler, interpretable models for some demographic inference tasks (like age).
However, using richer language model is important for gender, highlighting the varying role language plays
for demographic inference on social media.
1 INTRODUCTION
Recently, there has been increasing interest in un-
derstanding public opinion (O’Connor et al., 2010;
Karami and Bennett, 2018; Williams et al., 2019),
health (Dredze, 2012; Sinnenberg et al., 2017;
De Choudhury et al., 2013), and politics (O’Connor
et al., 2010; Jungherr et al., 2016; Bode et al., 2020)
using social media data. Traditionally, many of these
types of studies have used survey data, where the
demographics of the survey respondents are self re-
ported. As social science researchers begin using so-
cial media data instead of or in addition to survey data,
they need to understand the characteristics of the pop-
ulation being studied. Because of the variability in
features shared by users, the short length of the posts,
and the noisiness of the domain, robust methods for
demographic inference are challenging (Zhang et al.,
2016). We study two traditionally important demo-
graphics for social science research, gender and age.
Research in these areas is rich, and a number of meth-
ods have been proposed for inferring them (Hinds and
Joinson, 2018; Ciot et al., 2013; Sakaki et al., 2014;
Rao et al., 2011; Chamberlain et al., 2017; Rosenthal
and McKeown, 2011; Nguyen et al., 2011; Al Zamal
et al., 2012; Preot¸iuc-Pietro and Ungar, 2018; Pen-
nacchiotti and Popescu, 2011). However, the types
of features that are useful for inferring different de-
mographics vary considerably and it is unclear which
models are most effective when different types of tex-
tual features are available. Our first goal in selecting
these demographics is to understand the strengths and
weaknesses of different methods on the same data set
across traditionally important demographics. Previ-
ous research has shown that there are linguistic differ-
ences between demographic groups (Jørgensen et al.,
2015), further motivating this work.
More specifically, we investigate the following re-
search questions: (1) Which demographics can be in-
ferred effectively from text alone? (2) How useful
are statistical features for demographic inference? (3)
When are classic models sufficient for demographic
inference and when are deep learning models substan-
tially better? (4) For which demographics are words,
phrases, and/or sentences most informative?
While there are different social media platforms
48
Liu, Y., Singh, L. and Mneimneh, Z.
A Comparative Analysis of Classic and Deep Learning Models for Inferring Gender and Age of Twitter Users.
DOI: 10.5220/0010559500480058
In Proceedings of the 2nd International Conference on Deep Learning Theory and Applications (DeLTA 2021), pages 48-58
ISBN: 978-989-758-526-5
Copyright
c
2021 by SCITEPRESS – Science and Technology Publications, Lda. All rights reserved

we could study, we chose Twitter for two reasons.
First, Twitter is an information sharing site that en-
ables users to engage in conversation about impor-
tant topics or follow users of interest as opposed to
just friends (Yu et al., 2021). Thus, analyzing Twit-
ter data is important and likely more challenging than
friendship networks. Second, Twitter data are pub-
licly available. Because of data availability, we con-
sider simplified versions of both gender and age. For
gender, we consider the binary version of the task
with only male and female since our ground truth data
contains only those two classes. For age, we consider
a binary task with two age categories and a multi-class
version of the task with three age categories. Again,
this is done to ensure that we have sufficient training
data for each class.
We conduct an extensive analysis of the relation-
ship between different types of features and differ-
ent types of models. In addition to analyzing tradi-
tional text-based and statistical features used for this
task, e.g. unigrams, number of tweets, emoji count,
etc., we also introduce the idea of using sequential
patterns of words. We use sequential pattern mining
to construct frequently occurring word groupings and
evaluate their strengths and weaknesses as features
within classic learning models for inferring gender
and age. Finally, we consider different types of em-
bedding spaces, feature sets, and network construc-
tions for deep learning models. We find that for gen-
der, the deep learning models, particularly those using
sentence embeddings, outperform the classic models.
For age, using bigrams or sequential patterns leads
to slightly better results than using only unigram text
features within classic models, and comparable re-
sults to the neural network models. This variation
is important to understand because it highlights the
roles language features play when inferring different
demographics.
To summarize, this paper makes the following
contributions: 1) We construct a range of different
types of features and show when they are useful for
different demographic inference tasks. 2) We com-
pare classic and deep learning models for two dif-
ferent demographic inference tasks and evaluate their
performance. 3) We evaluate deep learning models in-
corporating different types of embeddings (both word
embeddings and sentence embeddings) to understand
which network constructions are most promising for
the demographic inference task. 4) We make avail-
able a curated Wikidata set so other researchers have
access to a reliable ground truth data set for this task.
The rest of the paper is structured as follows. In
Section 2 we review relevant literature. In Section 3
we present our experimental design. Section 4 de-
scribes our dataset. In Section 5, we present our em-
pirical evaluation. Section 6 presents our conclusions
and discusses future work. Finally, we discuss ethical
considerations associated with inferring demograph-
ics from Twitter data in Section 7.
2 RELATED LITERATURE
Researchers have been developing methods for in-
ferring a number of different demographics, includ-
ing age (Schler et al., 2006; Rosenthal and McK-
eown, 2011; Al Zamal et al., 2012; Chen et al.,
2015), gender (Chen et al., 2015; Al Zamal et al.,
2012; Sakaki et al., 2014; Taniguchi et al., 2015),
race/ethnicity (Preot¸iuc-Pietro and Ungar, 2018; Cu-
lotta et al., 2016), location (Ikawa et al., 2012; Tian
et al., 2020), and education level (Culotta et al., 2015;
Culotta et al., 2016) to name a few. The majority of
research using social media data constructs features
that are some combination of user profile information,
post content, and images when building the inference
model.
Profile-based approaches use data associated with
the user’s account, including the user’s name, biog-
raphy, followers and friends. For example, several
studies have proposed using first name as a predic-
tor for gender (Mislove et al., 2011; Sloan et al.,
2013; Wood-Doughty et al., 2018). Content-based
methods exploit users’ posts as features. Most pre-
vious approaches use a bag of words model, focus-
ing on ngrams (Rao et al., 2010; Nguyen et al., 2013)
and sometimes consider stylistic features like the use
of emojis, punctuation, and abbreviations (Rosenthal
and McKeown, 2011).
Very little attention has been paid to pattern-
mining based features and the role they may play
in demographic inference. Therefore, in addition to
using the previously proposed features in the classic
machine learning methods, we also consider features
from sequential pattern mining. Sequential pattern
mining is a classic data mining technique for iden-
tifying patterns of ordered events within a data set
(Agrawal and Srikant, 1995). It has been applied in
many domains, and has been shown to be effective
for text mining tasks (Pokou et al., 2016).
More recently, researchers have begun incorporat-
ing neural network models for inferring demograph-
ics. For example, Vijayaraghavan et al. (Vijayaragha-
van et al., 2017) build a deep learning model using
users’ profile information, tweets, and images. Wang
and colleagues (Wang et al., 2019) investigate us-
ing profile based features like name with character
embedding and image embedding of profile pictures
A Comparative Analysis of Classic and Deep Learning Models for Inferring Gender and Age of Twitter Users
49

within deep learning models and achieve state-of-the-
art performance. A graph-based Recursive Neural
Networks (RNN) using skip-gram embeddings is pro-
posed by Kim et al. (Kim et al., 2017). The model
incorporates not only the text of the user, but also the
text of the user’s network. In our scenario, we do not
have access to the user’s network, i.e. the followers’
text. We want to consider newer methods that take ad-
vantage of pretraining, while recognizing the need to
build models with limited training data that can be ap-
plied to larger social media data sets by social scien-
tists. Therefore, in this paper we will use BERT (De-
vlin et al., 2018), a pretrained transformer network,
that, to the best of our knowledge, has not been used
this way for the demographic inference task.
While our analysis compares deep learning mod-
els incorporating word embeddings, we also explore
the use of sentence embeddings. Many models have
been proposed for sentence embedding. As an ex-
ample, Skip-Thought (Kiros et al., 2015) applies an
encoder-decoder architecture to predict the surround-
ing sentence. Yang et al. (Yang et al., 2018) present a
method for sentence embedding which uses a Siamese
network and yields good results on the STS bench-
mark dataset. In this work, we will use Sentence-
Transformers (Reimers and Gurevych, 2019) to com-
pute sentence embeddings for comparisons against
models using word embeddings.
Our work differs from previous work on demo-
graphic inference because 1) we focus on inference
using user text and user statistics, not images and/or
network information, 2) we compare our neural mod-
els to a larger set of non-neural models, 3) for the neu-
ral models we make use of language model pretrain-
ing and fine tuning (Peters et al., 2018; Devlin et al.,
2018; Radford et al., 2018), where previous work has
mapped text into embeddings and then fed them into
deeper network layers, and 4) we analyse both word
and sentence enbeddings for this task.
Figure 1: Model Overview.
3 EXPERIMENTAL DESIGN
In this section, we present our experimental de-
sign. We begin with a problem formulation and an
overview of the methodology. We then describe the
feature construction and the model building in more
detail. Specifics about the data set and the data prepa-
ration are presented in Section 4.1.
3.1 Problem Formulation
Suppose we are given a data set D containing a set
of user profiles. Each user profile U
i
contains pub-
lic information shared by a user, including his/her bi-
ography and the public posts he/she shares. U
i
also
contains standard account information, e.g. number
of followers. We represent all the information in U
i
as a set of attribute-value pairings. Each attribute-
value may be either a singleton, (age, {30}), or a set
of values, (location, {Chicago, NewYork}). For each
user U
i
, we maintain a vector of feature values X
i
de-
rived from the attribute-value pairings and a class la-
bel y
i
. Our goal is to build a classifier that uses X
i
to infer a user demographic y
i
. The demographics
we attempt to predict are gender (male, female), bi-
nary age bin (<= 45, > 45), and multi-class age bin
(<= 35, 35 − 55, > 55).
3.2 Overview
Figure 1 shows the standard high level design of our
approach. We begin by collecting our ground truth
data set (see next section for more details). We then
use the handles in the ground truth data to collect pub-
lic tweets and profiles through the Twitter Application
Interface (API). Once we have the data for our sam-
ple, we generate features, including ngrams, account
statistics, tweet metrics, etc. We then use a subset of
the features to build different classic machine learning
models and deep learning models. Finally, we evalu-
ate the quality of the different models for each of our
demographic inference tasks.
3.3 Feature Construction
Because we are considering different types of models,
we construct a range of features. We categorize them
into two groups: (1) statistical features and (2) textual
features. We construct sixteen statistical features re-
lated to account usage, user network, tweet content,
and tweet structure (see Table 1).
Textual features are derived from tweet text and
user biographies. The types of features extracted from
text vary depending upon the models being built. Fig-
ure 2 shows the different text features we consider for
our two classes of models. For the classic models,
we use unigrams, bigrams, or sequential patterns. We
use word-level or sentence-level embeddings for the
deep learning models. Recall, one of our main goals
is to understand the impact of these different textual
representations for our inference tasks.
For our ngram construction, we use the traditional
approach of grouping a contiguous sequence of n
DeLTA 2021 - 2nd International Conference on Deep Learning Theory and Applications
50
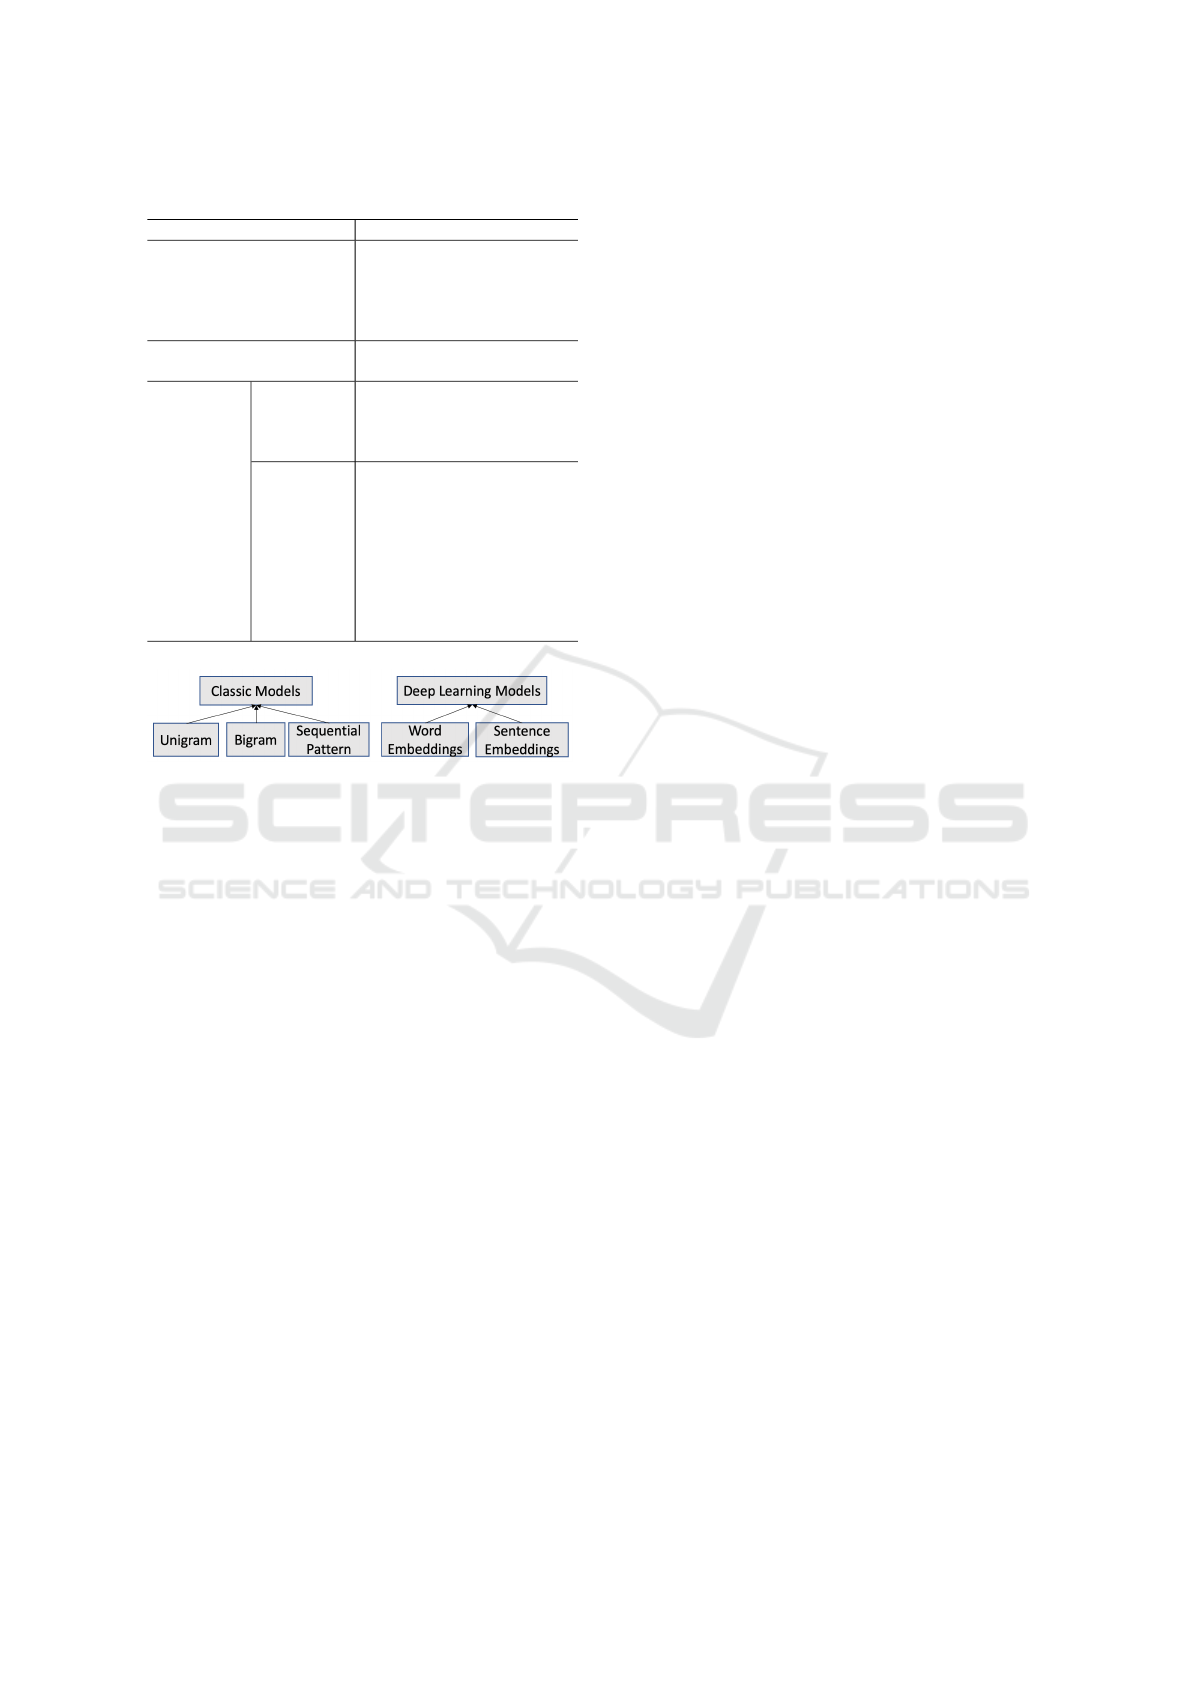
Table 1: Statistical features.
Category Features
account usage statistics
number of tweets, days
since first tweet, proportion
of tweets posted on week-
ends, average number of
tweets per day
network statistics
number of friends, number
of followers
tweet
statistics
tweet
structure
statistics
average number of words
per tweet, average word
length, vocabulary size of
per tweet
tweet con-
tent statis-
tics
proportion of emojis in bio,
proportion of hashtags in
bio, proportion of punctu-
ation in bio, proportion of
emojis per tweet, propor-
tion of hashtags per tweet,
proportion of punctuation
per tweet, proportion of real
words
Figure 2: Text feature alternatives for classic and deep
learning models.
items from a given text. When constructing sequential
patterns, we construct features by identifying frequent
sequential patterns in tweets. A frequent sequential
pattern is a sequence of words that appear across a
minimum number of tweets/posts, and therefore may
represent important features. While ngrams use a con-
tiguous sequence of words, sequential patterns consist
of ordered sequences of words that may be separated
by zero or more other words. Sequences of a speci-
fied length are generated for our document set D. The
task of sequential pattern mining is to find all frequent
sequential patterns in D (Pokou et al., 2016). In this
paper, when we construct sequential pattern features
we use the frequent sequential patterns as the text fea-
tures.
To explain why sequential pattern mining could be
useful, assume we have the following two tweets from
a user. 1) “The Mac is big and bright.” 2)“I like the
Mac which is bright.” If we construct bigrams for this
example, we get the following bigrams: “the mac”,
“mac is”, “is big”, “big and”, “and bright”, and the
second tweet is parsed into “I like”, “like mac”, “mac
which”, “which is”, “is bright”. However, the two
word phrase that contains the most similar content is
“mac bright”. Because that feature will be captured
with sequential patterns, but not bigrams, we are in-
terested in determining if sequential patterns that al-
low for gaps can further improve the performance of
classic models.
We use embeddings as text features for our deep
learning models. We use word embedding from
GloVe (Pennington et al., 2014) and sentence em-
bedding from BERT (Devlin et al., 2018) in differ-
ent models. By considering different linguistic repre-
sentations of data (bag of words, sequential patterns,
word embeddings, and sentence embeddings), we can
begin to gain insight into the types of linguistic fea-
tures that are important and those that are not as nec-
essary.
3.4 Learning Models
We now briefly present the classic and deep learning
models used in this paper. Our goal is to conduct ex-
periments using a representative set from each class
to determine if a certain class of models and group
of features perform better for inferring specific demo-
graphics.
3.4.1 Classic Models
Our experiments use four classic machine learning
models: logistic regression (LR), support vector ma-
chine (SVM), Naive Bayes (NB), and a decision tree
(DT) (Raschka and Mirjalili, 2017). While other clas-
sic models have been successful on different social
media tasks, we use these because they have been
shown to be effective for one or more demographic
inference tasks. While the statistical features are the
same for all of our experiments, the text features vary.
All the text features are generated from users’ tweets
and biographies, but we use the following text sub-
sets (1) unigrams, (2) unigrams+bigrams, (3) sequen-
tial patterns that contain patterns up to length of 2. We
limit the length of the sequential patterns to size two
so that we can directly compare this approach to one
involving bigrams.
3.4.2 Deep Learning Models
We consider different architectures for the deep learn-
ing models. The difference between the architectures
has to do with the construction of the embedding
spaces and the underlying data used, as well as the
inclusion of an attention layer in some of the models.
Figure 3 shows the components of each model.
Word Embedding Model: Previous literature
that employed deep learning models for demographic
inference used character or word embeddings for the
embedding layer of the neural network (Kim et al.,
2017; Wang et al., 2019). We do the same. We use
A Comparative Analysis of Classic and Deep Learning Models for Inferring Gender and Age of Twitter Users
51
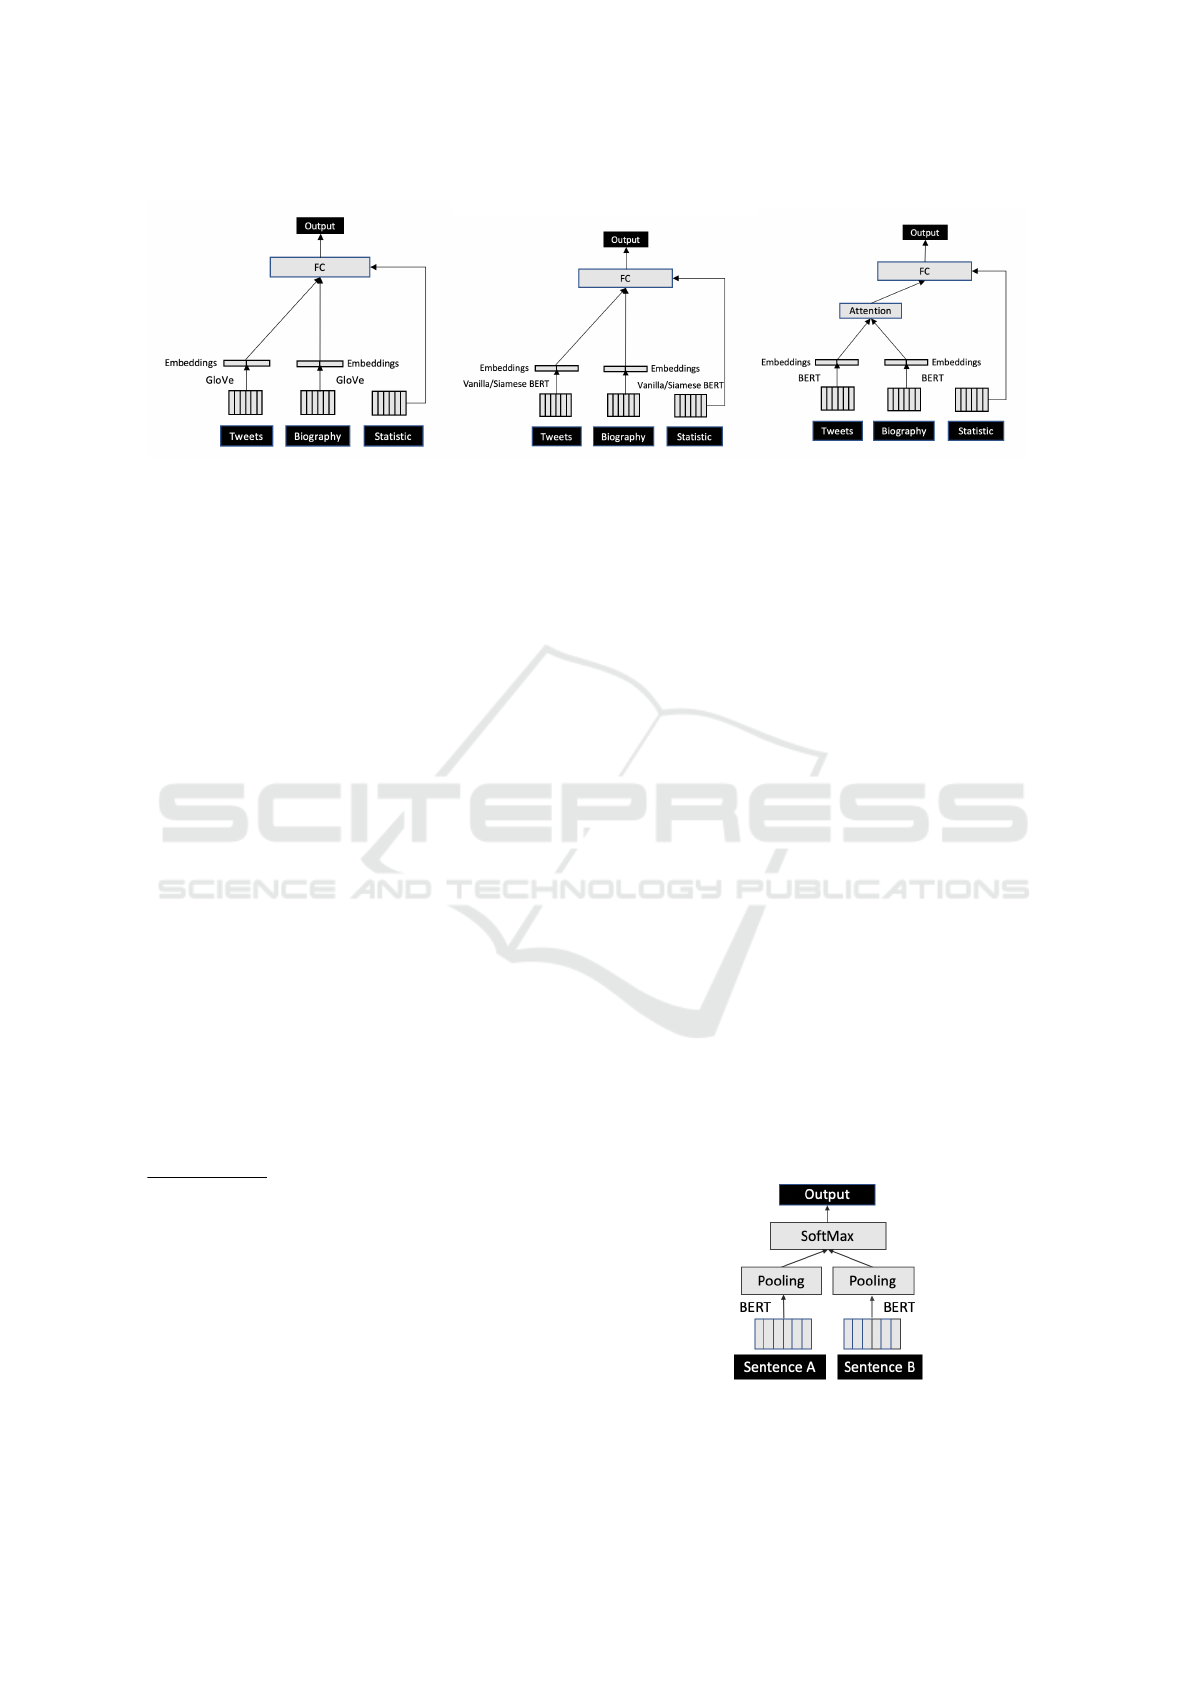
(a) Word Embedding Model (b) Vanilla/Siamese BERT Model (c) Attention-based Model
Figure 3: Illustration of different models.
the pretrained GloVe model (Pennington et al., 2014)
as the embedding layer. In this model, each word is
mapped into a vector and the posts/tweets of a user
are represented as a matrix. We map tweet features
to a vector by summing the matrix.
1
The biography
is mapped to a vector using the same method. The
embedding representation of the tweets and the biog-
raphy, and the statistical features are then input into a
fully-connected (FC) Multi-Layer Perceptron (MLP)
with one hidden layer
2
.
Vanilla BERT Model: Instead of using word em-
beddings, this model takes sentence embedding from
BERT as textual features. Word embedding analyze
text one word at a time, missing potentially impor-
tant sentence level contextual difference. For exam-
ple, suppose the following posts are in our data set: 1)
I went to the bank to get money. 2) We went to the
river bank to fish. Word embedding will generate the
same embedding for the two different contexts of the
word “bank”. When using sentence embeddings, each
sentence gets its own vector representation, therefore,
capturing the contextual differences of the two sen-
tences. This deep learning model uses the pretrained
uncased BERT-Base model to generate sentence em-
bedding for each tweet by averaging the BERT output
layer without fine-tuning.
3
We represent tweet fea-
tures as a vector by summing the tweet embeddings.
1
We have also tried to average it for all of our deep learn-
ing models. However, due to the sparsity of the data set,
averaging leads to less variation in the features for differ-
ent users. Summing has a higher variance and therefore, a
better overall performance.
2
We pause to mention that we considered some different
configurations and found this one to be effective. We leave
a more extensive analysis of other configurations for future
work.
3
The uncased BERT-Base model was pretrained on the
BookCorpus dataset consisting of 11,038 unpublished
books and English Wikipedia (excluding lists, tables and
headers).
The rest of the architecture is the same as that of the
word embedding model (see Figure 3b). Siamese-
Network Model: While sentence embeddings help
a model capture sentence level context for words in
a sentence, they do not capture clusters of semanti-
cally similar sentences. Given how noisy the Twit-
ter domain is, we are interested in understanding if a
more complex model that considers sentence similar-
ity is useful for demographic inference. We hypothe-
size that if two users share similar writing styles, they
would have semantically similar embeddings. For ex-
ample, if a user tweets ”I am a powerful guy” and an-
other user tweets ”I am an energetic man”, both imply
the tweet is posted by a male individual.
To capture these clusters, we use a Siamese
network architecture to generate sentence embed-
dings. The structure for the BERT training is de-
picted in Figure 4. The fine-tuning model is trained
on the SNLI (Bowman et al., 2015) and the MNLI
datasets (Williams et al., 2017) for classification. The
SNLI corpus is a collection of 570k English sentence
pairs manually annotated with the labels entailment,
contradiction, and neutral. The MNLI contains 430k
sentence pairs annotated with textual entailment in-
formation. With the fine-tuning, we are able to better
represent similar sentences with similar embeddings.
The classification objective function is defined as
Figure 4: Siamese Network architecture.
DeLTA 2021 - 2nd International Conference on Deep Learning Theory and Applications
52

Table 2: Cosine similarity comparison using different em-
bedding strategies between tweet 1 and tweet 2.
Tweet 1 Tweet 2
Similarity
(Vanilla
BERT)
Similarity
(Siamese-
Network
BERT)
No, I don’t
know
I do not
know
0.753 0.955
I am a pow-
erful guy
I am a ener-
getic man
0.818 0.848
follows:
o = so f tmax(W
(t)
(a, b, |a − b|)) (1)
where o ⊂ R
k
and a ⊂ R
n
and b ⊂ R
n
are sentence
embeddings with the element-wise difference |a − b|.
They are multiplied with the weight W
(t)
⊂ R
3n×k
.
Here, R is the real numbers and n is the dimension
of the sentence embeddings and k is the number of
labels.
Table 2 shows a simple example in which the
sentences have the same words and meanings, and
are considered more similar by the Siamese network
model than by the Vanilla BERT Sentence Embedding
model. Finally, this network takes sentence embed-
dings as input from the fine-tuned BERT, where se-
mantically similar sentences are mapped into similar
embeddings. The sentence embeddings are input into
the fully connected layer. The rest of the architecture
is the same as Word Embedding model and Vanilla
BERT Sentence Embedding model (see Figure 3b).
Attention-based Model: It is possible that all the
different types of information, i.e. modalities of infor-
mation, we are inputting into the neural network are
not as valuable for a specific demographic inference
task. For example, biographic information that indi-
cates someone’s occupation or location may be more
informative than account statistics. Generally, models
learn which information is more informative. How-
ever, we can use an attention mechanism to focus the
model on subsets of information we expect to be more
informative. Our attention-based models incorporate
an attention mechanism for the user biography and
the tweets. We accomplish this by multiplying the
feature vectors by a modality weight in the attention
layer. The attention over different modal features are
computed as follows:
α = so f tmax(W
(1)
tanh(W
(0)
M + b(0))+ b(1)) (2)
where tweet and bibliographic features are concate-
nated to form a matrix M ⊂ R
n×2
, α ⊂ R
1×n
, and b(0)
and b(1) are the bias terms. Figure 3c depicts the at-
tention model.
Table 3: Ground truth data distribution for gender and age.
Demographics Category Count
Gender
Male 10041
Female 4274
Age
Bin 2
<=45 9689
>45 4626
Bin 3
<=35 6695
35-55 4068
>55 3552
4 DATA PREPARATION
This section begins by describing the ground truth
data we use. We then discuss our approach for data
labeling and data preprocessing.
4.1 Ground Truth Data
For this study, we need reliable ground truth demo-
graphics for Twitter users. While most studies infer
this information from user images, hashtag or man-
ual annotations such as Amazon Mechanical Turk
(Ciot et al., 2013)(Al Zamal et al., 2012)(Taniguchi
et al., 2015), we use Wikidata. Wikidata is a col-
laboratively edited multilingual knowledge graph that
is hosted by the Wikimedia Foundation (Vrande
ˇ
ci
´
c
and Kr
¨
otzsch, 2014). Different Wikimedia projects,
including Wikipedia, use these data as a basis for a
common ontology. From Wikidata, we identify a set
of users who have shared public demographic infor-
mation, specifically, age and gender, as well as their
Twitter handles. We used the Python library wptools
to collect the Wikidata.
4
The users’ most recent 3200
tweets and their profile, metadata, etc., were collected
through Twitter API. We only include users who have
posted at least 20 tweets. After removing inactive or
private accounts, and those accounts with less than
20 tweets,
5
we are left with 14,315 accounts
6
and 8.8
million tweets for age and gender. Table 3 shows the
gender and binned age distributions. For gender, we
can directly use the values provided by Wikidata. We
have 10,041 male users and 4,274 female users. Be-
cause we have many more male users, we randomly
sample from the group in order to have more balanced
training data. While this may not be important for all
4
https://github.com/siznax/wptools/wiki
5
We have empirically found this to be the lowest number of
posts that lead to reliable results.
6
These data can be found at
https://portals.mdi.georgetown.edu/public/demographic-
inference-wikidata
A Comparative Analysis of Classic and Deep Learning Models for Inferring Gender and Age of Twitter Users
53

of our models, it is important for a number of the clas-
sic ones.
In the case of age, we need to bin the continuous
variable because the number of samples for some of
the distinct values is too small. We use two different
bin groupings, 2-bin, 3-bin. According to the Levin-
son adult development model (Levinson, 1986), age
45 defines a new era of adulthood. Therefore, this
is what we use for our 2-bin model. For our three
bin model, we worked with social science experts to
identify meaningful bins that were also relatively bal-
anced.
4.2 Data Preprocessing
We identify English tweets using the language at-
tribute provided by the Twitter API for each tweet.
To capture the different writing styles and content, we
remove all of the stopwords and keep punctuation for
classical models. We choose to keep punctuation in
order to capture possible variation in emoji usage. We
then process and tokenize the tweets, using NLTK’s
TweetTokenizer to extract groups of characters sepa-
rated by a space (tokens), to remove handles or men-
tions, and to remove any capitalization. For the deep
learning models, we remove Twitter username han-
dles from text. No other preprocessing is done.
5 EMPIRICAL EVALUATION
We begin by describing our experimental setup and
parameter settings. We then present the performance
of our model/feature combinations for each demo-
graphic.
5.1 Experimental Setup
Recall that the four classic methods in our experimen-
tal evaluation are logistic regression (LR), support
vector machine (SVM), Multinomial Naive Bayes
(MultiNB), and decision trees (DT). Based on a sen-
sitivity analysis, we have a threshold that removes
ngrams with a frequency support less than 0.003. For
the sequential pattern models (SPM), the minimum
frequency support is also set to be 0.003. The maxi-
mum length for a pattern is set to be 2 since we only
consider unigrams and bigrams for classic models.
For the deep learning models, the learning rate is set
to be 0.0001. We use 4 NVIDIA Tesla P4 GPUs with
each having 2560 CUDA Cores and 6 GBs of mem-
ory.
For all of our experiments, we use 10-fold cross
validation for training and have a separate holdout
set. We show the average 10-fold cross validation
results, as well as the results from the holdout test
set. We conducted an extensive sensitivity analysis
for each model (see Appendix) and present the results
for the best parameter settings for each configuration.
Both the training data and testing data are balanced to
avoid training and evaluation inaccuracies that could
result from imbalanced data. The evaluation metric
we present is the Macro-F1 measure.
5.2 Experimental Results
Table 4 presents a comparison of all the methods
and feature combinations. The table is divided into
seven groups: the classic models using unigram
text features (Unigram-), the classic models with
unigram and bigram features (Bigram-), the clas-
sic model with unigram and sequential pattern min-
ing features (SPM-), the word embedding model
(Word emd), the Vanilla BERT Sentence Embed-
ding model (BERT emd), the Siamese network model
(Siamese emd) and the Siamese network attention-
based model (Siamese emd Attention). The column
to the right of the model group is the 95% confi-
dence intervals, followed by the the holdout/testing
F1 score. In general, the 10-fold F1 score and the test
F1 score are comparable. Therefore, we will focus
our discussion on the test results.
5.2.1 Gender Inference
We show the F1 scores for gender prediction in Table
4. Beginning with the classical models, we see that
logistic regression performs the best among the four
algorithms for both unigram and bigram text features.
In general, using bigrams has a marginal improve-
ment on all of the models. However, from the confi-
dence intervals, we can see they actually perform very
similarly and these improvements are within the in-
terval range. Using sequential pattern features within
the classic models does not seem to improve the clas-
sic models. Among all of the classic models, the best
one is logistic regression with bigrams, achieving a
F1 score of 0.836.
The strongest models for gender are the deep
learning models. We see that all the models ex-
cept word embeddings perform better than the clas-
sic models with improvements ranging from 3% to
7% when compared to the best classic models in each
feature group. The Word Embedding model has a
comparable F1 score to the best classic models. The
Vanilla BERT Sentence Embedding models perform
3% to 4% better than the Word Embeddings model.
The Siamese Network models are the best perform-
ers, and the Siamese Network model with Attention
DeLTA 2021 - 2nd International Conference on Deep Learning Theory and Applications
54

Table 4: F1 score for gender and age.
Gender Age (2 bins) Age (3 bins)
Model 95% CI Test 95% CI Test 95% CI Test
Unigram-LR 0.835±0.006 0.834 0.811±0.007 0.796 0.674±0.014 0.673
Unigram-SVM 0.831±0.007 0.822 0.790±0.007 0.778 0.645±0.019 0.646
Unigram-MultiNB 0.733±0.012 0.734 0.742±0.007 0.723 0.574±0.017 0.576
Unigram-DT 0.787±0.009 0.793 0.764±0.009 0.767 0.602±0.016 0.587
Bigram-LR 0.825±0.005 0.836 0.819±0.011 0.821 0.679±0.011 0.685
Bigram-SVM 0.819±0.008 0.829 0.789±0.006 0.800 0.640±0.014 0.635
Bigram-MultiNB 0.741±0.009 0.745 0.754±-0.010 0.757 0.594±0.011 0.597
Bnigram-DT 0.786±0.007 0.805 0.761±0.015 0.773 0.601±0.016 0.591
SPM-LR 0.836±0.007 0.821 0.815±0.008 0.817 0.667±0.011 0.685
SPM-SVM 0.834±0.007 0.827 0.792±0.007 0.816 0.630±0.007 0.653
SPM-MultiNB 0.736±0.009 0.740 0.749±0.011 0.745 0.582±0.013 0.581
SPM-DT 0.791±0.008 0.770 0.764±0.010 0.779 0.607±0.012 0.587
Word emd MLP 0.840±0.011 0.838 0.813±0.008 0.819 0.655±0.014 0.680
Bert emd MLP 0.872±0.011 0.869 0.827±0.014 0.837 0.681±0.011 0.683
Siamese emd MLP 0.881±0.009 0.872 0.826±0.013 0.826 0.664±0.017 0.676
Siamese emd Attention 0.894±0.007 0.905 0.827±0.005 0.839 0.683±0.013 0.711
is 7% better than the best classic model. This is an
indication that adjusting the vector weights based on
the type of text (biography vs. tweet) can be useful
for gender. This result also suggests that gender can
be inferred with high accuracy from text when images
are not available.
5.2.2 Age Inference
Beginning with the 2-bin case, for the classic mod-
els, the models containing the bigram features per-
form better or the same as those containing unigrams
and sequential patterns. The best result is logistic
regression across all three feature types. In general,
Naive Bayes and decision trees performed the worst.
When considering the deep learning models, we see
that their results are comparable to the best classic
models. The Siamese BERT Sentence Embeddings
with attention is the best deep learning model, and
its performance is 2.5% better than logistic regres-
sion. For the 3-bin case, logistic regression is again
higher than other classic models. The best deep learn-
ing model is the Siamese Network model with Atten-
tion. Once again, it is comparable to the best classic
model. Overall, the worst classic models are around
10% lower than the best models. The worst neural
network model is only 2% worse than the best one.
The best classic model and the best neural network
model are comparable with F1 scores within 2% of
each other. This is a case where the simpler model is
sufficient.
5.3 Ablation Study
To evaluate the contribution of each group of features
for determining the user demographic, we compare
using all the features to using the feature set with one
feature removed. We still use the same configurations
and the test dataset as the previous experiments. The
results are similar for gender and age. So we will only
show gender here.
Table 5: An ablation study on gender.
Features F1 Score
All 0.872
w/o tweet 0.706
w/o biography 0.865
w/o statistical 0.871
The ablation results showing the F1 score for gen-
der using our Siamese model is presented in Table 5.
Compared to the full model, we see that removing the
tweet text reduces the F1 score by over 17%. Remov-
ing the biography data or the statistical features does
not have as significant an impact for inferring gender.
It is likely that the tweet text is capturing important
components of the other features when they are all
used together.
A Comparative Analysis of Classic and Deep Learning Models for Inferring Gender and Age of Twitter Users
55

6 CONCLUSIONS AND FUTURE
WORK
In this paper we investigated the demographic infer-
ence on Twitter by using a large number of text fea-
tures with a variety of classic and deep learning mod-
els to infer gender and age. Returning to the questions
posed in the introduction, we found that (1) both of
the demographics can be inferred effectively from text
data using the proposed models, with the binary de-
mographic inference tasks having an F1 score above
80%; (2) sequential patterns perform similarly to the
unigrams and bigrams model for gender and age, (3)
statistical features have the least impact on the over-
all performance of the model; (4) classic models are
sufficient for age inference, but not as strong as the
deep learning models for gender; and (5) the Siamese
network architecture with attention to tweets and bi-
ography with sentence embeddings within the deep
learning model was a strong model for both gender
and age.
There are a number of promising future directions.
First, we used a small number of layers in our deep
learning models. We would like to explore more com-
plex models to see if they can capture more nuanced
language differences. We also want to test our meth-
ods on other demographics, e.g. race, education level,
location. etc. Finally, we would like to better under-
stand the impact of tweet volume on inference accu-
racy - are there some demographics that need more
content for high levels of accuracy?
7 ETHICAL CONSIDERATIONS
We acknowledge that detection of user demographics
poses unique ethical considerations for researchers.
While automated methods can be valuable for under-
stand differences in attitudes and beliefs among those
on social media, error does exist in these models and
there are possible equity and justice related conse-
quences to imbalances in these errors. Getting in-
formed consent in a social media domain is compli-
cated when considering a data stream with millions of
users. Whether or not public social media data should
be used for research is an open question that Institu-
tional Review Boards (IRBs) are not handling consis-
tently. What is clear is that any usage of these data
should be to advance research and should not com-
promise reasonable expectations of privacy. We do
have an IRB exemption for this research from our in-
stitution.
Because our base data set is a Wikimedia data set,
the handles we have were shared publicly by the in-
dividuals who created their Wikipedia pages. There-
fore, we will share them with other researchers work-
ing on similar projects. However, we will not publicly
post them because of Twitter’s privacy policy and eth-
ical concerns. Finally, we know that our sample data
set is not representative of the general population. We
do balance all of our data sets for training our models
and will continue to try to improve our ground truth
data so that it is more representative, thereby creating
more general purpose inference models.
ACKNOWLEDGEMENTS
This work is funded by National Science Foundation
awards #1934925 and #1934494, the National Collab-
orative on Gun Violence Research (NCGVR) and the
Massive Data Institute (MDI) at Georgetown Univer-
sity. We thank our funders for their support.
REFERENCES
Agrawal, R. and Srikant, R. (1995). Mining sequential pat-
terns. In International Conference on Data Engineer-
ing.
Al Zamal, F., Liu, W., and Ruths, D. (2012). Homophily and
latent attribute inference: Inferring latent attributes of
twitter users from neighbors. In AAAI Conference on
Weblogs and Social Media (ICWSM).
Bode, L., Budak, C., Ladd, J., Newport, F., Pasek, J., Singh,
L. O., Soroka, S., and Traugott, M. (2020). Words
that matter: How the news and social media shaped
the 2016 Presidential campaign. Brookings Institu-
tion Press.
Bowman, S., A., Potts, C., and Manning, C. (2015). A large
annotated corpus for learning natural language infer-
ence. arXiv preprint arXiv:1508.05326.
Chamberlain, B., Humby, C., and Deisenroth, M. (2017).
Probabilistic inference of twitter users’ age based on
what they follow. In Joint European Conference
on Machine Learning and Knowledge Discovery in
Databases.
Chen, X., Wang, Y., Agichtein, E., and Wang, F. (2015). A
comparative study of demographic attribute inference
in twitter. In AAAI Conference on Weblogs and Social
Media(ICWSM).
Ciot, M., Sonderegger, M., and Ruths, D. (2013). Gen-
der inference of twitter users in non-english contexts.
In Conference on Empirical Methods in Natural Lan-
guage Processing (EMNLP).
Culotta, A., Kumar, N., and Cutler, J. (2015). Predicting
the demographics of twitter users from website traffic
data. In Association for the Advancement of Artificial
Intelligence.
Culotta, A., Ravi, N., and Cutler, J. (2016). Predicting twit-
ter user demographics using distant supervision from
DeLTA 2021 - 2nd International Conference on Deep Learning Theory and Applications
56

website traffic data. Journal of Artificial Intelligence
Research.
De Choudhury, M., Gamon, M., Counts, S., and Horvitz,
E. (2013). Predicting depression via social media.
In AAAI Conference on Weblogs and Social Media
(ICWSM).
Devlin, J., Chang, M., Lee, K., and Toutanova, K.
(2018). Bert: Pre-training of deep bidirectional trans-
formers for language understanding. arXiv preprint
arXiv:1810.04805.
Dredze, M. (2012). How social media will change public
health. IEEE Intelligent Systems.
Hinds, J. and Joinson, A. (2018). What demographic at-
tributes do our digital footprints reveal? a systematic
review. PloS one.
Ikawa, Y., Enoki, M., and Tatsubori, M. (2012). Location
inference using microblog messages. In International
Conference on World Wide Web.
Jørgensen, A., Hovy, D., and Søgaard, A. (2015). Chal-
lenges of studying and processing dialects in social
media. In Proceedings of the Workshop on Noisy
User-generated Text.
Jungherr, A., Schoen, H., and J
¨
urgens, P. (2016). The medi-
ation of politics through twitter: An analysis of mes-
sages posted during the campaign for the german fed-
eral election 2013. Journal of Computer-Mediated
Communication.
Karami, A. and Bennett, L.and He, X. (2018). Mining pub-
lic opinion about economic issues: Twitter and the us
presidential election. International Journal of Strate-
gic Decision Sciences (IJSDS).
Kim, S., Xu, Q., Qu, L., Wan, S., and Paris, C. (2017). De-
mographic inference on twitter using recursive neural
networks. In Annual Meeting of the Association for
Computational Linguistics.
Kiros, R., Zhu, Y., Salakhutdinov, R., Zemel, R., Urtasun,
R., Torralba, A., and Fidler, S. (2015). Skip-thought
vectors. In Advances in Neural Information Process-
ing Systems.
Levinson, D. (1986). A conception of adult development.
American psychologist.
Mislove, A., Lehmann, S., Ahn, Y., Onnela, J., and Rosen-
quist, J. (2011). Understanding the demographics of
twitter users. In AAAI Conference on Weblogs and So-
cial Media (ICWSM).
Nguyen, D., Gravel, R., and Trieschnigg, D.and Meder, T.
(2013). “ how old do you think i am?” A study of
language and age in twitter. In AAAI Conference on
Weblogs and Social Media (ICWSM).
Nguyen, D., Smith, N., and Rose, C. (2011). Author age
prediction from text using linear regression. In ACL-
HLT workshop on Language Technology for Cultural
Heritage, Social Sciences, and Humanities.
O’Connor, B., Balasubramanyan, R., Routledge, B., and
Smith, N. (2010). From tweets to polls: Linking text
sentiment to public opinion time series. In AAAI Con-
ference on Weblogs and Social Media (ICWSM).
Pennacchiotti, M. and Popescu, A. (2011). A machine
learning approach to twitter user classification. In
AAAI Conference on Weblogs and Social Media
(ICWSM).
Pennington, J., Socher, R., and Manning, C. (2014). Glove:
Global vectors for word representation. In Conference
on empirical methods in natural language processing
(EMNLP).
Peters, M., Neumann, M., Iyyer, M., Gardner, M., Clark,
C., Lee, K., and Zettlemoyer, L. (2018). Deep
contextualized word representations. arXiv preprint
arXiv:1802.05365.
Pokou, Y., Fournier-Viger, P., and Moghrabi, C. (2016). Au-
thorship attribution using small sets of frequent part-
of-speech skip-grams. In International Flairs Confer-
ence.
Preot¸iuc-Pietro, D. and Ungar, L. (2018). User-level race
and ethnicity predictors from twitter text. In Confer-
ence on Computational Linguistics.
Radford, A., Narasimhan, K., Salimans, T., and Sutskever,
I. (2018). Improving language understanding with un-
supervised learning. Technical report, OpenAI.
Rao, D., Paul, M., Fink, C., Yarowsky, D., Oates, T.,
and Coppersmith, G. (2011). Hierarchical bayesian
models for latent attribute detection in social media.
In AAAI Conference on Weblogs and Social Media
(ICWSM).
Rao, D., Yarowsky, D., Shreevats, A., and Gupta, M.
(2010). Classifying latent user attributes in twitter. In
International workshop on Search and Mining User-
generated Contents.
Raschka, S. and Mirjalili, V. (2017). Python Machine
Learning. Packt Publishing Ltd.
Reimers, N. and Gurevych, I. (2019). Sentence-bert: Sen-
tence embeddings using siamese bert-networks. In
Conference on Empirical Methods in Natural Lan-
guage Processing (EMNLP).
Rosenthal, S. and McKeown, K. (2011). Age prediction in
blogs: A study of style, content, and online behavior
in pre-and post-social media generations. In Associa-
tion for Computational Linguistics: Human Language
Technologies.
Sakaki, S., Miura, Y., Ma, X., Hattori, K., and Ohkuma, T.
(2014). Twitter user gender inference using combined
analysis of text and image processing. In Workshop
on Vision and Language.
Schler, J., Koppel, M., Argamon, S., and Pennebaker, J.
(2006). Effects of age and gender on blogging. In
Computational Approaches to Analyzing Weblogs.
Sinnenberg, L., Buttenheim, A., Padrez, K., Mancheno, C.,
Ungar, L., and Merchant, R. (2017). Twitter as a tool
for health research: A systematic review. American
Journal of Public Health.
Sloan, L., Morgan, J., Housley, W., Williams, M., Ed-
wards, A., Burnap, P., and Rana, O. (2013). Knowing
the tweeters: Deriving sociologically relevant demo-
graphics from twitter. Sociological Research Online.
Taniguchi, T., Sakaki, S., Shigenaka, R., Tsuboshita, Y.,
and Ohkuma, T. (2015). A weighted combination of
text and image classifiers for user gender inference. In
Workshop on Vision and Language.
A Comparative Analysis of Classic and Deep Learning Models for Inferring Gender and Age of Twitter Users
57

Tian, H., Zhang, M., Luo, X., Liu, F., and Qiao, Y. (2020).
Twitter user location inference based on representa-
tion learning and label propagation. In Proceedings of
The Web Conference.
Vijayaraghavan, P., Vosoughi, S., and Roy, D. (2017). Twit-
ter demographic classification using deep multi-modal
multi-task learning. In Annual Meeting of the Associ-
ation for Computational Linguistics.
Vrande
ˇ
ci
´
c, D. and Kr
¨
otzsch, M. (2014). Wikidata: A free
collaborative knowledgebase. Communications of the
ACM.
Wang, Z., Hale, S., Adelani, D., Grabowicz, P., Hartman,
T., Flock, F., and Jurgens, D. (2019). Demographic in-
ference and representative population estimates from
multilingual social media data. In The World Wide
Web Conference.
Williams, A., Nangia, N., and Bowman, S. (2017). A broad-
coverage challenge corpus for sentence understanding
through inference. arXiv preprint arXiv:1704.05426.
Williams, J., Singh, L., and Mezey, N. (2019). # metoo as
catalyst: A glimpse into 21st century activism. U. Chi.
Legal F.
Wood-Doughty, Z., Andrews, N., Marvin, R., and Dredze,
M. (2018). Predicting twitter user demographics from
names alone. In Workshop on Computational Model-
ing of People’s Opinions, Personality, and Emotions
in Social Media.
Yang, Y., Yuan, S., Cer, D., Kong, S., Constant, N., Pi-
lar, P., Ge, H., Sung, Y., Strope, B., and Kurzweil,
R. (2018). Learning semantic textual similarity from
conversations. arXiv preprint arXiv:1804.07754.
Yu, H., Murat, B., Li, L., and Xiao, T. (2021). How accurate
are twitter and facebook altmetrics data? A compara-
tive content analysis. Scientometrics.
Zhang, J., Hu, X., Zhang, Y., and Liu, H. (2016). Your age
is no secret: Inferring microbloggers’ ages via con-
tent and interaction analysis. In AAAI Conference on
Weblogs and Social Media (ICWSM).
APPENDIX
Table 6 - 8 shows the best parameters for gender, bi-
nary age, and muli-class age, respectively.
We use 10-fold cross validation with the dataset
and determine the best parameters by evaluating the
F1 score for each model. We then apply those param-
eters to our holdout test data set.
Table 6: Best parameter settings for gender.
Features Gender
Unigram-LR C:0.5, penalty:none
Unigram-SVM kernel: linear
Unigram-NB alpha:0.5, fit-prior:False
Unigram-DT criterion:gini, max-depth:11
Bigram-LR C:0.5, penalty:non
Bigram-SVM kernel:linear
Bigram-NB alpha:0.5, fit-prior:False
Bigram-DT criterion:entropy, max-depth:11
SPM-LR C:0.5, penalty:none
SPM-SVM kernel:linear
SPM-NB alpha:0.5, fit-prior:False
SPM-DT criterion:entropy, max-depth:11
Word emd MLP epoch 500, lr 0.001
Bert emd MLP epoch 1500, lr 0.0001
Siamese emd MLP epoch 1500, lr 0.0001
Siamese emd Attention epoch 1500, lr 0.0001
Table 7: Best parameter settings for age (2-bin).
Features Age (bin 2)
Unigram-LR C:0.5, penalty:l2
Unigram-SVM kernel: linear
Unigram-NB alpha:0.5, fit-prior:False
Unigram-DT criterion:gini, max-depth:6
Bigram-LR C:0.5, penalty:l2
Bigram-SVM kernel:linear
Bigram-NB alpha:0.5, fit-prior:False
Bigram-DT criterion:entropy, max-depth:5
SPM-LR C:0.5, penalty:l2
SPM-SVM kernel:linear
SPM-NB alpha:0.5, fit-prior:False
SPM-DT criterion:entropy, max-depth:5
Word emd MLP epoch 500, lr 0.001
Bert emd MLP epoch 1500, lr 0.0001
Siamese emd MLP epoch 1500, lr 0.0001
Siamese emd Attention epoch 1500, lr 0.0001
Table 8: Best parameter settings for age (3-bin).
Features Age (bin 3)
Unigram-LR C:0.5, penalty:none
Unigram-SVM kernel: linear
Unigram-NB alpha:0.5, fit-prior:False
Unigram-DT criterion:gini, max-depth:11
Bigram-LR C:0.5, penalty:non
Bigram-SVM kernel:linear
Bigram-NB alpha:0.5, fit-prior:False
Bigram-DT criterion:entropy, max-depth:11
SPM-LR C:0.5, penalty:none
SPM-SVM kernel:linear
SPM-NB alpha:0.5, fit-prior:False
SPM-DT criterion:entropy, max-depth:11
Word emd MLP epoch 500, lr 0.001
Bert emd MLP epoch 1500, lr 0.0001
Siamese emd MLP epoch 1500, lr 0.0001
Siamese emd Attention epoch 1500, lr 0.0001
DeLTA 2021 - 2nd International Conference on Deep Learning Theory and Applications
58
